
 ?Mathematical formulae have been encoded as MathML and are displayed in this HTML version using MathJax in order to improve their display. Uncheck the box to turn MathJax off. This feature requires Javascript. Click on a formula to zoom.
ABSTRACT
Different components of sustainability have been measured in previous studies at national, regional, and local scales. However, few efforts have aimed to measure water sustainability at the basin level. In this work, a water management sustainability index (WMSI) for quantifying water sustainability at the sub-basin level in Mexico is proposed. Variables related to water management in the environmental, social, economic, and institutional sub-systems of each sub-basin system were selected. The variables were aggregated in four sub-indexes based on a factor analysis, the sub-indexes scores were codified to indicate the level reached of water sustainability. The WMSI classified the water sustainability of the sub-basins of Mexico between poor and deficient, and the code classification indicated the level of compliance of the 969 sub-basins proposed by the National Institute of Statistics and Geography with sustainability criteria.
1. Introduction
Integrated water resources management (IWRM) is one approach to water management that aims to assess the state of socio-ecological systems based on the four sub-systems (economic, social, environmental, and institutional) that influence the sustainability of water management and use in the long term (CitationJefferies & Duffy, 2011). The sustainability of water resources is the ability to use water in sufficient quantity and quality to meet the needs of human beings and ecosystems, in the present and the future, with the objective of maintaining and protecting the hydrological functioning of basins (CitationMays, 2007). The watershed management practices are encouraged to be based on institutional factors and water parameters, with strategies to deal with three main challenges: (1) integrating and involving key stakeholders, (2) implementing a territorial management framework and (3) integrating multi-sectorial and territorial specificities (CitationOECD, 2011). In literature the concept of sustainability and water resource management have been extremely combined, but if sustainable fundaments are applied, it is expected that available water resources can be used by the present and future generations (CitationJuwana et al., 2009).
In recent decades, important efforts have been made to measure water sustainability at different scales (Citationda Silva et al., 2020; CitationFonseca et al., 2017). Despite these efforts, currently, is still necessary to generate a common framework for quantifying sustainability using indicators, especially for the complex context of water management in developing countries (CitationHák et al., 2016). However, water sustainability assessment requires an integration of its sub-systems into the decision making-process, such an evaluation is usually supported by indicators, indices and systems of indicators to convey the required information (Citationda Silva et al., 2020).
At a global level, several specific case studies have aimed to quantify water sustainability including the West Java Water Sustainability Index (CitationJuwana et al., 2010, Citation2009), the Water Poverty Index (CitationSullivan et al., 2003), and the Watershed Sustainability Index (CitationChaves & Alipaz, 2007). In one notable attempt, the international community proposed a common set of indicators and indexes related with the objectives of sustainable development within the framework of the Agenda 2030 action plan (CitationDESA, 2016). However, these indicators are not well understood or lack a simple or practical interpretation (CitationHák et al., 2018).
In Mexico, the efforts to evaluate water management sustainability have been focused to evaluate at local level how decision processes are affected by the participation and if the increase of participation results in predictable use of scientific information (CitationJacobs et al., 2016). CitationSandoval-Solis et al. (2011) evaluated the performance of scenarios of alternative policies from the perspective of water users and the environment to measure the adaptive capacity of a trans-boundary Basin of Mexico. However, the application of sustainable water management requires important changes in the objectives which decisions are based on and the understanding of articulations within the four sub-systems (CitationDurán-Sánchez et al., 2018).
1.1. Water management in Mexico
In Mexico, IWRM starts following the passage of the National Waters Law in 1992. The National Water Commission (CONAGUA) promoted the decentralization of its functions by the passage of this law in order to encourage citizen participation and the implementation of IWRM considering, among other principles, the hydrological basin as a basic unit for water administration (CitationCotler, 2004). To regulate the use of surface water in Mexico, the country was divided into 13 hydrological administrative regions (HARs), each with an intervention center under the direction of CONAGUA (CitationCONAGUA, 2012).
Despite the existence of several proposals for decentralized water management in Mexico (CitationRap & Wester, 2017), criteria for the participation of all stakeholders involved, including both governmental authorities and users, should be stipulated by law (CitationFMA, 2012). However, institutional deficiencies and the absence of consensus among institutions prevent the construction and adequate use of existing knowledge, making it more difficult to effectuate an appropriate management of Mexico’s basins (CitationCotler, 2004).
Sustainable water management in basins is a challenge that requires the identification of priority areas where economic resources should be invested in order to provide solid support for decision making. In a previous work hydrological regions that share similar characteristics were identified as a starting point for constructing water management strategies according to the specific characteristics and necessities of socio-ecosystems in Mexico (CitationCervantes-Jiménez et al., 2017).
Indexes are one tool of great value that enable the local conditions of socio-ecosystems to be evaluated based on reliable indicators. Furthermore, indexes can help to reduce complexity, to compare and rank results and to communicate the scientific outputs (CitationReckien, 2018). In addition, indexes can facilitate comparative analyses and represent one mechanism for informing decision making based on IWRM (CitationEsty & Porter, 2005; CitationMyllyviita et al., 2011). For this reason, in this work, a water management sustainability index (WMSI) is proposed for the sub-basins of Mexico to aid in the identification of specific priority problems and the formation of strategic and tactical development plans at the local level.
2. Materials and methods
In Mexico, the National Hydrological Program (CitationCONAGUA, 2014) monitors the fulfillment of the objectives and goals in water management through indicators. Many of these are not found in public databases and do not have spatial information. For that reason, information on key economic, social, environmental, and institutional variables related with water management was collected (Appendix 1). Variables were used if they were according with the selection criterion: (1) The indicator is available in public National databases, (2) The indicator has availability temporal information and (3) The indicator belongs to one of four sustainability dimensions. Database was represented for the reference year of 2010 or, in absence of variables for this year, in 2005 were selected.
2.1. Databases in Mexico
In Mexico, the National Institute of Statistics and Geography (INEGI) is responsible for generating statistical and geographical information. Its statistical databases contain information generated from the following censuses: (1) the Population and Housing Census (every 10 years), (2) the Economics Census (every 5 years), and (3) the Agricultural, Livestock, and Forestry Census (every 10 years). Additionally, INEGI generates geographic products on characteristics such as relief, vegetation, climate, soil and water. Accordingly, the variables related with the social sub-system and water sustainability were taken into account. In the social sub-system, the variable of average disability-adjusted life years (DALYs) generated by CitationGómez-Albores (2012) was also included. This latter variable combines the time lived with disability and the time lost due to premature death because of water-related intestinal disease.
The National System of Municipal Information (SNIM) provides statistics for each municipality based on census data. The censuses cover period of five years since 2005 or 2010. Variables related with the economic and social sub-systems were included from these databases.
The variables of the environmental sub-system were obtained from the databases of the National System of Environmental Indicators (SNIA) of the Secretariat of the Environment and Natural Resources (SEMARNAT), which provides a brief overview of the current state of Mexico’s environment and natural resources as well as the changes to the state of the environment (CitationSEMARNAT, 2010). The water indicators in this system provide information related with surface water extraction, water availability, the degree of pressure on water resources, the reutilization of wastewater, etc. Although these data span more than 10 years, the level of spatial detail is poor (only available at the HAR or state level). Meanwhile, the bioclimatic variables were obtained from the databases of WorldClim-Global Climate Data (CitationHijmans et al., 2005). These latter variables are available in raster format and represent the averages of the 1970–2000 period at a spatial resolution of 1 km2.
In the institutional sub-system, three variables related with water management were included. The databases of CONAGUA were considered to obtain information on the number of water management organizations in each HAR of Mexico. The number of businesses at the municipal level was obtained from the Mexican Business Information System (SIEM). Finally, the number of higher educational institutions at the municipal level was obtained from the databases of the National Association of Universities and Higher Education Institutions in Mexico (ANUIES).
2.2. Pre-treatment of variables
Given that the spatial scale (state, municipal, or HAR) and the data format (database, vector or raster) of the variables differed, the variables were pre-treated before analysis. The variables at the municipal level were transformed to densities per km2 and were distributed at the sub-basin level using a disaggregation model based on the distance between sub-basins and the centroids of urban localities. Accordingly, the average values of climate variables were extracted for the 969 sub-basins of the country. The treatment, management, and spatial representation of the variables was carried out with the geographical information systems Idrisi Selva (CitationEastman, 2012) and ArcMap 10.2 (CitationEsri, 2011).
The socio-ecological variables were normalized to determine whether positive values had a beneficial or detrimental effect on water sustainability. Normalization is used because it is a linear transformation that preserves the classification and correlation structure of the variables, and allows the coupling use of variables with different scales (CitationTran et al., 2010). This process was performed using the Delphi technique with area experts from the Inter-American Institute of Water Science and Technology (Instituto Interamericano de Tecnología y Ciencias del Agua [IITCA]) (CitationCervantes-Jiménez et al., 2017). This technique allows for structured and interactive communication between groups of experts, enabling solutions to complex problems to be found (CitationLandeta, 2006). Based on the beneficial direction of the effect generated by each variable, the scale of values of each variable was modified to a range of 0–1 using the Min–Max rescaling transformation method (CitationYoon, 2012), where 0 was the worst status and 1 was the best status. The database of these variables and the spatialization and modulation procedures can be consulted in greater detail in the work of CitationCervantes-Jiménez et al. (2017).
2.3. Factor analysis
Factor analyses (FA) is a technique to reduce the number of variables, creating a series of synthetic variables that explain most of the variance of the system based on a correlation matrix. This technique analyzes covariance (communality) and the goal is to reproduce the correlation matrix with a few orthogonal components (CitationTabachnick et al., 2007). The FA were used to group the input variables of each sub-system. The eigenvalues of synthetic variables constructed (Principal factors) indicate the contribution of each factor to the total variance of the sub-system, and the loading of the variables represents the importance of each variable for the factor (CitationSatyanarayanan et al., 2017).
Therefore, a FA was carried out using a rotation matrix (varimax) for each sub-system to obtain a simpler interpretation of the factors (CitationTabachnick et al., 2007). The procedure was carried out in the Systat version 12 software (Systat Software Inc) for the environmental, social, and economic sub-systems. This technique was not applied to the institutional sub-system because its variables were not correlated. The relevance of the analyses was verified using the Kaiser-Meyer-Olkin (KMO) criterion using the Psych package in the R statistical software (CitationR Development Core Team, 2009). Factors with an eigenvalue equal to or greater than 1 were selected (CitationKaiser, 1960).
The variables were normalized so that the highest value would coincide with the highest level of water sustainability with de Min–Max procedure. Thus, if the sum of the weights is positive, the Pf shows a positive condition and, in contrast, if the sum is negative, the best condition will correspond with the most negative factor ().
Figure 1. Method for the construction of the Water Management Sustainability Index (WMSI).
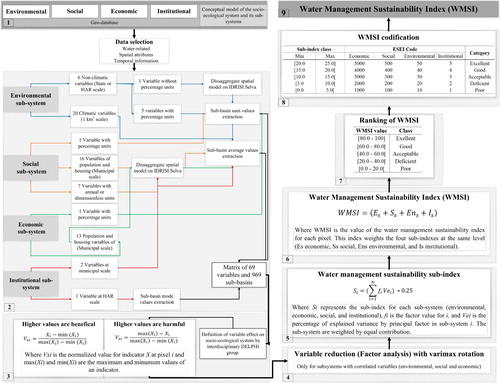
2.4. Weighting and aggregation of the sub-indexes
The weighting of the variables in each sub-index was performed using the proportion of explained variance for each Pf in each sub-system as a reference. However, the weights of the sub-systems of the WMSI was calculated from the equal contribution of the four sub-systems (Equation (1)). The range of values of the WMSI varied between 0 and 100, where 0 is the worst condition and 100 is the best condition. Therefore, each sub-system had a maximum value of 25.(1)
(1) where
is the value of the Sustainable Water Management Index per pixel,
is the score of economic sub-index,
is the score of social sub-index,
is the score of environmental sub-index, and
is the score of institutional sub-index.
The performance scale of the sustainability indexes is established subjectively in the water sustainability indexes (CitationGuidolini et al., 2018), thus in this work is proposed a technique based on the coding of the sub-indexes ranking to improve the interpretation of the WMSI. Since the WMSI does not reflect the specific conditions of the sub-systems of the sub-basins, a combination matrix with the ESEI codes (Economic, Social, Environmental, and Institutional) was designed in which the scores of the sub-indexes were represented by codes. For example, in the institutional sub-system, the code 1 corresponded with a sub-index value of 0–5.0, whereas the code 2 was assigned to a value of 5.0–10.00, and so on to the maximum ESEI code score of 5. The resulting ESEI codes were composed of four digits corresponding respectively with each sub-system (). Under this codification system, 1,024 distinct combinations were possible. The ideal code in a water sustainable sub-basin is 5555, which would indicate that the conditions of the four sub-indexes are excellent (ESEI total value of 20). Meanwhile, the most unfavorable conditions are represented by the code 1111 (ESEI total value of 4).
3. Results
A database of 69 variables was constructed for the 969 sub-basins of Mexico, including 26 variables in the environmental sub-system, 24 in the social sub-system, 16 in the economic sub-system, and 3 in the institutional sub-system.
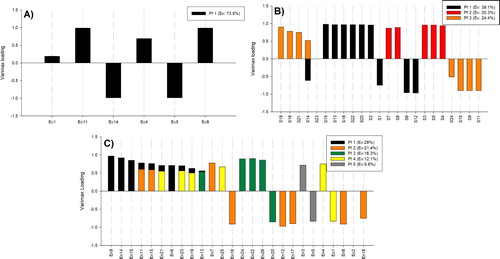
In the economic sub-system, the resulting Pf explained 73.5% of the variance and was related to a good force work condition. The presence of a large overall economically active population and large economically active population with a job (Ec 8 and Ec 11), each one explained 22% of the variance of the factor ((A)). In the social sub-system, the variables were aggregated in three Pf that explained 84.5% of the total variance ((B)). In the environmental sub-system, 26 variables were included, and five Pf explaining 83.8% of the total variance ((C)).
Figure 2. Weights of the main factors in the sub-systems: (A) economic, (B) social, and (C) environmental. Ev: Explained variance (%).
3.1. Integration of the WMSI
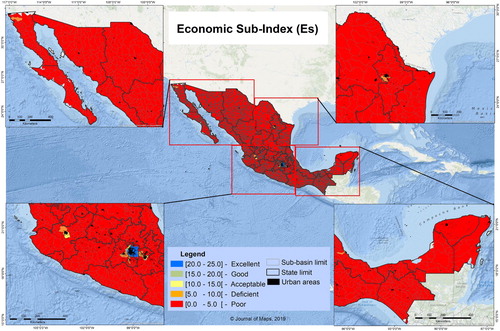
On the economic sub-index (Es), most of the sub-basins in the country received a poor score (0.0–5.0). However, in the urban sub-basins, economic conditions were slightly more favorable and, in particular, the sub-basin of the Valle de México presented excellent economic conditions ().
Figure 3. Economic sub-index of water management sustainability.
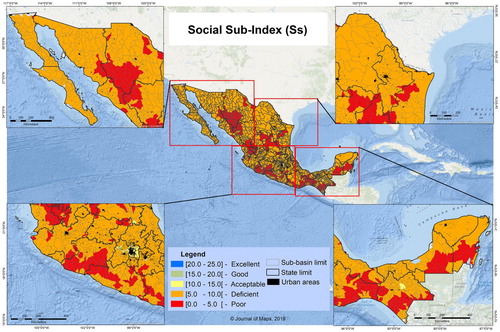
On the social sub-index (Ss), most of the country received a poor (0.0–5.0) or acceptable score (10.0–15.0). The social conditions in the most populated urban sub-basins of the country were scored as good ().
Figure 4. Social sub-index of water management sustainability.
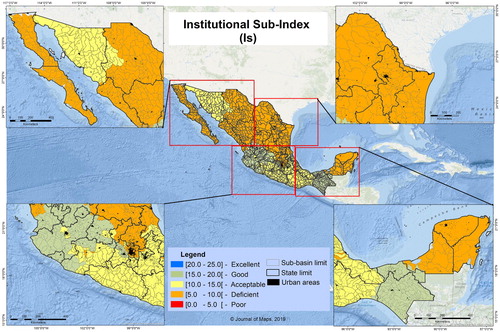
On the environmental sub-index (Ens), conditions varied between deficient (5.0–10.0) and good (15.0–20.0) across the country (). On the institutional sub-index (Is), most sub-basins varied between the categories of deficient and good ().
Figure 5. Environmental sub-index of water management sustainability.
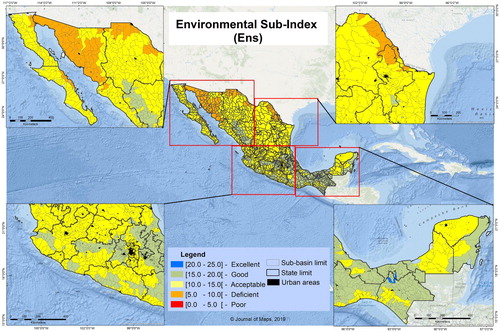
Figure 6. Institutional sub-index of water management sustainability.
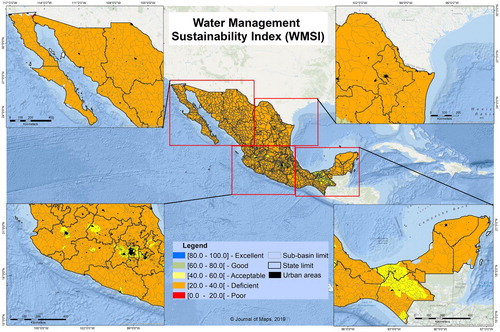
After summing the sub-indexes of the WMSI, most sub-basins of the country obtained an overall score within the categories of deficient (20.0–40.0) or acceptable (40.0–60.0). This classification is a simple means of assessing conditions in the sub-basins but is not descriptive of these conditions (). For this reason, the scores of the sub-indexes were codified (ESEI codes) to obtain a classification that would provide more precise information about the conditions of each sub-basin.
Figure 7. Water Management Sustainability Index for the 969 sub-basins of Mexico.
Under this classification, 97% of sub-basins belong to 14 distinct ESEI codes (Map, ). The most recurrent code is 1232 (276 sub-basins), which is indicative of poor economic conditions (1), deficient social conditions (2), acceptable environmental conditions (3), deficient institutional conditions (2).
Table 1. Number of sub-basins per ESEI code.
Meanwhile, 3% of the national territory (29 sub-basins) can be grouped in the category of uncommon sub-basins (Map). The WMSI value of this category is higher than most of the other sub-basins but remains within the category of acceptable (). Furthermore, the ESEI codes reveal a high level of socio-economic inequality across Mexico (): 4 sub-basins have values of 4 or 5 on the economic sub-index and, of these sub-basins, only one achieved the highest value (4) on the social sub-index (Puebla), and the three remaining sub-basins correspond with Mexico City and Toluca. In the category of uncommon, there are sub-basins classified with the best environmental conditions and sub-basins with the poorest conditions according to the ESEI codes ().
Figure 8. Characterization of water management sustainability of the uncommon sub-basins of Mexico using ESEI codes.
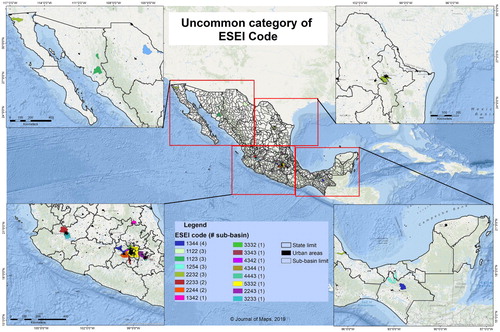
Table 2. ESEI codes for uncommon category of sub-basins of Mexico.
4. Discussion
The extreme conditions of socio-economic inequality in Mexico are undoubtedly reflected in the results of this study. According to the WMSI, Mexico is distinguished by the poor or deficient social and economic conditions in most of its sub-basins. The conditions of these latter two sub-systems cause the WMSI to generate a similar value across most of the country, even though the scores for the environmental and institutional sub-systems are more heterogeneous. Therefore, based on the global WMSI score, it is not possible to identify the sub-systems that require greater attention. For this reason, it is important to adopt a regional approach and to take into account the scores of the different sub-systems in order to guide development plans and propose rehabilitation or management actions (CitationCervantes-Jiménez et al., 2017).
In this respect, the ESEI codes reveal the overall panorama of water sustainability in Mexico as well as the specific conditions of the different sub-basins. The group of uncommon sub-basins partially coincides with the urban sub-basins with high population density that showed high values on the social and economic sub-indexes (CitationCervantes-Jiménez et al., 2017). Some of these sub-basins were classified as acceptable by the WMSI, but not all of them had good environmental conditions. On the other hand, some of the uncommon sub-basins presented high values on the environmental or institutional sub-indexes but not on the social or economic sub-indexes. In this context, according to CitationKong et al. (2016), these types of analyses are important because of their capacity to improve the integration of information related to the four main axes of hydrologic sustainability (economic, social, environmental, and institutional) in addition to promoting the social and interdisciplinary participation of stakeholders.
Furthermore, it is important to ensure that the databases of sub-systems are continually updated to ensure that the results of different tools, such as the one developed in this work, can accurately quantify the water sustainability. It is also necessary to strengthen the set of water sustainability indicators and the Mexican databases related with water management because much of the available information is not current and certain indicators, such as those relating to the sustainability of the water supply, are not reported on (CitationRichter et al., 2018). It has been reported that the institutional dimension is one weakness aspect for water management, the reason in part is the way that institutions uses new research related to water management to take decisions (CitationJacobs et al., 2016). In this sense, the lack of information in the institutional sub-system is especially notable and would help to strengthen the WMSI. Additionally, institutional indicators related to the professional status of decision-makers and of the success of collaborations or projects, among other indicators, would be helpful for reflecting the condition of the different institutional sub-systems in Mexico.
5. Conclusion
The Water Management Sustainability Index (WMSI) proposed was capable of modeling the conditions of the economic, social, environmental, and institutional sub-systems of hydrological sustainability in Mexico within a spatiotemporal framework. According to the WMSI of the sub-basins of the country, the most vulnerable sub-systems in terms of water sustainability are the economic, social, and institutional sub-systems. However, for this latter sub-system, the information available at the national level is limited.
In general, the environmental sub-system did not receive low scores in the ESEI codification of the sub-basins. This may be related to the abundance of water resources in Mexico, which may be viewed as an opportunity during decision making to improve water management. Some environmental aspects could not be included in the environmental sub-index because information was lacking. The WMSI values provide an overall panorama of the economic, social, environmental, and institutional conditions in Mexico, but the generation of the ESEI codes allowed a more precise diagnosis of the sustainability of the different sub-systems of the sub-basins.
Undoubtedly, one core issue in this work was related to the sources of information, especially the information for quantifying connectivity in the institutional sub-index. However, the present study is maybe the first in which the institutional sub-system was included as a measure of water sustainability in Mexico.
Software
The processing of the databases was performed in Microsoft Excel 2016. In the Idrisi Selva software, point data were transformed to spatial data. The graphs were made in Sigma Plot (version 11.0). The references were managed with Zotero (version 5.0.47).
Open Scholarship


This article has earned the Center for Open Science badge for Open Data. The data are openly accessible at 10.5281/zenodo.3783872.
This article has earned the Center for Open Science badge for Open Materials. The materials are openly accessible at 10.5281/zenodo.3783872
Map 1. Characterization of the water management sustainability of the sub-basins of Mexico using ESEI codes. The number of sub-basins belonging to each code is indicated in the parentheses.
Download PDF (20.4 MB)Acknowledgements
The first author wishes to thank the Autonomous University of the State of Mexico for the scholarship to further her studies in the Water Science Program.
Disclosure statement
No potential conflict of interest was reported by the author(s).
Data availability statement
The data supporting the findings of this study are freely accessible in the ‘Datos Abiertos México’ section of the following webpage: https://datos.gob.mx/.
The data for average disability-adjusted life years (DALYs) due to intestinal disease and mean natural water availability used in this study are available in the supplementary materials of the following thesis: Gómez-Albores, M.A. Modelación Geomática de Medidas de Frecuencia y de Asociación, Aplicada a Enfermedades Vinculadas con el Agua. Ph.D. Thesis, Universidad Autónoma del Estado de México, Facultad de Ingeniería, Centro Interamericano de Recursos del Agua (CIRA), Toluca de Lerdo, México, 2012.
Correction Statement
This article has been republished with minor changes. These changes do not impact the academic content of the article.
Additional information
Funding
Related Research Data
References
- Cervantes-Jiménez, M. , Mastachi-Loza, C. A. , Díaz-Delgado, C. , Gómez-Albores, M. Á. , & González-Sosa, E. (2017). Socio-ecological regionalization of the urban sub-basins in Mexico. Water , 9 (1), 14. https://doi.org/10.3390/w9010014
- Chaves, H. M. , & Alipaz, S. (2007). An integrated indicator based on basin hydrology, environment, life, and policy: The watershed sustainability index. Water Resources Management , 21 (5), 883–895. https://doi.org/10.1007/s11269-006-9107-2
- Comisión Nacional del Agua (CONAGUA) . (2012). Atlas del agua en México 2012 (1st ed.). Secretaría de Medio Ambiente y Recursos Naturales.
- Comisión Nacional del Agua (CONAGUA) . (2014). Programa Nacional Hídrico (PNH) 2014–2018. http://www.gob.mx/conagua/acciones-y-programas/programa-nacional-hidrico-pnh-2014–2018
- Cotler, H. (2004). El manejo integral de cuencas en México: Estudios y reflexiones para orientar la política ambiental. Secretaría de Medio Ambiente y Recursos Naturales: Instituto Nacional de Ecología.
- da Silva, J. , Fernandes, V. , Limont, M. , Dziedzic, M. , Andreoli, C. V. , & Rauen, W. B. (2020). Water sustainability assessment from the perspective of sustainable development capitals: Conceptual model and index based on literature review. Journal of Environmental Management , 254 , 109750. https://doi.org/10.1016/j.jenvman.2019.109750
- DESA, U. D. of E. and S. A . (2016). Transforming our world: The 2030 agenda for sustainable development.
- Durán-Sánchez, A. , Álvarez-García, J. , Río-Rama, D. , & De la Cruz, M. (2018). Sustainable water resources management: A bibliometric overview. Water , 10 (9), 1191. https://doi.org/ 10.3390/w10091191
- Eastman, J. (2012). IDRISI Selva . Clark University.
- Esri, A. D. (2011). Release 10. Documentation manual. Redlands . Environmental Systems Research Institute.
- Esty, D. C. , & Porter, M. E. (2005). National environmental performance: An empirical analysis of policy results and determinants. Environment and Development Economics , 10 (04), 391–434. https://doi.org/10.1017/s1355770X05002275
- Fonseca, C. R. , Díaz-Delgado, C. , Esteller, M. V. , & García-Pulido, D. (2017). Geoinformatics tool with an emergy accounting approach for evaluating the sustainability of water systems: Case study of the Lerma river, Mexico. Ecological Engineering , 99 , 436–453. https://doi.org/10.1016/j.ecoleng.2016.11.034
- Foro Mundial del Agua (FMA) . (2012). Proceso regional de las Américas, VI Foro Mundial del Agua. Hacia una buena gobernanza para la gestión integrada de los recursos hídricos. http://www.inegi.org.mx/RDE/RDE_08/Doctos/RDE_08_Art4.pdf
- Gómez-Albores, MÁ . (2012). Modelación geomática de medidas de frecuencia y de asociación, aplicada a enfermedades vinculadas con el agua . Universidad Autónoma del Estado de México, Facultad de Ingeniería, Centro Interamericano de recursos del agua (CIRA).
- Guidolini, J. F. , Giarolla, A. , Toledo, P. M. , Valera, C. A. , & Ometto, J. P. H. B. (2018). Water sustainability at the River Grande Basin, Brazil: An approach based on the barometer of sustainability. International Journal of Environmental Research and Public Health , 15 (11), 2582. https://doi.org/10.3390/ijerph15112582
- Hák, T. , Janoušková, S. , & Moldan, B. (2016). Sustainable development goals: A need for relevant indicators. Ecological Indicators , 60 , 565–573. https://doi.org/10.1016/j.ecolind.2015.08.003
- Hák, T. , Janoušková, S. , Moldan, B. , & Dahl, A. (2018). Closing the sustainability gap: 30 years after “our common future”, society lacks meaningful stories and relevant indicators to make the right decisions and build public support. Ecological Indicators , 87 , 193–195. https://doi.org/10.1016/j.ecolind.2017.12.017
- Hijmans, R. J. , Cameron, S. E. , Parra, J. L. , Jones, P. G. , & Jarvis, A. (2005). Very high resolution interpolated climate surfaces for global land areas. International Journal of Climatology , 25 (15), 1965–1978. https://doi.org/10.1002/joc.1276
- Jacobs, K. , Lebel, L. , Buizer, J. , Addams, L. , Matson, P. , McCullough, E. , Garden, P. , Saliba, G. , & Finan, T. (2016). Linking knowledge with action in the pursuit of sustainable water-resources management. Proceedings of the National Academy of Sciences , 113 (17), 4591–4596. https://doi.org/10.1073/pnas.0813125107
- Jefferies, C. , & Duffy, A. (2011). The SWITCH transitioning manual. Pp. 1016.
- Juwana, I. , Perera, B. , & Muttil, N. (2009). Conceptual framework for the development of West Java water sustainability index (pp. 3343–3349).
- Juwana, I. , Perera, B. , & Muttil, N. (2010). A water sustainability index for West Java. Part 1: Developing the conceptual framework. Water Science and Technology , 62 (7), 1629–1640. https://doi.org/10.2166/wst.2010.452
- Kaiser, H. F. (1960). The application of electronic computers to factor analysis. Educational and Psychological Measurement , 20 (1), 141–151. https://doi.org/10.1177/001316446002000116
- Kong, N. , Li, Q. , Sangwan, N. , Kulzick, R. , Matei, S. , & Ariyur, K. (2016). An interdisciplinary approach for a water sustainability study. Papers in Applied Geography , 2 (2), 189–200. https://doi.org/10.1080/23754931.2015.1116106
- Landeta, J. (2006). Current validity of the Delphi method in social sciences. Technological Forecasting and Social Change , 73 (5), 467–482. https://doi.org/10.1016/j.techfore.2005.09.002
- Mays, L. W. (2007). Water resources sustainability . McGraw-Hill.
- Myllyviita, T. , Hujala, T. , Kangas, A. , & Leskinen, P. (2011). Decision support in assessing the sustainable use of forests and other natural resources- a comparative review. The Open Forest Science Journal , 4 (1), 24–41. https://doi.org/10.2174/1874398601104010024
- Organization for Economic Co-operation and Development (OECD) . (2011). Water Governance in OECD Countries. https://doi.org/10.1787/9789264119284-en
- Rap, E. , & Wester, P. (2017). Governing the water user: Experiences from Mexico. Journal of Environmental Policy & Planning , 19 (3), 293–307. https://doi.org/10.1080/1523908X.2017.1326305
- R Development Core Team . (2009). R: A language and environment for statistical computing. R Foundation for Statistical Computing. https://www.r-project.org
- Reckien, D. (2018). What is in an index? Construction method, data metric, and weighting scheme determine the outcome of composite social vulnerability indices in New York City. Regional Environmental Change , 18 (5), 1439–1451. https://doi.org/10.1007/s10113-017-1273-7
- Richter, B. D. , Blount, M. E. , Bottorff, C. , Brooks, H. E. , Demmerle, A. , Gardner, B. L. , Herrmann, H. , Kremer, M. , Kuehn, T. J. , Kulow, E. , Lewis, L. , Lloyd, H. K. , Madray, C. , Mauney, C. I. , Mobley, B. , Stenseth, S. , & Strick, A. W. (2018). Assessing the sustainability of urban water supply systems. Journal – American Water Works Association , 110 (2), 40–47. https://doi.org/10.1002/awwa.1002
- Sandoval-Solis, S. , McKinney, D. C. , & Loucks, D. (2011). Sustainability index for water resources planning and management. Journal of Water Resources Planning and Management , 137 (5), 381–390. https://doi.org/10.1061/(ASCE)WR.1943-5452.0000134
- Satyanarayanan, M. , Eswaramoorthi, S. , Subramanian, S. , & Periakali, P. (2017). Factor analysis of rock, soil and water geochemical data from Salem magnesite mines and surrounding area, Salem, southern India. Applied Water Science , 7 (5), 2607–2616. https://doi.org/10.1007/s13201-016-0411-6
- Secretaría del Medio Ambiente y Recursos Naturales (SEMARNAT) . (2010). Sistema Nacional de Indicadores Ambientales. http://apps1.semarnat.gob.mx/dgeia/indicadores14/conjuntob/00_conjunto/temas.html?De=SNIA
- Sullivan, C. , Meigh, J. , Giacomello, A. , Fediw, T. , Lawrence, P. , Samad, M. , Mlote, S. , Hutton, C. , Allan, J. , Schulze, R. , Dlamini, D. , Cosgrove, W. , Priscoli, J. D. , Gleick, P. , Smout, I. , Cobbing, J. , Calow, R. , Hunt, C. , Hussain, A. , … Steyl, I. (2003). The water poverty index: Development and application at the community scale. Natural Resources Forum , 27 , 189–199. https://doi.org/10.1111/1477-8947.00054
- Tabachnick, B. G. , Fidell, L. S. , & Ullman, J. B. (2007). Using multivariate statistics (Vol. 5). Pearson.
- Tran, L. T. , O’Neill, R. V. , & Smith, E. R. (2010). Spatial pattern of environmental vulnerability in the Mid-Atlantic region, USA. Applied Geography , 30 (2), 191–202. https://doi.org/10.1016/j.apgeog.2009.05.003
- Yoon, D. K. (2012). Assessment of social vulnerability to natural disasters: A comparative study. Natural Hazards , 63 (2), 823–843. https://doi.org/10.1007/s11069-012-0189-2
Appendix
Appendix 1. Variables used for the Water Management Sustainability Index. Beneficial (+) or harmful (−) effect.