
ABSTRACT
The 16th of June 1818, the failure of the Giétro glacier in the Swiss Alps provoked an outburst flood that devastated the Bagnes valley, causing 34 deaths and major damages to buildings, road system, hydraulic infrastructures and crops. This disaster had a major impact on the economy of the valley and created a great movement of solidarity. It remains today a well-known historical natural disaster. In order to reconstruct the course of the wave and to map the flood, we used an interdisciplinary approach by crossing historical and geomorphological data. We first compiled and mapped the large number of historical data available in the local and state archives. These data were then completed by geomorphological observations made on the field and on numerical documents. The resulting map presents the spatial extent of the flood and water depths. This article shows the validity of interdisciplinary approaches for reconstructing past natural disasters.
1. Introduction
In mountain areas, water-related events, such as floods and debris flows, are among the most common hazards that the local populations are facing. Glacial lake outburst floods represent a specific type of flood, caused by the failure of an ice or moraine dam impounding a lake, provoking the sudden discharge of the water body (Clague & O’Connor, Citation2015; CitationHarrison et al., 2018). The phenomenon is much more brutal compared to floods due to intense rainfalls, because a large volume of water is discharged in a very short time. Furthermore, the onset of the phenomenon may be ‘hidden’ in remote areas. Glacial lake outburst floods can have large impact on the morphology of the valleys, by provoking strong erosion in some places and the deposition of huge amounts of sediments in others locations, including large boulders (CitationCenderelli & Wohl, 2003; CitationCosta, 1983; CitationKershaw et al., 2005). The marks in the landscape can thus potentially be preserved several decades or centuries after the event (e.g. CitationBaker, 2002; CitationRudoy, 2002).
Glacial lakes can form in different situations: they can be supraglacial, englacial, subglacial, proglacial, or juxtaglacial (i.e. in between a glacier tongue and the valley slope). The water body can also take place in the main valley behind a tributary glacier (Clague & O’Connor, Citation2015). In the current context of deglaciation, the number of such lakes tends to increase (CitationCarrivick & Quincey, 2014). By nature, ice dams are fragile and each situation can lead to the rupture. Water usually drains through cracks or tunnels through the dam. By thermal and mechanical erosion, the tunnel can enlarge, which in turns leads to the quick emptying of the lake (CitationBjörnsson, 2010). The draining is usually much more brutal when failure occurs due to increased hydrostatic pressure, provoking sudden rupture (Clague & O’Connor, Citation2015). Other situations concern water pocket outburst (CitationVincent et al., 2010), including jökulhlaups (e.g. CitationRoberts, 2005), and overtopping of the lake due to snow, ice or rock avalanche in the lake (CitationHarrison et al., 2018).
A large number of glacial lake outburst floods have been reported in the Alps, in particular in Switzerland (CitationHaeberli, 1983). Such events occurred several times in the Bagnes valley (Swiss Alps) during the Little Ice Age, due to the damming of the Dranse de Bagnes River by lateral glaciers. The last major event occurred in June 1818, when an ice dam built by the Giétro glacier () broke up, discharging suddenly 20 million cubic meters of water in the valley (CitationEscher de la Linth, 1818; CitationGard, 1988; CitationPayot et al., 2018). This event is known as the Giétro outburst flood (La débâcle du Giétro in French), and is often mentioned in the literature (e.g. CitationCarrivick & Tweed, 2016; CitationHaeberli, 1983). It is by far the most significant disaster of this type that occurred in Switzerland during the last centuries and is one of the world’s most documented glacial lake outburst flood (CitationAncey et al., 2019a). It devastated all the valley down to the city of Martigny on a distance of about 35 km, killing 34 people and destroying hundreds of buildings as well as the road system and hydraulic infrastructures. To commemorate the bicentenary of the event, an interdisciplinary conference gathering together geographers, glaciologists, historians and anthropologists was organized in June 2018, in order to better understand the causes and consequences of the disaster (CitationAnnales valaisannes, 2019).
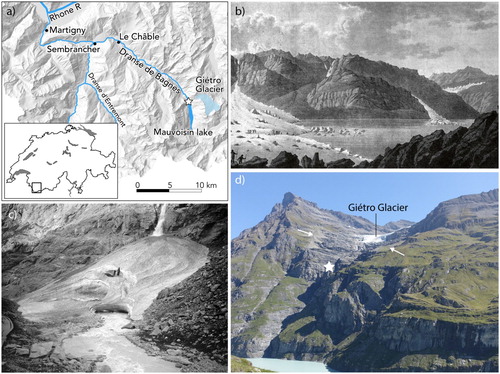
Figure 1. (a) Location of the Bagnes valley in the Swiss Alps, with the Giétro glacier and the location of the 1818 ice cone (star). (b) The ice cone (regenerated glacier) and the lake in spring 1818. Unsigned drawing, attributed to Théophile Steinen. (c) The ice cone in 1920. Photographer unknown © ETH-Bibliothek Zürich, Bildarchiv. (d) View on the Giétro glacier in August 2017, with the Little Ice Age moraines (arrows) and the approximate frontal position of the glacier in 1818 (star). Downside is the Mauvoisin dam lake. Photo C. Lambiel.
The understanding and reconstruction of past disasters, such as floods or snow avalanches, generally requires the use of methods derived from natural and social sciences (CitationBenito et al., 2004; CitationWiniwarter et al., 2013). Indeed, the geomorphological ‘witnesses’ of the events are not always sufficient and must be completed by analyses of the memory of societies, either archaeological, written or oral. The history of natural disasters can then be investigated through geohistorical approaches (e.g. CitationGiacona et al., 2017). This has been especially done for flood events by using physical data together with historical documents (e.g. CitationBenito et al., 2004). Typical paleohydrological data include boulder deposits, lateral and vertical accretion of fine-grained sediments and erosion edges (CitationMacklin et al., 1992; CitationJones et al., 2010; Wilhelm et al., Citation2019). Historical data are very diverse, since they can include images, maps, chronicles, articles in newspapers, technical reports, etc. Such documents are especially useful for the reconstruction of the spatial extent of floods that occurred before the invention of the photography and prior to instrumentation records (e.g. CitationBrázdil et al., 2006; CitationHimmelsbach et al., 2015). The combining of these data can then be used to reconstruct flood extent and water level (Wilhelm et al., Citation2019).
This approach has been used to map the spatial extent of the flood and to assess the water depths caused by the Giétro outburst flood (See Main map). The aim of this article is to present the map of the flood and the methodology used to achieve it. In a first section, we describe the disaster itself, before presenting the way followed to reconstruct the flood extent, based mainly on historical and geomorphological data. We give then a general overview of the map and present few sectors of particular interest for illustrating the methodology, before discussing the results and the limitations of the study.
2. The Giétro outburst flood
The Giétro outburst flood was due to the break-up of an ice dam built by the Giétro glacier in the Bagnes valley (Swiss Alps) ((a)). In the early nineteenth century, the terminus of the glacier reached steep rocky slopes ((d)), from where ice avalanches triggered to build eventually a regenerated glacier down valley ((b,c) + Main map). Following the Tambora eruption in April 1815 and the consecutive ‘Year without summer’ in 1816 (CitationBrönnimann & Krämer, 2016; CitationD’Arcy Wood, 2015), the regenerated glacier grew rapidly, reaching a volume of ∼10 million cubic meters in Spring 1818 (CitationFunk et al., 2019). This blocked the flow of the Dranse de Bagnes River, which led to the formation of a lake of 30 million cubic meters (CitationEscher de la Linth, 1818).
Having in mind the outburst flood of the Giétro glacier in 1595 that devasted the valley and killed 140 people (CitationBridel, 1818), the inhabitants of the valley alerted the authorities of the canton of Valais. To prevent a new disaster, the latter mandated the cantonal engineer Ignace Venetz for mitigating the crisis. The solution imagined by Venetz was to empty the lake by digging a tunnel through the ice cone some meters above the lake level, so that the water would drain through the tunnel once reached its base, and, by thermal and mechanical erosion, would lower down the tunnel floor, which would gradually empty the lake (see CitationPayot et al., 2018 and CitationAncey et al., 2019a for additional details). The works were performed between the 11th of May and the 13th of June 1818. This allowed for the release of 10 million cubic meters of water, but in the meantime provoked a strong erosion at the base of the ice cone by the waterfall created by the flow, as well as water infiltration through the ice and the sediment below the glacier. After several precursor signals, the ice dam broke up the 16th of June at 4:30 pm, letting the 20 million cubic meters of remaining water emptying in 30 minutes. The peak discharge was estimated between 8000 et 15,000 m3/s (CitationAncey et al., 2019a, Citation2019b; CitationFunk et al., 2019). Charged with ice, sediment and wood, the flood devastated the valley and reached the city of Martigny one hour and half later, before getting to the Rhone River, at 459 m a.s.l.
Despite the alarm system settled up, the wave killed 34 persons, mainly in the city of Martigny, as well as a large number of domestic animals (CitationPayot et al., 2018). 365 buildings were destroyed, among them houses, chalets, granaries, mills and stables. All the 17 bridges of the valley were destroyed, as well as numerous road sections. A high number of parcels (meadows, fields, orchards) were taken away, destroyed or covered by sediment, causing an important economic impact for a valley whose economy relied mainly on agriculture. The Giétro outburst flood had repercussions in several domains, from the history of glaciology (the Glacial theory emerged at this occasion) to the mitigation of natural hazards. It impressed strongly and durably the local population and remains a well-known event nowadays (CitationHugon-Duc, 2018).
This event can be considered as an uncommon glacial lake outburst flood, because (1) the dam consisted of a regenerated glacier and thus resulted from a cascading process and (2) because the dam failure was due to an artificial tunnel, even if without any human intervention the dam would have failed anyway, provoking a much bigger disaster (CitationFunk et al., 2019).
3. Material and methods
To reconstruct the spatial extent of the flood, we have adopted an interdisciplinary approach (CitationReynard et al., 2019) by compiling both historical sources and geomorphological observations (), and considering also the simulations of Ancey et al. (Citation2019a, Citation2019b) in the area of Martigny, where fewer data exist.
Table 1. Places where historical and/or geomorphological data are available. They are indicated on the map, together with the water depth for a part of them. They can also be visualized on the mapviewer of Swisstopo www.map.geo.admin.ch.
3.1. Historical sources
The Giétro outburst flood is one of the most documented disaster of this type (CitationFunk et al., 2019).
Because it had a dramatic impact for the population and the economy of the valley, the historical sources about the disaster are numerous: more than 500 sources have been reported in two recent studies (CitationCorboz, 2015; CitationPayot et al., 2018). These sources are conserved in different institutions, the main ones being the Archives of the canton of Valais (ACV) and those of the commune of Martigny and of the Grand-Saint-Bernard hospice (see CitationReynard et al., 2019 for details). The archives contain information on damages to the human infrastructures, reports on the reach of the flood, works carried out before the outburst for mitigating the crises and reconstruction works. Only the documentation that mention explicitly the flood was used, in particular reports of experts sent on the spot, chronicles by local observers and declarations of victims. The most useful data are the one about destructions of buildings, bridges, roads, hydraulic infrastructures and those containing information about the damaged properties, like meadows, fields, orchards, stables, hay lofts or houses. Data indicating if the property was removed or covered by sediment were also very useful (CitationReynard et al., 2019). Each source that mentioned the disaster was inserted in a database containing 8 attributes (): identifier, archive number, origin, location, type of document (report, chronicle, list of damages, etc.), type of damage (human, infrastructure, crops, other) and a brief description of the document. A total of 151 documents were used. The location of the damages and their categorization were then inserted in a GIS. We also took into consideration accounts on the water depth and on the extent of the flood made by witnesses present during the flood event or having observed the damages the days after (e.g. CitationBridel, 1818; CitationEscher de la Linth, 1818). Most of these data have been summarized by CitationGard (1988), CitationCorboz (2015), CitationPayot et al. (2018) and CitationHugon-Duc (2018).
Table 2. Example of sources used to outline the flood extent. ACV: Archives of the canton of Valais.
3.2. Geomorphological data
The large volume of water released in so little time has inevitably impacted the morphology of the valley, inducing strong lateral erosion in narrow sections and deposition of large amounts of debris in the gentler slopes and broader sections (See Main map). The morphology of the valley is thus an important controlling factor for the erosion or deposition processes. Here, we are dealing with a sudden and extreme event which could mobilize large boulders, which is not possible with a conventional flood (CitationTurzewski et al., 2019). The best markers of the event are thus the boulder accumulations in the flat sectors where deposition prevailed. Braided-river deposits located at distance of the current river bed may also be linked to the event. As the latter is, by far, the most important of the two last centuries, these geomorphological evidences could be attributed to the 1818 disaster with a high level of certainty. Eventually, erosion scars can be present all along the valley. Their attribution to this single event is however tricky and care must be taken with such markers.
To identify the morphological signatures of the flood, we first made a systematic analysis on the field, from the place of the outburst up to the Martigny area. In particular, we visited all the relatively flat sections where sediments were potentially deposited. We also paid a special care to the erosion edges located at the base of alluvial fans of lateral torrents or in the alluvial plain of the Dranse de Bagnes River. These field observations were completed by the analysis of historical aerial and terrestrial images dating back to the years 1930–1950. They helped to observe the landscape before the rapid expansion of the villages during the second part of the twentieth century and before the building of the Mauvoisin hydroelectric dam in the 1950s, which has strongly impacted the discharge of the Dranse de Bagnes River. Another source of information was the shaded digital elevation model (DEM) of Swisstopo SwissAlti3D. Thanks to its 50 cm resolution, it allowed the observation of numerous details that are often not detectable on the field, especially in forested sectors. It was particularly useful to observe relict channels and sediment accumulations in the alluvial plain. Old maps such as the Siegfried, the Dufour and the Napoléon maps (see CitationReynard, 2009 for a description of technical characteristics) were also consulted. All these documents can be visualized on the map viewer of Swisstopo www.map.geo.admin.ch
3.3. Creation of the map
The mapping of the flood extent was completed in Arc GIS 10.5.1 at the 1:25,000 scale on the Swiss topographic basemap with the following procedure:
-
The damages reported in the archive documents, in particular, the building destroyed, were systematically mapped. Similarly, the sectors spared by the wave were also mapped. Additional information coming from the narratives of the disaster that gave insights on the sectors affected by the flood and on the possible water depths was also used. These historical data permitted us to outline the extent of the flood and to estimate the water depth in given locations;
-
Sediment accumulations that could be attributed to the disaster were reported on the map from aerial images and field visits. This includes both boulder berms and finer sediment deposits, present under the form of alluvial fans or other typical fluvial deposits. The top of the deposits gave indications on the water elevation during the flood;
-
Lateral erosion edges linked with the Holocene and recent evolution of the Dranse River were systematically mapped from aerial images, DEM and field visits. Where their elevation corresponded to the water level estimated by historical data, they were considered as possibly linked with the 1818 flood;
-
The crossing of these historical and geomorphological data allowed us to map locally the lateral extent of the flood;
-
From this, we calculated the water depth by measuring on the DEM the altitude difference between the current river bed and the top of the water level reached during the flood, giving thus the maximal water depth on a transect profile. This was done for locations with the highest level of certainty. It is worth to note that the obtained values are altitudes above the current river bed, since those before the flood are not known;
-
The water depths calculated in single locations were used to assess water depths in similar topographies, for which no information was available. This principle of analogy permitted us eventually to outline the flood extent, using the topographic map and the DEM data.
4. Results
The map presents the spatial extent of the flood provoked by the Giétro outburst flood from the ice dam up to the junction with the Rhone River (See Main map). Also represented are the boulders deposits, the erosion edges that we considered as possibly linked with the 1818 flood, as well as the location of the bridges and of the groups of buildings destroyed, classified by their number. The locations where water depths could be assessed are indicated and completed by five cross-profiles of selected places.
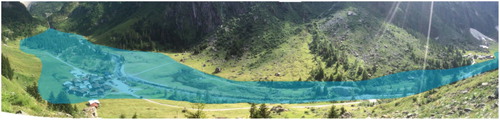
The first reference to the course of the wave in historical documents concerns a 25 m deep gorge located 1 km downstream of the ice dam at Mauvoisin, which led water raise up to 8 m higher than the gorge and the destruction of the first bridge (See Main map). One kilometer downstream at Le Tseppi, a second 30 m deep gorge had the same influence on the wave, accelerating the current. Just downstream, the widening of the valley in the sector of Bonatchiesse caused the slowing down of the water and consecutively the deposit of large amounts of sediments. The hamlet of Bonatchiesse was completely destroyed by the wave (70 buildings). Particularly spectacular is the boulder accumulation on about 15 ha in the center of the valley ( and ). Their petrography excludes any rockfall deposit and indicates thus that the blocks must have been transported from upstream. The DEM shows that the blocks are located at the surface of an alluvial fan with several relict channels (), which excludes any glacial transport and indicates thus a fluvial deposit. Given its old facies (well-developed vegetation cover with forest, presence of lichens on the boulders), the deposit can be attributed to the Giétro event. The elevation difference between the current river bed and the highest point of the fan is about 7 m. This value gives us an indication on the maximum water depth during the flood. Just downstream of Bonatchiesse the valley narrows and two 10 m high terraces are visible on each side of the river (). They probably indicate the maximum water level reached by the flood, which may have been 15 m here. This can be considered as a maximum value, as no building was destroyed in Brecholey, a hamlet located just above the terrace on the left side of the Dranse River. The combination of all these data allowed the outline of the flood to be delimited with a high level of certainty in this sector ().
Figure 2. Shaded DEM (SwissAlti3D) of the Bonatchiesse sector. Well visible is the alluvial fan with the channels built by the outburst flood southeast of Bonatchiesse (dotted white line), as well as the two terraces (black arrows). The star shows the location of the boulders on . The topographic cross-profile through the fan shows the thickness of the deposits. Red squares are the current buildings. Reproduced by permission of swisstopo (BA19054).
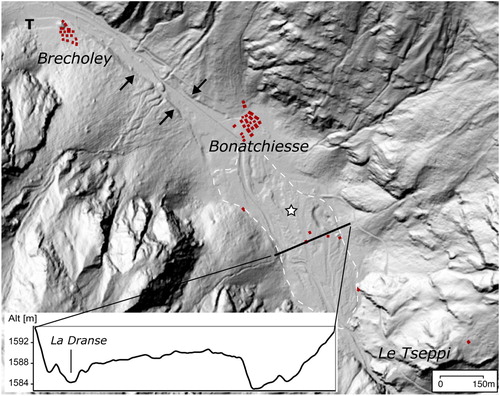
Figure 3. Boulders present in the Bonatchiesse sector on the alluvial fan (See for location).
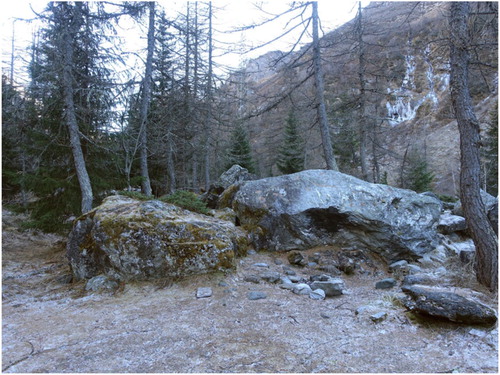
Figure 4. Erosion edge upstream of Brecholey that shows the probable maximum water level during the event (See for location).
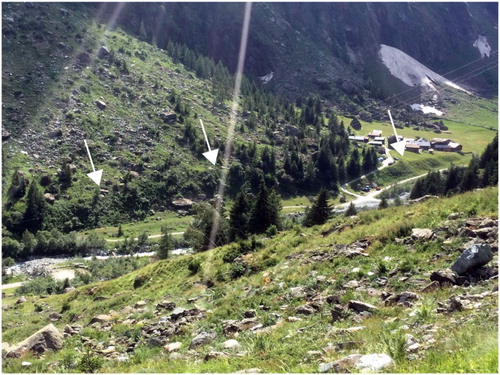
Figure 5. The flood extent in the Bonatchiesse and Brecholey sector.
Large destructions occurred in the three following hamlets of Fionnay, Plamproz and Lourtier, where a total of 172 buildings were destroyed (See Main map). Various historical sources talk of a mass of water mixed with wood from destroyed buildings and from forests, and report the deposit of huge masses of rocks and strong lateral erosion that destroyed the road in several sectors (CitationBridel, 1818; CitationEscher de la Linth, 1818).
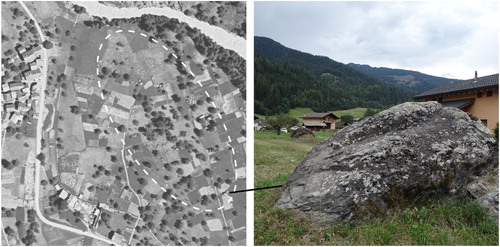
The most affected village is Champsec, where 77 buildings were destroyed. Unlike Bonatchiesse, this village was inhabited all year long. The valley is relatively large and flat here, which permitted the deposition of a large amount of sediments, as shown by the convex cross-profile and the presence of boulders in the middle of the valley ( and ). Maximum water depth can be estimated to have been 6 meters, according to the cross-profile. North-West of the village, a small dry valley probably indicates that the flood separated into two branches after having deposited the main sediment load, one following the current river channel and the other one passing through the village before getting along the base of the large Versegères alluvial fan. Given the large size of this dry valley, it is however probable that it had been already dug by former outburst floods, in particular the one of 1595. This interpretation is attested by a letter written by an observer the day after the disaster, which mention that the river was digging below the hamlet of La Montoz that was about to collapse (CitationHugon-Duc, 2018, p. 21).
Figure 6. The flood extent between Lourtier and Champsec. The sketch shows the topographic cross-profile through the Champsec plain, from the Versegères alluvial fan (near La Montoz) up to the current river bed of the Dranse River to the ENE, with the convex section due to the sediment deposits. The shaded DEM shows nicely the dry valley (arrow). Reproduced by permission of swisstopo (BA19054).
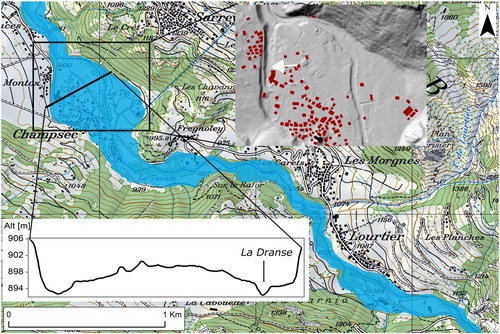
Figure 7. Left: Location of the boulders deposited in Champsec during the outburst flood (dotted line). Aerial photography of 1935, reproduced by permission of swisstopo (BA19054). Right: Close view on one boulder.
Champsec is the last place were big boulders were deposited. From here downstream, most of the sediment load was made of sand, gravel, pebbles and small blocks. The wave reached Le Châble 40 minutes after the break-up of the dam. The bridge that crosses the river in the middle of the village resisted longtime before breaking, which blocked the wood transported, causing a dam and a consecutive flood of a part of the village. The water raised up to 16 m high in this incised section (See Main map).
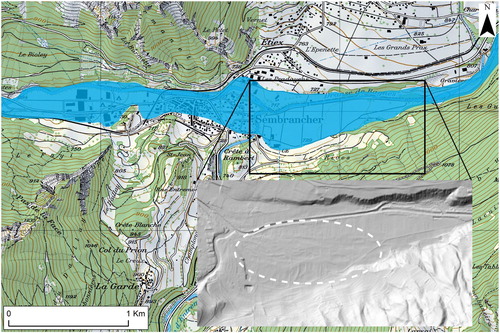
Downstream, the sector of Sembrancher is relatively wide and flat, which caused the flooding of large surfaces. On the agricultural plain located at the East of the village, a micro topography made of elongated mounds separated by shallow channels is particularly well evidenced by the shaded DEM (). This indicates the significant deposition of sediments. Maximal water depth must have been 6 meters here. A systematic inventory of the damages for this village contains the type of sediments deposited on each plot of land (CitationReynard et al., 2019). On both flat sectors up- and downstream the village various grain sizes are reported, from sand to small blocks, with the domination of sand and gravels. The database indicates however that erosion occurred as well on nearly all plots. This probably shows that, after having deposited the sediment load, the flood eroded locally some sectors. Despite the flooding of a large part of the village, almost no houses were destroyed, probably because of lower flow velocities compared to Champsec, for instance, as well as prior deposition of large quantities of sediments on the flat and large sector East of the village.
Figure 8. The flood extent in the Sembrancher sector. The shaded DEM shows well the morphology of the fluvial deposits East of the village (dotted line). Reproduced by permission of swisstopo (BA19054).
Between Sembrancher and Martigny the valley is generally narrow, which favored erosion of the banks (See Main map). Ninety minutes after the outburst, the wave reached the area of Martigny. From historical data, we can estimate that the water raised up to 3 meters in Martigny-Bourg. It is indeed reported that mud filled the houses up to the first floor.
From Martigny-Bourg, CitationBridel (1818) reports that the flood divided then into three branches, one following the current river course, another one flowing through the main road of Martigny-Bourg and the third one following the base of the mountain to the South. However, the distinction of the two latter branches is impossible given the local topography. This shows how careful one must be when using historical data for precise mapping. However, the existence of three distinct branches is probable when looking to the Napoléon map (older than the 1818 event), on which different channels can be observed, but not at the exact position described by CitationBridel (1818).
Geomorphologically, the Martigny area is a large alluvial fan with a very gentle slope and without any micro-topography. The area has been largely urbanized since 1818 and thus no morphological signs of the outburst can be observed. The only information comes thus from historical data. According to CitationBridel (1818) and CitationEscher de la Linth (1818), all the area was covered by a thick layer of silt and huge quantities of wood. They also report that, downstream Martigny, the flood divided again into several branches and reached the Rhone River in different points on a distance of more than 4 km. The hydraulic modeling of the flood by Ancey et al. (Citation2019a, Citation2019b) shows that the water could have even reached the area of Charrat to the North-East. However, in absence of the exact former topography in the plain, the hydraulic model should be used cautiously here. From this, we represented the flood with two blue levels in this sector (See Main map). The dark blue indicates the main branches and the light blue the sectors where the water depth was probably a bit lower. This distinction is however very hypothetical between the city and the Rhone River. Finally, 26 of the 34 casualties occurred in Martigny, despite the water depth was much lower and the velocities slower than in the villages located upstream in the Bagnes valley. This was due to the late activation of the alarm system in Martigny (CitationPayot, 2019; CitationPayot et al., 2018) and to the fact that the escape lane to higher altitudes was longer.
5. Discussion
This study presents one of the first detailed mapping (if not the first) of a glacier outburst flood event, by the combination of historical and geomorphological data. If historical data present sometimes bias or exaggerations, the interpretation of geomorphological signs contains however also some uncertainties. First, without any dating, the attribution of any deposit to the 1818 disaster can be uncertain. Indeed, the sediments could have been deposited by more recent floods. This is possible at a reasonable distance of the river or where the altitude difference with the current river is below few meters. Indeed, no similar outburst flood occurred after 1818, and the flood caused by meteorological events are more than one order of magnitude lower (the current centennial discharge is estimated at 230 m3/s, considering the retention by the hydroelectric infrastructure). Where the deposits are located several meters above the river bed and present old facies (forest, lichens on the block surface, etc.), their attribution to the 1818 disaster is probable, even if they could possibly correspond to the 1595 outburst flood. Second, the morphology of the valley has been shaped all along the Holocene, from the retreat of the glaciers. Deposition and erosion phases by the river have alternated, a story which results in the field in the succession of terraces. The attribution of any terrace to a single event is thus tricky. In addition, an erosion edge caused by the 1818 flood can have evolved then by regressive erosion and thus indicates not necessarily the outline of the flood and the water height. That is why the erosion edges represented on the map do not always follow the flood limits. Third, finding traces of a disaster that occurred 200 years before is not an easy task, particularly in an inhabited valley. Because the economy of the valley was essentially agricultural, the local population rapidly intervened to restore the devastated agricultural lands, by leveling the sediment deposits and removing the blocks where it was possible. Vegetation has also colonized eroded sections or sediment deposits, and new accumulations from the valley slope (rock falls, debris flows) or by recent floods can have partially recovered the traces of the 1818 event. Finally, the calculation of the water depths does not consider any changes in the height of the river bed after 1818, due to variations in the sediment transport by the Drance River after the Little Ice Age (CitationBallantyne, 2002; CitationCosta et al., 2018; CitationLane et al., 2017), and to the building of the Mauvoisin hydroelectric dam in the middle of the twentieth century in the head of the valley. In addition, accounts on the water depth observed during the flood could generally not be used as such because generally too imprecise and, sometimes, exaggerated. For all these reasons, uncertainties naturally exist about the flood outline and the water depths, but error quantification is difficult. For water depths, we can estimate it at less than 1 m in Martigny-Bourg, thanks to precise historical sources (‘the water reached the first floor’), at about 2 m in localities like Sembrancher, Le Châble, Champsec and Bonatchiesse, where different historical and geomorphological sources could be crossed, and at 3 meters in other locations where fewer sources exist and/or no geomorphological traces have subsisted.
In their study on the Giétro event, Ancey et al. (Citation2019a, Citation2019b) made a comparison between their numerical simulation and the map of the flood carried out by CitationCorboz (2015), and concluded that both approaches gave generally similar results, although the simulations showed in most locations wider flood extent. The map of CitationCorboz (2015) was a preliminary work, which was improved in the present study. It gave notably underestimated flood extent in several sectors. The differences between the map proposed here and simulations of Ancey et al. (Citation2019a, Citation2019b) are thus reduced. This indicates the reliability of a manual approach, provided that the observation data – both geomorphological and historical – are sufficient. Regarding the water depths, the values calculated on cross-profiles in the present study and those modeled by Ancey et al. (Citation2019a, Citation2019b) show sensible differences. Whereas the results are similar in the wide sections (Bonatchiesse, Champsec, Sembrancher, Martigny), substantial differences appear in some narrower sectors. Considering the uncertainties inherent to both methods, the global results show however high coherence.
6. Conclusion
This study has presented an innovative method for mapping past flood events by the combining of historical and geomorphological data. It has shown the benefits of crossing human sciences (history) and natural sciences (geomorphology) for the understanding and the reconstruction of old catastrophic events. In the present case, historical data gave generally information on the destruction of buildings or agricultural parcels, and sometimes on the course of the wave, but rarely indicated the outlines of the flood. Besides, such information was generally available only for a few numbers of places, i.e. mainly where the economic activity resided. For the rest of the territory, the only possibility of finding indicators of the flood lied in the fine analysis of the relief and of the landforms. Both types of sources completed thus each other. In some cases, geomorphological and topographical data were used to validate the historical data, whereas in other cases, the outline of the flood could be clarified thanks to historical sources. Finally, to pass from the data collected to a map, the mobilization of cartographic tools was necessary, in particular the use of GIS. Mapping historical natural disasters such as the Giétro outburst flood is thus eminently interdisciplinary.
Risks presented by glacier lakes may increase locally in the future, highlighting the need for mapping past flood events in given valleys. The similarity of results obtained through numerical simulations and manual mapping has shown that using both historical and geomorphological data for outlining a past flood can be an alternative to modeling. The Giétro disaster is one of the world’s most documented glacial lake outburst flood. Reproducing the methodology for other events can thus probably be possible only for rare cases, because of the potential paucity of archive data. However, this study has shown the benefit of a thorough analysis of the local geomorphology for reconstructing past flood events. We can also expect that a better combining of observation data with numerical modeling could improve such reconstructions.
Regarding the Giétro disaster, future works intend to analyze additional geomorphological data registered in damage reports in order to improve knowledge on the hydro-morphologic behavior of the wave at the scale of the villages as it has already been done in Sembrancher (CitationReynard et al., 2019). Sedimentological investigations, including dating, should also be crossed with archeological data on the alluvial fan of the Dranse River in Martigny, not only for a better understanding of the course of the wave (various branches), but also for finding possible traces of older disasters, such as the 1595 outburst flood.
Software
The map was created with the software ArcGIS 10.5. Different base layers were used: historical maps, actual topographic maps, orthophotos and high resolution digital elevation model. Different layers were then created: flood extension, boulder deposits, erosion edges, bridges destroyed, buildings destroyed. The first stage of edition was done in the edition window of ArcGIS. The final edition of the map was carried out with Adobe Illustrator CC 2017.
Supplemental Material
Download PDF (7.4 MB)Acknowledgements
We wish to thank Dr Florie Giacona, Dr Fabio Luino and Mr Nick Scarle for their constructive review of the manuscript and of the map. Thank you also to Hilaire Dumoulin for sharing his knowledge on the spatial extent of the flood and its consecutive destructions, to Prof. Stuart Lane for fruitful discussions on the flood hydraulics, to the CREPA (Centre régional d’étude des populations alpines) for having furnished data on damages in Sembrancher area and to Mélanie Clivaz for helping processing a preliminary version of the map.
Disclosure statement
No potential conflict of interest was reported by the author(s).
References
- Ancey, C. , Bardou, E. , Funk, M. , Huss, M. , Werder, M. , & Trewhela, T. (2019a). Hydraulic reconstruction of the 1818 Giétro glacial lake outburst flood. Water Resources Research , 55(11), 8840–8863. https://doi.org/10.1029/2019WR025274
- Ancey, C. , Bardou, E. , & Trewhela, T. (2019b). Reconstruction hydraulique de la débâcle glaciaire du Giétro, Annales valaisannes, Actes du colloque Giétro 1818 sous la loupe des sciences, p. 89-105.
- Annales valaisannes . (2019). Giétro 1818 sous la loupe des sciences, Martigny, 432 p.
- Baker, V. R. (2002). The study of superfloods. Science , 295 (5564), 2379–2380. 11923514 https://doi.org/10.1126/science.1068448
- Ballantyne, C. K. (2002). Paraglacial geomorphology. Quaternary Science Reviews , 21 (18-19), 1935–2017. https://doi.org/10.1016/S0277-3791(02)00005-7
- Benito, G. , Lang, M. , Barriendos, M. , Llasat, M. C. , Francés, F. , Ouarda, T. , Thorndycraft, V. R. , Enzel, Y. , Bardossy, A. , Coeur, D. , & Bobée, B. (2004). Use of systematic, palaeoflood and historical data for the improvement of flood risk estimation. Review of scientific methods. Natural Hazards , 31 (3), 623–643. https://doi.org/10.1023/B:NHAZ.0000024895.48463.eb
- Björnsson, H. (2010). Understanding jökulhlaups: From tale to theory. Journal of Glaciology , 56 (200), 1002–1010. https://doi.org/10.3189/002214311796406086
- Brázdil, R. , Kundzewicz, Z. W. , & Benito, G. (2006). Historical hydrology for studying flood risk in Europe. Hydrological Sciences Journal , 51 (5), 739–764. https://doi.org/10.1623/hysj.51.5.739
- Bridel, P.-S. (1818). Seconde course à la vallée de Bagnes, et détails sur les ravages occasionnés par l'écoulement du lac de Mauvoisin, 21 juin 1818, Vevey: Loertscher, 1818, 30 p.
- Brönnimann, S. , & Krämer, D. (2016). Tambora and the “Year Without a Summer” of 1816. A perspective on Earth and human systems science. Geographica Bernensia G90 , 48 pp. https://doi.org/10.4480/GB2016.G90.01
- Carrivick, J. L. , & Quincey, D. J. (2014). Progressive increase in number and volume of ice-marginal lakes on the western margin of the Greenland Ice Sheet. Global and Planetary Change , 116 , 156–163. https://doi.org/10.1016/j.gloplacha.2014.02.009
- Carrivick, J. , & Tweed, F. (2016). A global assessment of the societal impacts of glacier outburst floods. Global and Planetary Change , 144 , 1–16. https://doi.org/10.1016/j.gloplacha.2016.07.001
- Cenderelli, D. A. , & Wohl, E. E. (2003). Flow hydraulics and geomorphic effects of glacial-lake outburst floods in the Mount Everest region, Nepal. Earth Surface Processes and Landforms , 28 (4), 385–407. https://doi.org/10.1002/esp.448
- Clague, J. , & O'Connor, J. E. (2015). Glacier-related outburst floods. In W. Haeberli , C. D. Whiteman , & J. Schroder (Eds.), Snow and ice-related hazards, risks and disasters (pp. 487–523). Elsevier.
- Corboz, P. (2015). Reconstitution géohistorique de la débâcle du glacier du Giétro le 16 juin 1818, Mémoire de Master en géographie, Université de Lausanne.
- Costa, A. , Molnar, P. , Stutenbecker, S. , Bakker, M. , Silva, T. A. A. , Schlunegger, F. , Lane, S. N. , Loizeau, J.-L. , & Girardclos, S. (2018). Temperature signal in fine sediment export from an Alpine catchment. Hydrology and Earth System Sciences , 22 (1), 509–528. https://doi.org/10.5194/hess-22-509-2018
- Costa, J. E. (1983). Paleohydraulic reconstruction of flash-flood peaks from boulder deposits in the Colorado Front Range. Geological Society of America Bulletin , 94 (8), 986–1004. https://doi.org/10.1130/0016-7606(1983)94<986:PROFPF>2.0.CO;2
- D’Arcy Wood, G. (2015). Tambora, the eruption that changed the world . Princeton University Press. 312 p.
- Escher de la Linth, H. C. (1818). Notice sur le val de Bagnes en Bas-Valais et la catastrophe qui en a dévasté le fond, en juin 1818. Genève: J.-J. Paschoud. 24 p.
- Funk, M. , Werder, M. , & Huss, M. (2019). Modélisation de l’amorce de vidange et de débâcle du lac glaciaire de Mauvoisin, Annales valaisannes, Actes du colloque Giétro 1818 sous la loupe des sciences, p. 77-87.
- Gard, J.-M. (1988). 16 Juin 1818. Débâcle du Giétro. Collection du Musée de Bagnes n°1 . Pillet.
- Giacona, F. , Eckert, N. , & Martin, B. (2017). A 240-year history of avalanche risk in the Vosges Mountains based on non-conventional (re)sources. Natural Hazards and Earth System Sciences , 17 (6), 887–904. https://doi.org/10.5194/nhess-17-887-2017
- Haeberli, W. (1983). Frequency and characteristics of glacier floods in the Swiss Alps. Annals of Glaciology , 4 , 85–90. https://doi.org/10.3189/S0260305500005280
- Harrison, S. , Kargel, J. S. , Huggel, C. , Reynolds, J. , Shugar, D. H. , Betts, R. A. , Emmer, A. , Glasser, N. , Haritashya, U. K. , Klimeš, J. , Reinhardt, L. , Schaub, Y. , Wiltshire, A. , Regmi, D. , & Vilímek, V. (2018). Climate change and the global pattern of moraine-dammed glacial lake outburst floods. The Cryosphere , 12 (4), 1195–1209. https://doi.org/10.5194/tc-12-1195-2018
- Himmelsbach, I. , Glaser, R. , Schoenbein, J. , Riemann, D. , & Martin, B. (2015). Reconstruction of flood events based on documentary data and transnational flood risk analysis of the Upper Rhine and its French and German tributaries since AD 1480. Hydrology and Earth System Sciences , 19 (10), 4149–4164. https://doi.org/10.5194/hess-19-4149-2015
- Hugon-Duc, M. (2018). Giétro 1818. Une histoire vraie. Fribourg / Le Châble: Ed. Faim de siècle / Musée de Bagnes, 192 p.
- Jones, A. F. , Macklin, M. G. , & Lewin, J. (2010). Flood series data for the later Holocene: Available approaches, potential and limitations from UK alluvial sediments. The Holocene , 20 (7), 1123–1135. https://doi.org/10.1177/0959683610369501
- Kershaw, J. A. , Clague, J. J. , & Evans, S. G. (2005). Geomorphic and sedimentological signature of a two-phase outburst flood from moraine-dammed Queen Bess Lake, British Columbia, Canada. Earth Surface Processes and Landforms , 30 (1), 1–25. https://doi.org/10.1002/esp.1122
- Lane, S. N. , Bakker, M. , Gabbud, C. , Micheletti, N. , & Saugy, J.-N. (2017). Sediment export, transient landscape response and catchment-scale connectivity following rapid climate warming and Alpine glacier recession. Geomorphology , 277 , 210–227. 10.1016/j.geomorph.2016.02.015
- Macklin, M. G. , Rumsby, B. T. , & Newson, M. D. (1992). Historic overbank floods and vertical accretion of fine-grained alluvium in the lower Tyne valley, north East England. In P. Billi , R. Hey , P. Tacconi , & C. Thorne (Eds.), Dynamics of gravel-bed rivers (pp. 564–580). Wiley.
- Payot, C. (2019). Les alarmes, Annales valaisannes, Actes du colloque Giétro 1818 sous la loupe des sciences, p. 137-147.
- Payot, C. , Meilland, A. , & Mariethoz, A.-S. (2018). Giétro 1818. La véritable histoire, Fribourg / Le Châble: Ed. Faim de siècle / Musée de Bagnes, 272 p.
- Reynard, E. (2009). Les sources cartographiques pour l’histoire du Rhône valaisan. In E. Reynard , M. Evéquoz-Dayen , & P. Dubuis (Eds.), Le Rhône: dynamique, histoire et sociétés (vol. 21, p. 63–71). Archives de l’Etat du Valais, Les Cahiers de Vallesia.
- Reynard, E. , Clivaz, M. , Corboz, P. , Decporzant, Y. , Deslarzes, B. , Fellay, J.-C. , Hugon-Duc, M. , Lambiel, C. , Meilland, A. , & Payot, C. (2019). Croiser les sources environnementales, historiques et sociologiques pour reconstituer les catastrophes naturelles. Le cas de la débâcle du Giétro du 16 juin 1818. Physio-Géo , 14 , 307–326. https://doi.org/10.4000/physio-geo.9504
- Roberts, M. J. (2005). Jökulhlaups: A reassessment of floodwater flow through glaciers. Reviews of Geophysics , 43 (1), https://doi.org/10.1029/2003RG000147
- Rudoy, A. N. (2002). Glacier-dammed lakes and geological work of glacial superfloods in the Late Pleistocene, Southern Siberia, Altai Mountains. Quaternary International , 87 (1), 119–140. https://doi.org/10.1016/S1040-6182(01)00066-0
- Turzewski, M. D. , Huntington, K. W. , & LeVeque, R. J. (2019). The geomorphic impact of outburst floods: Integrating observations and numerical simulations of the 2000 Yigong flood, eastern Himalaya. Journal of Geophysical Research: Earth Surface , 124 (5), 1056–1079. https://doi.org/10.1029/2018JF004778
- Vincent, C. , Garambois, S. , Thibert, E. , Lefebvre, E. , Le Meur, E. , & Six, D. (2010). Origin of the outburst flood from Glacier de Tête Rousse in 1892 (Mont Blanc area, France). Journal of Glaciology , 56 (198), 688–698. https://doi.org/10.3189/002214310793146188
- Wilhelm, B. , Ballesteros Cánovas , J.A., Macdonald, N. , Toonen, W.H. , Baker, V. , Barriendos, M. , Benito, G. , Brauer, A. , Corella, J.P. , Denniston, R. , Glaser, R. , Ionita, M. , Kahle, M. , Liu, T. , Luetscher, M. , Macklin, M. , Mudelsee, M. , Munoz, S. , Schulte, L. , … George , Stoffel, Wetter . (2019). Interpreting historical, botanical, and geological evidence to aid preparations for future floods. Wiley Interdisciplinary Reviews: Water , 6 (1), e1318. https://doi.org/10.1002/wat2.1318
- Winiwarter, V. , Schmid, M. , & Dressel, G. (2013). Looking at half a millennium of co-existence: The Danube in Vienna as a socio-natural site. Water History , 5 (2), 101–119. https://doi.org/10.1007/s12685-013-0079-x