
ABSTRACT
Mount St. Helens is a stratovolcano of the Cascadia volcanic arc well known worldwide for its volcanic collapse and eruption in 1980, which caused considerable destruction and changed the geomorphology of the volcano and of a considerable portion of its surroundings. This paper presents a geomorphology and surface-geology map of both the wider Mount St. Helens, Washington (USA), at the 1:50,000 scale, and of its crater, at the 1:25,000 scale. The map is obtained from the interpretation of two high-resolution, air-borne acquired, digital terrain models, LiDAR dataset, combined with Google Earth imaging, geological information and field surveys. The geomorphology of the area is largely dominated by landforms connected with the blast of 1980 and the dome extrusion of 2004, which also affected the shape of the main glacier in the crater.
1. Introduction
Geomorphological maps of volcanic areas are relatively rare (CitationAlcalá-Reygosa et al., 2016; CitationThouret, 1999; CitationVentura et al., 2005) and often focus on a limited number of geomorphological characteristics. Comprehensive maps that include non-volcanic (e.g. landslides, debris flow, scarps, fluvial valley) and typical volcanic morphologies (e.g. domes, craters, lava flows) are uncommon and are available for few volcanoes (CitationAlcalá-Reygosa et al., 2016; CitationAzzoni et al., 2017; CitationDi Traglia et al., 2013; CitationThouret, 1999; CitationTripodo et al., 2012; CitationVentura et al., 2005). Understanding the present-day morphology of a volcano by adding information about surface features and geomorphology gives a major support for land management studies, in particular for hazard-risk analysis in highly populated areas (e.g. Ampato volcanic complex) (CitationAlcalá-Reygosa et al., 2016). Moreover, the geomorphological characterisation of volcanoes can broaden our understanding of the stages of volcanic activity and evolution. In addition, it allows us to analyse the effects of eruptions on the surrounding areas.
Seismic studies have found that the topography, the rock type and the geomorphology can act as a filter in geophysical imaging, specifically in the ability of tomographic techniques to image deep magmatic and tectonic systems in volcanoes (CitationDe Siena et al., 2016; CitationGabrielli et al., 2020). Therefore, a better description of the shapes and surficial geology of Mount St. Helens volcano could be of great assistance to further studies of the deeper structure of this volcano, which is relevant to understand its dynamics and potentially useful to predict future activities.
Here, we present a new map of Mount St. Helens that includes all geomorphological and surface geology elements. The map covers an area of 236 km2. Mount St. Helens is a site of great interest because of its repeated eruptions (1980, 2004), which rapidly changed the morphology of the summit area. Its complex geomorphology combines volcanic, fluvial, hillslope, glacial and periglacial landforms. This makes its mapping an ideal example for many other volcanic regions worldwide.
2. Study Site
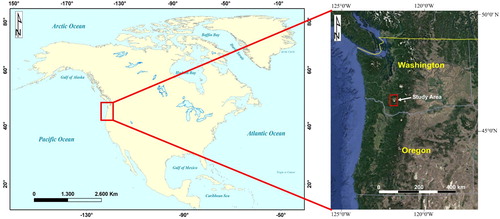
Stratovolcanoes are volcanoes where explosive and effusive activities alternate. They are characterised by a typical conical shape made of layers of lava and pyroclastics. They are typical of subduction zones and are located near many densely inhabited regions. Mount St. Helens is a stratovolcano of the Cascadian Arc, and one of the most active of the USA (). Mount St. Helens is best known for its destructive 1980 eruption, one of the first to be recorded and studied by dedicated monitoring arrays. This eruption generated a debris avalanche, the widest ever produced by a volcano in modern history onshore (CitationGlicken, 1996; CitationLipman & Mullineaux, 1981).
Figure 1. a) North America and b) Cascadian arc and Mount St. Helens position (red square).
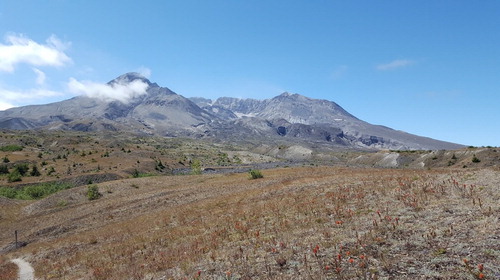
The present morphology of Mount St. Helens, especially on the northern flank of the volcano, is mainly related to the destructive eruption of the 18 May 1980 (). The first evidence that the volcano was reawakening, after 123 years of inactivity, was a magnitude 4.2 earthquake of the 21 March 1980, followed by small eruptions of ashes and harmonic tremor, indicative of a magma ascent beneath the volcano (CitationCashman & Hoblitt, 2004). In April, the seismic activity decreased, but a dome started to grow on the north flank of the volcano with an elevation increase of 1.5–2.5 m a day, reaching a diameter of 2 km and a maximum height of 150 m. On May 18 1980, a magnitude 5 earthquake triggered the collapse of this sector of the volcano (13% of cone's volume), unleashing a violent explosive outburst, which deposits consist of juvenile material from the margin and the interior of the dome, and a subsequent Plinian eruption (CitationLipman & Mullineaux, 1981)
Figure 2. The Northern flank of the Mount St. Helens volcano, in a picture taken from 46°14′N/122°10′W, pointing SW direction. We can notice the open side of the crater (due to the 1980 eruption's collapse) and the newly formed dome inside it.
Three key aspects connected to this event radically changed the pre-1980 morphology of Mount St. Helens: the debris avalanche (2.9 km3 in volume) from the northern flank, triggered by the magnitude 5 earthquake; mudflows occurring predominantly along the southern flank; and a new lava dome construction in the caldera. The blast also changed the overall morphology of the volcano, with its summit reduced by ∼500 m height and its volume diminished by one-third (CitationShea & van Wyk de Vries, 2010). The explosion deposited a layer of ash as far as 1500 km from Mount St. Helens, and as thick as 20 cm up to 10 km from the volcano.
The debris avalanche was the largest product of this eruption: a mix of rocks, soil and glacier ice, partially melted. It swept down the northern flanks of the volcano, 10–20 s after the magnitude 5 earthquake, climbing more than a hundred metres over the topographic obstacle of the nearby Johnston Ridge. The total volume of the debris avalanche was between 2.5 and 3 km3, outspreading for 25 km from the volcano (CitationLipman & Mullineaux, 1981) and having an average thickness of 46 m.
Just after the eruption, mudflows occurred along the southern flank of the volcano within the headwaters of the South Fork Toutle, Lewis and Kalama river valleys (CitationLipman & Mullineaux, 1981), most likely triggered by the sudden melting of snow and ice that typically covered the volcano summit. However, the largest mudflow event took place hours after the eruption, from the debris avalanche hummocky deposits in the North Fork Toutle River valley. This mudflow spreads for more than 120 km and originated from the water-saturated parts of the debris avalanche.
Episodic eruptions between 1980 and 1986 were followed by minor explosive activities and, sometimes lahars, and led to the build-up of a new composite lava dome inside the crater. The dome was characterised by a southeastern lobe of about 200 m in diameter and 90 m height, and a northwestern lobe of about 75 m in diameter and 40 m high, with a total volume of about 5×10⁶ m3 (CitationLipman & Mullineaux, 1981).
Besides the 1980s events, two further events are worth mentioning in relation to the geomorphology of Mount St. Helens. Between 1989 and 1991, six small hydrothermal or phreatic eruptions occurred but they did not considerably change the morphology. The ashes’ composition (pulverised and recycled pieces of the existing dacite dome) suggests that the explosions did not involve magma reaching the surface and were the result of superheated groundwater that broke the rocks. After 18 years of relative quiescence, Mount St. Helens began a new phase of eruptions in 2004, when plumes of steam and volcanic ashes followed an earthquake swarm (CitationSherrod et al., 2008). A lava spine grew upward on the existing dome in the crater area, followed by several smaller spines and a whaleback-shaped extrusion. This new lava dome reached a diameter of 520 m and an elevation 610 m above the Crater Glacier. It caused the splitting of the glacier that had grown in the crater after 1980 (CitationWalder et al., 2008). From 1 Oct – 5 Oct, 2004, five phreatic eruptions occurred, three of them producing fine-ash fallout downwind, and at least one ballistic block (CitationDzurisin et al., 2005). The following years (2005–2008) saw extrusions of semi-solid lava and sporadic steam explosions.
3. Data, software and methods
A LiDAR dataset with 3 m resolution acquired in 2003 has been used in ArcGIS 10.6 to map all recognisable surficial geology and geomorphological features around Mount St. Helens. Due to the complexity of the surface, several hillshade options and illumination have been used to improve the mapping. A second LiDAR dataset (1 m resolution), collected by Watershed Sciences, Inc. in 2009, added information about the eruptions of 2004–2008 (CitationMosbrucker, 2014). The two LiDAR maps were obtained before and after the last eruption, respectively, thus they have been compared to highlight the evolution of the landforms in the crater.
The 1:50.000 map (see Main Map) is based on the 2003 LiDAR dataset: despite being less recent, it covers an area of 250 km2 around Mount St. Helens, while the 2009 dataset focuses only on the northern sector. Moreover, no considerable morphological differences were noticed between the two surveys, apart from the crater, interested by the last eruption in 2004–2008.
The first step was to identify and map the landforms combining the interpretation of LiDAR data and Google Earth imagery. Google Earth has been fundamental to better define some morphologies such as the glacier and the explosion pits on the Pumice Plain. Landsat/Copernicus Images with 30 cm resolution from July 2003 were analysed, being more useful for the crater area, along with a more recent one (July 2017), to study those areas (e.g. hummocky deposits) untouched by the last eruptions.
The landforms have been divided on the Main Map into endogenic (volcanic landforms) and exogenic (fluvial, gravitational, glacial and landforms) (CitationGustavsson et al., 2006). The volcanic landforms were further divided into pre- and post-eruption of 1980. The pyroclastic flow was digitalised starting from the geodatabase of CitationFurze et al., 2017, available on the National Geologic Map Database of the USGS.
Sections of the map were ground-truthed in the field for two weeks. In order to analyse some features of the pumice plain area (secondary explosion pits), a GPR campaign was also carried out. A Gekko-80 Antennas (unshielded) with centre frequency of 80 MHz was used. Even if these antennas reach a penetration depth > 40 m, our results are focused in the first 10 m: the high porosity of the area (φ=0.71) can lead to saturated pyroclastic deposits (Gase et al., Citation2017) and so affect the resolution of the survey. In the postprocessing, migration, dewow and background removal filtering have been applied.
The final step was the creation of the map using ArcGIS 10.6 software.
4. Landform description
The presented surface geology and geomorphology map has been divided into endogenic volcanic and exogenic landforms (glacial and fluvial) and their subcategories. This distinction is necessary to highlight the importance of the complex volcanic features in the overall morphology of the area.
4.1. Volcanic landforms
Within the main volcanic structure of Mount St. Helens, the most evident volcano landforms that we can recognise, besides the crater, are domes and volcanic products related to two different ages of activity, during the Miocene and the Oligocene, and lava flows (prior to the 1980′s eruption). In the map, no geological distinction has been made among them, apart from separating them into different geomorphological features, where appropriate: i.e. pressure ridges and levee channels.
The ridges appear on the andesite flow of the Worm Complex of the Middle Kalama eruptive period (C.E. 1510–1570) (CitationClynne et al., 2008). Pressure ridges are usually accompanied by levee channels and are a typical morphology of andesitic lava flows, characteristic of many other volcanoes (e.g. Llullaillaco or Lascar volcanoes). The ridges and their levees can be seen on the southern flank of Mount St. Helens. The origin of this morphology is mainly due to the viscosity of the andesitic lava, which corrugates as it creeps/flows over steep slopes. The longest levee channel is 2 km long and the largest pressure ridge is ∼ 400 m wide.
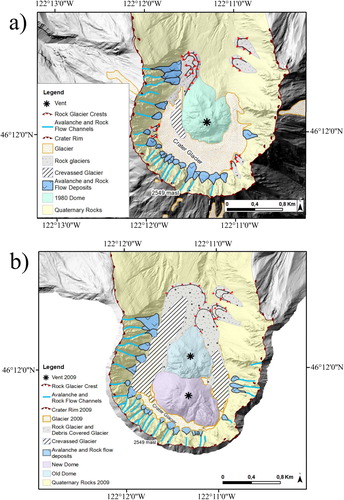
The dome inside the crater evolved through two stages. The first stage is related to the 1980′s eruption and the second one to the 2004–2005 activities. The latter stage resulted in the formation of a new dome (diameter ∼1 km and height ∼50 m), which grew over the previous one and split the Crater Glacier into two lobes. A small-scale dedicated map of the crater region, which shows the latest dome and its effect on the surrounding morphology, is shown in .
Figure 3. Evolution of the Mount St. Helens crater through the comparison of 2003 LiDAR (a) and 2009 (b). 2009 LiDAR information: Projected Coordinate System UTM Zone 10N; Map Datum NAD 1983.
Outside the crater area, we can identify in the Main Map three main domes related to pre-1980, dacite, intrusive episodes: Sugar Bowl dome (C.E. 850–900), and Butte Camp and Goat Mountain domes, both of the Ape Canyon Stage (300–35 ka). While Sugar Bowl dome is at the opening on the northern flank of the crater, and Butte Camp is lying on the western flank of the volcano, Goat Mountain dome is 7 km away from the crater, at the edge of the left bottom corner of our map. Goat Mountain dome is by far the highest and largest among them, with an area of 4.5 km2 and a height of 700 m, while Sugar Bowl is ∼200 m high and has an area of 0.7 km2. Butte Camp has an area of 1.2 km2 and an elevation of ∼300 m.
4.2. Landforms connected with the 1980′s volcanic collapse
The lateral collapse that affected the northern flank of Mount St. Helens removed a 0.11-km3 cryptodome on the volcano and its crater. Therefore, the original (pre-1980) near-symmetrical crater evolved into a horseshoe shape. This is the typical morphological signature of volcanic directed blasts, as we can see also at the Bezymianny volcano (Kamchatka) (CitationGorshkov, 1959).
Between the base of Mount St. Helens northern flank and Spirit Lake, in what was the North Fork Toutle River valley, we find the Pumice Plain. This plain consists mainly of debris avalanche deposits, and pyroclastic flow, ash-cloud and surge units overlying them. Pyroclastic-flow deposits can be identified with lobes and tongues in fanlike patterns, extending for 8 km from the volcanic crater, covering an area of 16 km2 (CitationBrantley and Myers, 2000; CitationKuntz et al., 1990) and consisting of poorly sorted ashes, clasts of pumice and dacite lithic.
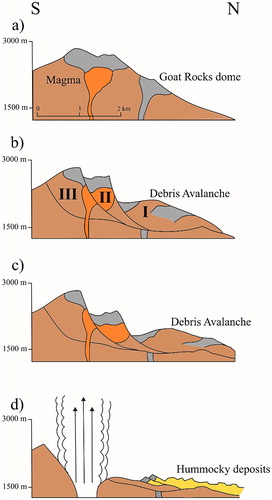
Hummocks are small hills and depressions with a circular, rectangular or elliptical basal shape, and are a characteristic structure of debris avalanche deposits in volcanic environments (CitationFavalli et al., 2005; CitationPaguican et al., 2014; CitationSiebert, 1984). At Mount St. Helens, hummocks extend for 60 km2 along the North Fork Toutle River valley and west of the Pumice Plain, reaching a maximum length of 600 m, an height between 10 and 73 m, and a width spanning from a few metres to 400 m (CitationGlicken, 1996). The hummocks have a conical, domical or, most frequently, irregular shape (CitationLipman & Mullineaux, 1981). These are extensional features originated by a spreading of the avalanche body (Citationvan Wyk de Vries & Davies, 2015). Once the avalanche starts to diffuse, extension takes place along normal listric faults. In the Mount St. Helens case, the extension was helped by the ductile layer that is found at the base of the deposit, composed of low-strength and altered materials that had been mobilised by the 1980 event (CitationAndrade & van Wyk de Vries, 2010). The new blocks formed by the extension are then split apart, forming horst and graben structures, through normal, strike-slip faults. These accommodate sliding, tilting and rotation of the blocks, thus originating the hummocks (CitationPaguican et al., 2014) (). Hummocky dimensions are generally larger next to the source and smaller far from it. The water that naturally accumulates in the inter-hummocks depressions (graben) can be channelised and give rise to secondary lahars (Citationvan Wyk de Vries & Davies, 2015). The most extensive and destructive lahar of the 1980 eruption originated from these water-saturated areas of the hummocky terrain, and not from the volcano itself. Smaller volcanic lahars did however form in other Mount St. Helens valleys.
Figure 4. NS Cross-section of the eruption of 1980′s and subsequent formation of hummocky structures (based on CitationLipman and Mullineaux (1981) and Citationvan Wyk de Vries and Davies (2015)): a) Pre-collapse profile; b) First30 seconds of the collapse, with an initial spreading (I, II and III indicate the blocks movement sequence); c) Third stage, with the advancement of the debris avalanche; d) Final stage (30 s after b and c stages), with the blast and hummocks formations due to the avalanche spreading in horst and graben structures.
Interesting features among the morphologies of Mount St. Helens are the secondary explosion pits on the Pumice Plain, along the North Fork Toutle River valley and the south shore of Spirit Lake (). This kind of feature can be found in other volcanic areas, generally in the fluvial, lacustrine and littoral environment, like those connected to the Ohakuri pyroclastic flow (New Zealand) (CitationGravley, 2004; CitationManville et al., 2002), or the pits found in the Valley of Ten Thousands Smokes (Alaska) (CitationSmith & McKibbin, 1997). They are formed by hot pyroclastic products that, after the eruption of 1980, incorporated water from the pre-existing drainage or ice, turned into steam, and produce several hydroeruptions that occurred days and months after the original main eruption. In most cases, secondary explosion pits present a circular shape, the size of which is proportional to the magnitude of the event: the higher the eruption magnitude, the larger the craters. The craters range in diameter between 5 and 100 m. The larger one can also be associated with post-eruption slumping, which enhanced their width but reduced their flank slope (CitationMoyer & Swanson, 1987). Of the original ∼30 pits on the pumice plain reported by CitationGravley (2004), only seven are visible on the LiDAR data (and five on Google Earth imagery). All others were buried below later lahar or fluvial deposits or eroded by the evolving drainage system.
Figure 5. a) Secondary explosion pits from the LiDAR of 2003 and Google Earth image of 2016, located at 46°15′N/122°12′W. The red line corresponds to the GPR survey of this paper. B) The same secondary explosion pit shown from the ground. The GPR profile of was taken along the rim of this pit in summer 2018.
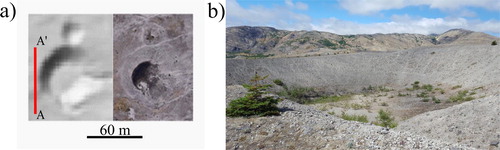
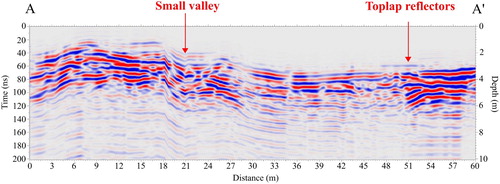
In , the result of the GPR profile is shown. This line has been taken on the western side of the pits of (red line). At about 18 m from the beginning of the profile, data show the presence of a small valley (5 m long and 2 m deep), probably still connected to the terminal tip of the pit itself. At 50 m, we can see toplap reflectors at a depth of 4 m, probably due to the influence of a small explosion pit above the one under study ().
Figure 6. GPR profile of the pit in (A–A’). Red arrows indicate the main interpreted landforms.
4.3. Glacial landforms
The top of Mount St. Helens is characterised by the presence of the Crater Glacier (also known as Amphitheatre and Tulutson Glacier) (CitationSchilling et al., 2004). The pre-1980 glacier was destroyed by the blast but, after that, a new one grew into its present day, horseshoe shape feature that surrounds the 1980–86 and 2004–2005 domes. Smaller, steep glaciers are also present around the crater rim; some of these have been beheaded by the 1980′s eruption (e.g. Toutle and Ape glacier) (CitationSchilling et al., 2004), while others have retreated or disappeared since.
Between the 1980′s and late 2001 eruptions, the Crater Glacier grew by 1.2×10⁸ m3, and increased in thickness by 200 m. The large amount of rock-debris from rock avalanches, detached from the steep walls of the Mount St. Helens crater, are thought to make up one third of the glacier volume (CitationSchilling et al., 2004). Sediments cover almost the entire surface of Crater Glacier, where large crevasses have been identified and mapped. The debris-laden nature of Crater Glacier and the fact that the area generally experiences a high geothermal flux, makes its mass balance largely insensitive to climate forcing. The morphology of the terminal portion of the Crater Glacier is so debris-rich and so corrugated that it is now considered a rock glacier (CitationGutro & Puckett, 2004). Twenty avalanche and rock-flow deposit fans and seven rock glaciers, either overlapping or feeding Crater Glacier, have been recognised and mapped. These fans are 60–180 m wide and 70–450 m long. The longest rock glacier is the one located at the tip of Crater Glacier, reaching a length of almost 1 km and up to 300 m wide.
4.3.1. Comparison between 2003 and 2009 LiDAR dataset
During the last eruption of 2004, Crater Glacier was split by the growth of a new dome and pressed by it against the crater wall (CitationWalder et al., 2008), as shown by the zoom in on the 2009 LiDAR data (b). The present-day crevasse area is clearly larger than in 2003, as can be seen from the comparison in , as is the lowermost rock glacier. The avalanche and rock flow deposit fans have increased in number (to 24), while all bar one rock glaciers in the southern portion of the crater have disappeared. All the post 2004 changes are likely to be due to the growth of the new dome. The glacier has advanced in recent years, due to the accumulation exceeding ablation (CitationWalder et al., 2010). However, the dome emplacement of 2004 stopped this process and brought the eastern and western lobes to join downvalley of the position of the 1980 dome, and to assume an appearance of debris covered glacier, probably developing into a rock glacier (CitationWalder et al., 2008, Citation2010).
4.4. Fluvial landforms
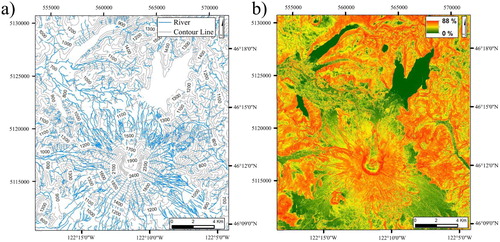
Several seasonal (related to snow and glacier melt) and permanent streams are present around Mount St. Helens, forming the typically radial pattern common to many volcanoes (CitationTwidale, 2004). Further downvalley, the drainage system evolves into larger rivers, such as the North Fork Toutle River and the South Fork Toutle River. The 1980′s debris avalanche deeply changed the settings of the first one, which evolved in a nonlinear and nonsequential pattern, with phases of degradation-aggradation and widening-narrowing of the channel (CitationMajor et al., 2019) During the past 30 years, some of these changes have created deep and steep valleys in the erodible plain and left a system of fluvial terraces (the main ones are reported in the map). The drainage density of the Mount St. Helens system, reported in a, is very high in this valley, in particular on the Pumice Plain and on the debris avalanche deposit, where the material is more erodible. Here, deep (∼20 m) gullies and steep (up to 88%) fluvial escarpments are common (b).
Figure 7. a) Drainage system of Mount St. Helens; b) Slope map of Mount St. Helens.
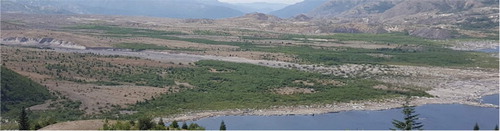
Some of the preferred drainage directions followed by streams and rivers are likely connected to the geology of the area and structural elements (e.g. faults). For example, the W-E direction of the South Fork Toutle River and its deep canyon, which existed already before the 1980′s eruption, probably follows a buried fault with the same orientation, the continuation of which can be seen in the geological map of a nearby sector (CitationEvarts & Ashley, 1990). The largest (1800m length and 800 width) alluvial fan is highly vegetated, extending up to one of the peat bogs of the area, and could not be identified on satellite or aerial photo imagery, but has been recognised on the LiDAR. The fans that flow into Spirit Lake are easy to recognise both on LiDAR dataset and Google Earth (), showing some overlapping between each other.
Figure 8. Alluvial fan with a NE direction, flowing into Spirit Lake, pointing East direction.
5. Conclusions
Describing the geomorphology of a volcano is fundamental to understand its evolution and how eruptions influenced landscape changes. It is also an important information for risk assessment and multidisciplinary aims (e.g. geophysical imaging). Here, we present the 1:50,000 geomorphology and surface geology map of Mount St. Helens volcano. The map, obtained from a LiDAR dataset of 2003, represents an excellent example of how the surface can be influenced and highly modified by volcanic processes in short time. We also present a more recent 1:25,000 map based on a LiDAR data acquired in 2009, after the last eruption of 2004–2008. This second map focuses solely on the crater, which is the only region that experienced significant geomorphological modification since 2003. The map highlighted how much a volcanic system is unstable and continuously changing.
Overall, we mapped 236 km2 of the volcanic area, of which 67% are volcanic landforms, 20% landforms associated with the collapse of 1980, 12.5% are fluvial and gravitational landforms and the remaining 0.5% are related to the glacial landforms. Some volcanic landforms (in particular the Mio-Oligocene products and lava flows) were already present before the 1980s. Among the landforms caused by the 1980 eruption, we identified typical morphologies due to a volcanic collapse, such as the debris avalanche, hummocky deposits and secondary explosion pits, all extending on the north flank of Mount St. Helens. During this eruption, the main volcanic products were a pyroclastic flow, which also affected the Mount St. Helens northern sector, and the growth of a new dome in the crater.
Although limited in size, the evolution of glacial landforms in relation to the volcanic activities are noteworthy: Crater Glacier settled back after the 1980 eruption and persisted even after the last dome extrusion in the crater of 2004–2008, as highlighted in . The comparison between the two maps also shows that a portion of the glacier has recently evolved into a rock glacier, mainly involving the large amount of volcanoclastic deposits related to the last eruption.
The comparison of the two maps focused on the crater shows the instability and dynamicity of the volcanic environment dynamics and as well offers benchmark data to evaluate how both large- and small-scale eruptive and seismic events could significantly affect the surrounding landscape.
Software
Esri ArcMap 10.6 software was used to geo-reference, digitise, visualise, and map the LiDAR datasets. Google Earth Pro was used to improve landforms interpretation. The map was exported from ArcMap 10.6 to pdf format. GPRSoft was used to process and interpret the GPR data.
Open Materials

This article has earned the Center for Open Science badge for Open Materials. The materials are openly accessible at https://dx.doi.org/10.3133/ds904.
Geomorphology and surficial geology map of Mount St. Helens volcano (USA). The legend has been divided in endogenic volcanic and exogenic (fluvial, glacial and periglacial) landforms. Volcanic landforms have been subdivided in pre and post 1980 eruption.
Download PDF (9.2 MB)Acknowledgments
This work has been supported by SAGES (Scottish Alliance for Geosciences Environment and Society) Small Grants Scheme and the Jack Kleinman Grant for Volcano Research to travel to the US and perform fieldwork necessary for the realisation and interpretation of the map. Thanks to the Associate Editor, Prof. Knight and the reviewers Dr. Heike Apps, Mr. Adolfo Quesada and Dr. Guido Ventura for their constructive comments and suggestions. Thanks to Alexa Van Eaton, J. J. Major and R. Waitt for their suggestions and Corrado Palucci for fieldwork assistance.
Disclosure statement
No potential conflict of interest was reported by the author(s).
Additional information
Funding
References
- Alcalá-Reygosa, J. , Palacios, D. , & Zamorano Orozco, J. J. (2016). Geomorphology of the Ampato volcanic complex (Southern Peru). Journal of Maps , 12 (5), 1160–1169. https://doi.org/10.1080/17445647.2016.1142479
- Andrade, S. D. , & van Wyk de Vries, B. (2010). Structural analysis of the early stages of catastrophic stratovolcano flank-collapse using analogue models, 771–789. https://doi.org/10.1007/s00445-010-0363-x
- Azzoni, R. S. , Zerboni, A. , Pelfini, M. , Garzonio, C. A. , Cioni, R. , Meraldi, E. , Smiraglia C. , & Diolaiuti, G. A. (2017). Geomorphology of Mount Ararat/Ağri Daği (Ağri Daği Milli Parki, Eastern Anatolia, Turkey). Journal of Maps , 13 (2), 182–190. https://doi.org/10.1080/17445647.2017.1279084
- Brantley and Myers . (2000). Mount St . Helens — From the 1980 Eruption to 2000. USGS Fact Sheet, (March), 070–97.
- Cashman, K. V. , & Hoblitt, R. P. (2004). Magmatic precursors to the 18 May 1980 eruption of Mount St. Helens, USA. Geology , 32 (2), 141–144. https://doi.org/10.1130/G20078.1
- Clynne, M. A. , Calvert, A. T. , Wolfe, E. W. , Evarts, R. C. , Fleck, R. J. , & Lanphere, M. A. (2008). The Pleistocene eruptive history of Mount St . Helens, Washington, from 300, 000 to 12, 800 years before present. A Volcano Rekindled: The Renewed Eruption of Mount St. Helens , 2004–2006 , 2004–2006. https://doi.org/10.3133/pp1750
- De Siena, L. , Calvet, M. , Watson, K. J. , Jonkers, A. R. T. , & Thomas, C. (2016). Seismic scattering and absorption mapping of debris flows, feeding paths, and tectonic units at Mount St. Helens volcano. Earth and Planetary Science Letters , 442 , 21–31. https://doi.org/10.1016/j.epsl.2016.02.026
- Di Traglia, F. , Pistolesi, M. , Rosi, M. , Bonadonna, C. , Fusillo, R. , & Roverato, M. (2013). Geomorphology growth and erosion: The volcanic geology and morphological evolution of La Fossa (Island of Vulcano, southern Italy) in the last 1000 years. Geomorphology , 194 , 94–107. https://doi.org/10.1016/j.geomorph.2013.04.018
- Dzurisin, D. , Vallance, J. W. , Gerlach, T. M. , Moran, S. C. , & Malone, S. D. (2005). Mount St. Helens Reawakens. Eos, Transactions American Geophysical Union , 86 (3), 25–36. https://doi.org/10.1029/2005EO030001
- Evarts, R. C. , & Ashley, R. P. (1990). Preliminary geologic map of the Goat Mountain quadrangle, Cowlitz County, Washington. Open-File Report . https://doi.org/10.3133/ofr90632
- Favalli, M. , Karátson, D. , Mazzuoli, R. , Pareschi, M. T. , & Ventura, G. (2005). Volcanic geomorphology and tectonics of the Aeolian archipelago (Southern Italy) based on integrated DEM data. Bulletin of Volcanology , 68 (2), 157–170. https://doi.org/10.1007/s00445-005-0429-3
- Furze, A. J. , Bard, J. A. , Robinson, J. E. , Ramsey, D. W. , Kuntz, M. A. , Rowley, P. D. , & MacLoed, N. S. (2017). Database for geologic maps of pyroclastic-flow and related deposits of the 1980 eruptions of Mount St. Helens, Washington: U.S. Geological Survey Data Series 1054 . https://doi.org/10.3133/ds1054
- Gabrielli, S. , De Siena, L. , Napolitano, F. , & Del Pezzo, E. (2020). Understanding seismic path biases and magmatic activity at Mount St Helens volcano before its 2004 eruption. Geophysics Journal International , 222 (1), 169–188. https://doi.org/10.1093/gji/ggaa154
- Gase, A. C. , Brand, B. D. , & Bradford, J. H. (2017). Evidence of erosional self-channelization of pyroclastic density currents revealed by ground-penetrating radar imaging at Mount St. Helens, Washington (USA). Geophysical Research Letters, 44, 2220–2228. https://doi.org/10.1002/2016GL072178
- Glicken, H. (1996). Rockslide-debris avalanche of may 18, 1980, Mount St. Helens volcano, Washington. Open-File Report 96-677 , 1–5. https://doi.org/10.3133/ofr96677
- Gorshkov . (1959). Gigantio eruption of the Volcano Bezymianny. Bulletin of Volcanology , 20 (1), 77–109. https://doi.org/10.1007/bf02596572
- Gravley, D. M. (2004). The Ohakuri pyroclastic deposits and the evolution of the Rotorua- Ohakuri volcanotectonic depression . University of Canterbury.
- Gustavsson, M. , Kolstrup, E. , & Seijmonsbergen, A. C. (2006). A new symbol-and-GIS based detailed geomorphological mapping system: Renewal of a scientific discipline for understanding landscape development. Geomorphology , 77 (1–2), 90–111. https://doi.org/10.1016/j.geomorph.2006.01.026
- Gutro, R. , & Puckett, C. (2004). Laser technology helps track changes in Mount St . Helens. NASA’s Goddard Space Flight Center , 1–2.
- Kuntz, M. A. , Rowley, P. D. , & MacLeod, N. S. (1990). Geologic maps of pyroclastic-flow and related deposits of the 1980 eruptions of Mount St. Helens, Washington . IMAP . https://doi.org/10.3133/i1950
- Lipman, P. W. , & Mullineaux, D. R. (1981). The 1980 eruptions of Mount St. Helens, Washington (Vol. 1250) . US Department of the Interior, US Geological Survey.
- Major, J. J. , Zheng, S. , Mosbrucker, A. R. , Spicer, K. R. , Christianson, T. , & Thorne, C. R. (2019). Multidecadal geomorphic evolution of a profoundly disturbed Gravel Bed River System—A complex, nonlinear response and its impact on sediment delivery. Journal of Geophysical Research: Earth Surface , 124 (5), 1281–1309. https://doi.org/10.1029/2018JF004843
- Manville, A. V. , The, S. , September, N. , & Manville, V. (2002). Sedimentary and geomorphic responses to ignimbrite emplacement: Readjustment of the Waikato River after the AD 181 Taupo Eruption, New Zealand. The Journal of Geology , 110 (5), 519–541. https://doi.org/10.1086/341596
- Mosbrucker, A. (2014). High resolution digital elevation model of Mount St. Helens Crater and Upper North Fork Toutle River Basin, Washington, based on an Airborne LiDAR survey of September 2009 . US Department of the Interior, US Geological Survey.
- Moyer, T. C. , & Swanson, D. A. (1987). Secondary hydroeruptions in pyroclastic-flow deposits: Examples from Mount St. Helens. Journal of Volcanology and Geothermal Research , 32 (4), 299–319. https://doi.org/ 10.1016/0377-0273(87)90081-3
- Paguican, E. M. R. , van Wyk de Vries, B. , & Lagmay, A. M. F. (2014). Hummocks: How they form and how they evolve in rockslide-debris avalanches. Landslides , 11 (1), 67–80. https://doi.org/10.1007/s10346-012-0368-y
- Schilling, S. P. , Carrara, P. E. , Thompson, R. A. , & Iwatsubo, E. Y. (2004). Posteruption glacier development within the crater of Mount St. Helens, Washington, USA. Quaternary Research , 61 (3), 325–329. https://doi.org/10.1016/j.yqres.2003.11.002
- Shea, T. , & van Wyk de Vries, B. (2010). Collapsing volcanoes: The sleeping giants ’ threat. Geology Today , 26 (2), 72–77. https://doi.org/10.1111/j.1365-2451.2010.00750.x
- Sherrod, D. R. , Scott, W. E. , & Stauffer, P. H. (2008). A volcano rekindled: The renewed eruption of Mount St. Helens, 2004-2006 . US Department of the Interior, US Geological Survey.
- Siebert, L. (1984). Large volcanic debris avalanches: Characteristics of source areas, deposits, and associated eruptions. Journal of Volcanology and Geothermal Research , 22 (3–4), 163–197. https://doi.org/10.1016/0377-0273(84)90002-7
- Smith, T. A. , & McKibbin, R. (1997). Modelling of hydrothermal eruptions: a review. Proc. 19th NZ Geothermal Workshop.
- Thouret, J. C. (1999). Volcanic geomorphology-an overview. Earth Science Reviews , 47 (1–2), 95–131. https://doi.org/10.1016/S0012-8252(99)00014-8
- Tripodo, A. , Casella, S. , Pino, P. , Mandarano, M. , & Rasa’, R. (2012). Geomorphological map of the Lipari volcanic island (Aeolian Archipelago – Italy). Journal of Maps , 8 (1), 107–112. https://doi.org/10.1080/17445647.2012.668770
- Twidale, C. R. (2004). River patterns and their meaning. Earth-Science Reviews , 67 (3), 159–218. https://doi.org/ 10.1016/j.earscirev.2004.03.001
- van Wyk de Vries, B. , & Davies, T. (2015). Landslides, debris avalanches, and volcanic gravitational deformation. the encyclopedia of volcanoes (Second Edi, Vol. 1) . Elsevier Inc. https://doi.org/10.1016/B978-0-12-385938-9.00038-9
- Ventura, G. , Vilardo, G. , Bronzino, G. , Gabriele, G. , Nappi, R. , & Terranova, C. (2005). Geomorphological map of the Somma-Vesuvius volcanic complex (Italy). Journal of Maps , 1 (1), 30–37. https://doi.org/10.4113/jom.2005.8
- Walder, J. S. , Schilling, S. P. , Sherrod, D. R. , & Vallance, J. W. (2010). Evolution of Crater Glacier, Mount St. Helens, Washington, September 2006—November 2009. U.S. Geological Survey Open-File Report 2010-1141 .
- Walder, J. S. , Schilling, S. P. , Vallance, J. W. , & LaHusen, R. G. (2008). Effects of lava-dome growth on the crater glacier of Mount St. Helens, Washington. A Volcano Rekindled: The Renewed Eruption of Mount St. Helens, 2004–2006 , 257–276. https://doi.org/10.3133/pp1750