
ABSTRACT
The city of Wałbrzych represents a geomorphic landscape, heavily modified by nearly three centuries of industrial activity, related mainly to coal mining. The key landforms due to human impact include spoil tips of various types, extensive levelled terrains, waste ponds, and railway embankments and cuts. Ground subsidence due to mining and water pumping have affected large areas. The map shows the distribution of anthropogenic landforms due to industrial activity, mainly coal mining, over an area of 85 km2. The thematic symbol set for the main map contains 22 classes of objects which show 13 distinctive types of landform modification due to construction, excavation, levelling and complex features. The Main Map is accompanied by inset maps showing generalized geology of the area, extent and magnitude of ground subsidence, as well as relief visualization.
1. Introduction
Industrial activity, especially mining, results in profound alterations of surface relief, which are both very extensive spatially, as well as evident due to creation of a variety of new landforms of substantial dimensions (CitationGoudie, 1981; CitationNir, 1983; CitationSütő, 2010). These changes may be direct and in most cases intentional (e.g. construction of spoil tips, waste settling ponds, excavation, levelling), or indirect and unforeseen (e.g. ground subsidence). The development of industrial activity also requires further infrastructural developments such as provision of transportation corridors. Railways have a major impact on landforms and if they are built in hilly terrains, construction of embankments and cutting of ditches becomes inevitable. The resultant landforms may persist long after actual mining activities ceased.
Coal mining, even if underground, is a particularly effective agent of surface transformation. In Central Europe many former and active mining districts exist (e.g. Upper Silesian coal mining region in southern Poland and north-eastern Czechia – CitationDulias, 2016; CitationMulková et al., 2016; Salgótarján area in Hungary – CitationHorváth & Csüllög, 2012) and these host impressive new landforms resulting from industrial activity. Actually, one of the early trials of large-scale geomorphic mapping worldwide was focused on the core of Upper Silesian Coal Mining District and a 16-sheet atlas was produced, where anthropogenic landforms received special attention (CitationKlimaszewski, 1959).
Some mining districts are located within relatively little diversified relief, whereas others have developed in mountainous terrains and the interplay between natural geomorphic landscape and man-made landforms results in specific visual characteristics of the landscape. In this work, we produce a map of landform change due to industrial activity in one such area, located in south-western Poland. The city of Wałbrzych developed due to coal mining, which has been thriving since the mid-nineteenth century to 1990s. Mining activities occurred within a small intramontane basin, so that the natural terrain conditions acted as a significant constraint for industrial development. The history and legacy of coal mining were the subject of a range of studies, from various points of view. Some of these included cartographic presentations (CitationPawlak, 1997; CitationWójcik, 1993, Citation2011, Citation2018), but none of these was as comprehensive as the Main Map in this contribution.
2. Study area
2.1. Geographical setting
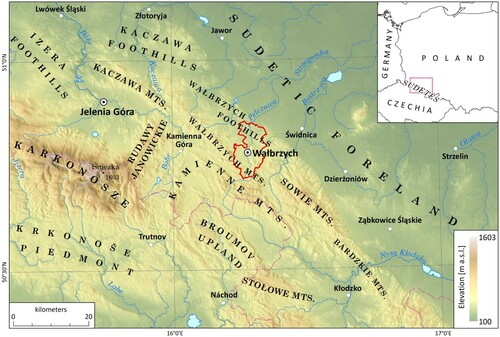
The city of Wałbrzych is located in SW Poland, in the central part of the Sudetes range, Central Europe (), within a low-to-medium height mountain relief (max elevation 843 m a.s.l., min elevation 305 m a.s.l.) typified by isolated hills or ridges, separated by basins and broad valleys. Natural relative relief is in the order of 150–300 m, with slopes locally as steep as 30°. This relief configuration and diversity reflect geological structure of the area (see Geology inset on the Main Map) and variable strength/resistance of different rock complexes. Geologically, most of the Wałbrzych area is part of the Intra-Sudetic Trough, which is a large topographic basin formed during the Variscan mountain building in the late Palaeozoic and subject to intermittent sedimentary filling from the Carboniferous up to the Cretaceous (CitationŻelaźniewicz, 2015). However, within the city limits only Carbonferous formations are represented (CitationBossowski & Ihnatowicz, 1994). Widespread post-orogenic volcanic and intrusive activity, associated with faulting, occurred in the late Carboniferous and early Permian cutting through older sedimentary formations (CitationAwdankiewicz, 1999). The northern part of the city area is underlain by older sedimentary formations of the Świebodzice Basin and these are mainly coarse conglomerates dated to Lower Carboniferous (CitationPorebski, 1981). Additionally, Lower Palaeozoic gneisses occur in the north-eastern part of the city. Only the Upper Carboniferous sedimentary rocks are coal-bearing (CitationMastalerz, 1992) and mining activity was concentrated in the southern part of the city, where these strata reach the surface. Therefore, large-scale landform modifications due to mining are confined to the southern part of the city.
Figure 1. Location map. Red line indicates administrative boundaries of Wałbrzych city in SW Poland.
Mountainous topography of the southern part of the Wałbrzych area is interpreted as resulting from more efficient denudation and surface lowering in sedimentary rocks, with concurrent gradual emergence of terrain elevations built of volcanic and subvolcanic rocks. However, the sedimentary rocks themselves are not uniform in strength either, supporting both broad elevations and intervening basins. Therefore, the most elevated terrain in the south-eastern part of the city (up to 853 m a.s.l.) is developed upon Carboniferous and Permian volcanic rocks, mostly rhyolites, whereas Lower Carboniferous conglomerates build the hills in the central part of the city (Lisi Kamień, 603 m a.s.l.). Much more subdued relief of the northern part of the city is associated with older sedimentary rocks and gneisses. During the Middle Pleistocene the area was at least once covered by the Scandinavian ice sheet (CitationKrzyszkowski & Stachura, 1998) which reached the intramontane basins but was too thin to cover volcanic elevations. The vertical limit of ice is estimated to reach c. 550 m a.s.l. (CitationTraczyk, 2019). Nevertheless, Quaternary deposits, generally thin, were not shown on the inset map in order not to conceal bedrock. However, these deposits were also locally mined, particularly clays deposited in the proglacial lakes, used for brick production.
2.2. History of mining and other industrial activity
The history of settlement in the contemporary Wałbrzych dates back to late medieval times and a small town likely existed here since the end of the 13th century (CitationStaffa et al., 2005). However, historically it was of very low significance, with the local economy based on textile manufacturing and trade. Coal exploitation in the area began in the mid-eighteenth century, after the area became part of Prussia (later Germany), and expanded in the early nineteenth century, with coal mines established in different parts of the Wałbrzych basin. Other industries followed, including textile and china ware production and stone quarrying. Concurrently, the urban area, initially confined to the valley floor of the Pełcznica river, expanded to the south and west, also encroaching on the surrounding hillslopes. To facilitate export of coal, in the 1850-1860s Wałbrzych was connected with the fast developing regional railway network. Railway building required considerable engineering work to cope with difficult topographic conditions, resulting in numerous high embankments and cuts. In the early twentieth century Wałbrzych was the main industrial and mining centre of the region, with more than 60.000 inhabitants just prior to World War II. After World War II the entire region became part of Poland and coal mining continued to expand, until early 1990s. Large coking plants were built in close vicinity. The second half of the twentieth century witnessed the most profound landscape changes, with the emergence of huge spoil tips and waste ponds, especially in the southern part of the city (CitationWójcik, 2013; and ). Local population reached more 140.000 in the late 1980s.
Figure 2. Comparison of landform change in the southern part of Wałbrzych, using archival cartographic materials: A – Messtischblatt at 1:25,000 (1886); B – Messtischblatt at 1:25,000 (1936); C – DTM visualization (terrain elevation data from approximately 2011).
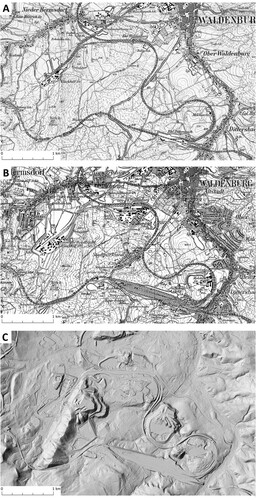
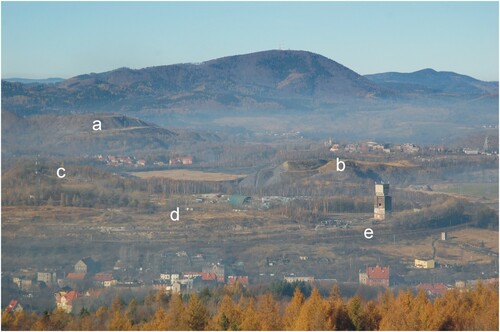
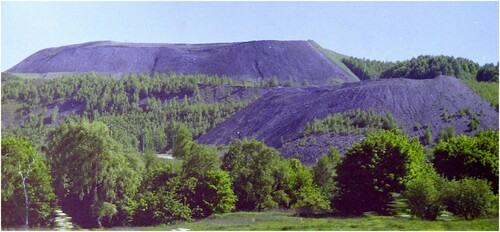
Figure 3. Contemporary view of the southern part of Wałbrzych. Notice large spoil tips (a, b, c), levelled ground left after demolition of a mines and coking plant (d) and railway embankment (e).
Economic transition to free market economy in the 1990s resulted in the termination of coal mining, considered non-profitable and too dangerous because of difficult geological conditions (thin coal seams, numerous faults and seam offsets, rock shattering zones), causing severe economic and social problems in the relatively big, almost entirely coal production-oriented city (CitationDołzbłasz, 2012; CitationDołzbłasz & Mucha, 2015). The development of Special Economic Zone helped to partially offset these problems, with new large production plants localized in the north-eastern part of the city.
3. Materials and methods
Airborne LiDAR-based digital terrain model (DTM) of 1 m resolution, obtained from the Polish Centre of Geodetic and Cartographic Documentation, provided background elevation. Its mean vertical error does not exceed 0.05–0.15 m (CitationKurczyński et al., 2015). This DTM was used as a basic information source for the spatial extent of anthropogenic landforms, as of ∼2010 (DTM was released in 2013). They were manually digitized on the basis of slope and shaded relief visualization of the DTM in its original resolution. Additional information on selected types of anthropogenic landforms such as spoil tips or waste ponds was obtained from literature, archival topographic maps at 1:25,000 scale from 1886, 1936 and later periods (available at https://geoportal.dolnyslask.pl/imap/?gpmap=gp62#gpmap=gp62; access date 2019-10-14), the 1:10,000 topographic map (http://mapy.geoportal.gov.pl/imap/Imgp_2.html), and database on anthropogenic objects (https://geolog.pgi.gov.pl).
Geology of the study area was presented in a generalized way, with several sheets of Szczegółowa Mapa Geologiczna Sudetów (Detailed Geological Map of the Sudetes) at 1:25,000 scale as background materials (CitationBossowski & Czerski, 1985; CitationBossowski et al., 1990; CitationGrocholski, 1971; CitationHaydukiewicz et al., 1982; CitationTeisseyre, 1969; CitationTeisseyre & Gawroński, 1965). Topographic data such as built-up areas, roads, railroads or hydrography were obtained from Baza Danych Obiektów Topograficznych 1:10,000 (Topographic Object Database 1:10,000) as of 2015 and corrected according to the elevation data if necessary.
The Main Map, presenting spatial distribution and variety of anthropogenic landforms, was designed at 1:20,000 scale, with an intention to be finally printed on a A1 paper sheet. Additional inset maps, presenting geology of the study area and the extent and amount of ground subsidence caused by coal mining (after CitationWójcik, 2011) were designed at 1:60,000 scale. The scale of the main map enabled us to present in detail industry-related geomorphological features of the Wałbrzych area. The thematic symbol set of the main map contains 22 classes of objects which represent landforms or mining shafts. Appropriate cartographic symbols were designed in line with the principles of maps graphic design such as legibility, visual contrast, figure-ground organization and hierarchical composition (CitationOtto et al., 2011; CitationRobinson et al., 1995). While the draft version of landform database was designed to represent only polygonal features, some of them could not be symbolized properly at the selected map scale due to the very small area, less than 0.2 ha. Hence, 33 landforms such as small spoil tips, quarries, clay pits, borrow pits, waste ponds and landfills were reduced into point representation (CitationRobinson et al., 1995). Moreover, it was necessary to create linear representation of selected polygon edges in order to represent properly the features of such forms as ditches, embankments or escarpments. Colours of polygon/point symbol fill were set in line with characteristics of landform features – cold colours were used to fill symbols of concave or levelled landforms while warm colours are used to fill symbols of convex ones.
Detailed representation of natural relief is provided by contour lines at 5 m interval, with index contour lines at 25 m interval. Contour lines were generated from the DTM resampled to 5 m resolution and smoothed using the PAEK algorithm (CitationBodansky et al., 2002), in order to achieve the level of detail appropriate to the scale of the Main Map. The symbols of topographic data such as built-up areas, roads, railways were designed in shades of gray, in order not to interfere with the perception of the thematic content.
4. Results
4.1. Typology of landforms due to industrial activity
A wide range of landforms produced by or directly related to industrial activity is present on the map. Altogether, 13 categories are distinguished, some were additionally differentiated according to the their height and/or dimensions, so that 19 separate symbols are used. In addition, the map includes the location of former coal mining shafts, in order to show the extent of coal mining industry within the city. ‘c.m.' annotation is introduced to indicate clearly which landforms result from coal mining and which are related to other activities.
Landforms due to industrial activity may be grouped into four classes, reflecting the nature of anthropic interference with the original ground surface:
construction landforms – spoil tips, embankments with associated escarpments, landfills
excavation landforms – quarries, loose sediment pits, ditches with associated escarpments
ground alterations due to levelling for building construction purposes, locally also associated with addition of sediment
complex landforms, whose origin involved both removal and dumping of material – waste ponds, bootleg mining zones
Spoil tips, excavation pits and waste ponds vary in lateral extension and include very small features, less than 0.2 ha. The latter are shown by means of symbols, whereas the large ones are outlined as they appear in the landscape. Spoil tips considerably vary in height and therefore an arbitrary value of 25 m was set to distinguish between tips of different height.
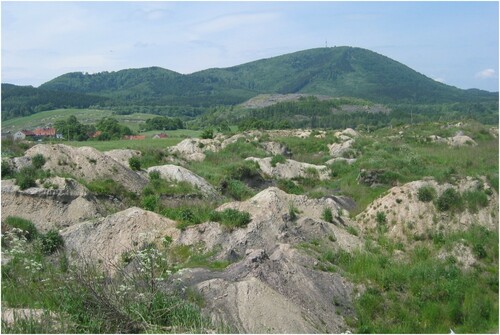
Bootleg (artisanal) mining zones are specific alterations of the ground surface, caused by uncontrolled (and illegal) digging and coal extraction from coal seams located close to the surface by individual people. Tunnels and pits are excavated, whereas the material is dumped next to the excavation site (). Small dimensions of individual landforms preclude their exact representation on the map, so that areal extent of affected terrain is shown. This type of activity, resulting from unemployment and poverty, was particularly common in the 1990s and occasionally continues until now.
Figure 4. Bootleg mining area in the western part of the city, with large spoil tips behind. Bedrock elevations form the skyline.
Centuries-long coal extraction leading to the origin of underground caverns and changes in stress field in the rock mass, combined with extensive alteration of hydrogeological conditions, resulted in considerable land subsidence. It reached as much as 18 m in the west-central part of the city over 1912–1996 period (CitationWójcik, 2011). Ground subsidence is an important cause and component of landform change, but cannot be shown using conventional symbols. Therefore, it was decided to use one of inset maps to illustrate both the extent and magnitude of subsidence within the coal mining area. CitationBlachowski and Milczarek (2014) analysed a longer period (1886–2009) and concluded that ground lowering may have reached 36 m in subsidence hot spots.
4.2. Dimensions
The map shows that landforms due to industrial activity vary in size whereas the numerical database provides quantitative information in this respect ().
Table 1. Dimensions of principal landforms due to coal mining activity.
Among anthropogenic landforms spoil tips are most represented. They occupy nearly 260 ha, with the largest one being 42.2 ha. Among them, 11 are higher than 25 m and these are also the largest ones. Most tips, including all large ones, have flattened (levelled) top surfaces (). In a few cases, the levelled tops were subsequently used as waste ponds. Landforms produced by other kinds of mining are considerably smaller. The largest quarry covers 2.8 ha (including adjacent spoil tip), whereas the largest former clay pit in Rusinowa occupies 4.1 ha.
Figure 5. Large spoil tips with flattened tops, shortly after termination of coal mining activity. Many tips have been completely afforested since, in planned or spontaneous manner.
Railway embankments (34) and ditches (16) jointly occupy 74.6 and 18.3 ha, respectively. The former reach 31 m high, whereas the deepest cut is 41 m deep and replaced a tunnel that existed in this place before (see ). The length of embankments is also impressive, with the longest continuous section being 1.45 km long.
Antropogenically levelled terrains occupy considerable space. Land rehabilitation of two coal mines in the southern part of the city involved levelling of 80 ha, whereas the development of a new industrial area in the north-east necessitated provision of nearly 200 ha of flat terrain.
4.3. Spatial distribution
Spatial association of anthropogenic, industry-related landforms with the area of occurrence of coal-bearing strata is expected and self-evident. Within the limits of coal mining zone all waste ponds and the vast majority of spoil heaps, including all the large ones, are located. Combined with extensive levelled terrain in the areas of former coal mines, these man-made landforms cover more than 400 ha, which is 12% of the entire coal mining zone area. They occur along two perpendicular belts, the NW–SE one, from the spoil tip next to the Wacław shaft to the Staszic shaft in the south-east, and the SW–NE one, encompassing terrains of the former Victoria and Thorez mines (Julia, Wanda and Paweł shafts). In the north-western part of the former belt, most extensive bootleg mining zones occur. A separate cluster of mining-related landforms can be observed between Stary Zdrój and Rusinowa, but they are much smaller and more dispersed. Bootleg mining is limited and does not result in significant landscape transformation. Within the former mining landscapes, waste ponds were located in the immediate vicinity of surface mine facilities, whereas spoil tips occur both in association with waste ponds and in isolation.
Other mining-related landforms have irregular distribution, reflecting local availability of resources. Clay pits, in which Pleistocene clays were exploited, are located in low-lying places (Rusinowa, Poniatów), where these unconsolidated sediments could have survived. Bedrock quarrying was limited within the city, with only a few small quarries present.
The large magnitude of anthropogenic interference with natural relief in the north-eastern part of the city, where the Special Economic Zone is located, is at first glance inconspicuous. Yet the map reveals that ground levelling to make industrial constructions possible affected as much as 194.63 ha, which is 75% of the total area of all spoil tips. Thus, the area of considerable landform modification has moved to the north-eastern part of the city.
The map shows also that building of railway tracks resulted in the emergence of new landforms almost along the entire length of railroads, particularly across the Wałbrzych Basin, where long curved embankments were built. Along the branch line from Konradów to Sobięcin (part of the line is beyond the coverage of the map), continuous alternation of ditches and embankments is evident. The former were dug in ridges descending towards the Wałbrzych Basin, whereas the latter were built across valleys. Construction of the main railway station in Wałbrzych involved levelling of 42 ha, along the length of nearly 2 km.
5. Conclusions
The city of Wałbrzych has long been known as a place of profound environmental impact from various industrial activities, especially coal mining, which was thriving since the mid-nineteenth century until the late twentieth century. Substantial modifications of landforms, soils, hydrological and hydrogeological conditions have occurred. There have been attempts to present these massive human impacts cartographically, but these maps were either printed at small scale (CitationPawlak, 1997) or the cartographic presentation was oversimplified (sketch-like). The Main Map presented in this paper shows the real distribution of anthropogenic landforms produced by mining and other industrial activities, as well as those closely connected with industry development (railway engineering works), using LiDAR-derived DTM as a background material. 13 categories of landform change are distinguished, and some are differentiated according to height and/or dimensions, so that 19 separate symbols are used (22, if one adds symbols for shafts and annotation). They cover a broad spectrum of landforms, due to construction, excavation, levelling, as well as complex landforms. Some of these, such as bootleg mining areas, could only be shown by their areal extent, with individual features of relief too small to be presented. Similar limitations apply to very minor spoil tips, and clay and sand pits, which were shown by means of symbols.
LiDAR-based DTM proved an invaluable source of information about the distribution, dimensions and spatial relationships of anthropogenic landforms. Historical maps helped to make decisions in uncertain situations, whether specific relief features are natural or man-made. A final note concerns the accuracy of the map from the temporal perspective. The DTM used was worked upon in the early 2010s and the Main Map shows the situation for that time. However, rehabilitation of former mining grounds proceeds area and includes deconstruction and levelling of spoil tips, as well as filling of former excavation pits and waste ponds (CitationDołzbłasz & Mucha, 2015; CitationWójcik, 2018). Very large features are not likely to disappear in short time, but smaller ones may meet this fate. Thus, the Main Map will become a useful reference point for future work on landscape change in the region and monitoring of landform evolution.
Software
Data pre-processing was conducted in QGIS (QGIS Development Team 2019) and ArcGIS 10.6.1. Cartographic design was done in ArcGIS 10.6.1, except the inset 3D visualization which was graphically enhanced in Adobe Photoshop CS6.
Walbrzych_MainMap.pdf
Download PDF (47.6 MB)Acknowledgements
The LiDAR data used for this study have been purchased and used with academic license DIO.DFT.DSI.7211.1619.2015_PL_N, according to the Polish law regulations in the administration of the Główny Urząd Geodezji i Kartografii (Head Office of Land Surveying and Cartography). We are very grateful to Heike Apps, Doriano Castaldini, Shen-en Chen, Alex Lechner, Chris Orton and an anonymous reviewer for helpful suggestions how to improve the paper.
Disclosure statement
No potential conflict of interest was reported by the author(s).
Additional information
Funding
References
- Awdankiewicz, M. (1999). Volcanism in a late Variscan intramontane trough: Carboniferous and Permian volcanic centres of the Intra-Sudetic basin, SW Poland. Geologia Sudetica, 32, 13–47.
- Blachowski, J., & Milczarek, W. (2014). Analysis of surface changes in the Wałbrzych hard coal mining grounds (SW Poland) between 1886 and 2009. Geological Quarterly, 58(2), 353–368. https://doi.org/10.7306/gq.1162
- Bodansky, E., Gribov, A., & Pilouk, M. (2002). Smoothing and compression of lines obtained by Raster-to-Vector conversion. In D. Blostein, & Y.-B. Kwon (Eds.), Graphics recognition algorithms and applications. 4th International Workshop, GREC 2001 Kingston, Ontario, Canada, September 7–8, 2001 (pp. 256–265). Springer.
- Bossowski, A., Cymerman, Z., Grocholski, A., & Ihnatowicz, A. (1990). Szczegółowa mapa geologiczna Sudetów 1:25 000, arkusz Jedlina-Zdrój. Wydawnictwa Geologiczne.
- Bossowski, A., & Czerski, M. (1985). Szczegółowa mapa geologiczna Sudetów 1:25 000, arkusz Boguszów. Wydawnictwa Geologiczne.
- Bossowski, A., & Ihnatowicz, A. (1994). Palaeogeography of the Upper Carboniferous coal-bearing deposits in NE part of the Intra-Sudetic Depression. Geological Quarterly, 38, 231–248.
- Dołzbłasz, S. (2010). Wałbrzych (Poland) – diversification of the economy is possible. In P. Wirth, B. Černič Mali, & W. Fischer (Eds.), Post-mining regions in Central Europe – problems, potentials, possibilities (pp. 92–103). Oekom.
- Dołzbłasz, S., & Mucha, P. (2015). Wykorzystanie terenów pogórniczych na przykładzie Wałbrzycha. Studia Miejskie, 17, 105–118.
- Dulias, R. (2016). The impact of mining on the landscape. A study of the Upper Silesian Coal Basin in Poland. Springer.
- Goudie, A. S. (1981). The human impact on the natural environment. Blackwell.
- Grocholski, A. (1971). Szczegółowa mapa geologiczna Sudetów 1:25 000, arkusz Mieroszów. Wydawnictwa Geologiczne.
- Haydukiewicz, A., Olszewski, S., Porębski, S., & Teisseyre, A. (1982). Szczegółowa mapa geologiczna Sudetów 1:25 000, arkusz Wałbrzych. Wydawnictwa Geologiczne.
- Horváth, G., & Csüllög, G. (2012). Salgótarján – The rise and fall of a mining and industrial region. In P. Wirth, B. Černič Mali, & W. Fischer (Eds.), Post-mining regions in Central Europe – problems, potentials, possibilities (pp. 40–52). Oekom.
- Klimaszewski, M. (ed.). (1959). Mapa geomorfologiczna Górnośląskiego Okręgu Przemysłowego 1:50 000. PAN.
- Krzyszkowski, D., & Stachura, R. (1998). Late quaternary valley formation and neotectonic evolution of the Wałbrzych Upland, Middle Sudeten Mts., Southwestern Poland. Annales Societatis Geologorum Poloniae, 68, 23–60.
- Kurczyński, Z., Stojek, E., & Cisło-Lesicka, U. (2015). Zadania GUGiK realizowane w ramach projektu ISOK. In P. Wężyk (Ed.), Podręcznik dla uczestników szkoleń z wykorzystania produktów LiDAR. (Handbook for users of training courses in the use of LiDAR products) (pp. 22–58). Główny Urząd Geodezji i Kartografii.
- Mastalerz, M. (1992). Petrography and depositional conditions of the coal seams of the Wałbrzych Formation, Intrasudetic Basin, SW Poland. Geologia Sudetica, 26, 47–82.
- Mulková, M., Popelka, P., & Popelková, R. (2016). Black land: The mining landscape of the Ostrava-Karviná region. In T. Pánek, & J. Hradecký (Eds.), Landscapes and landforms of the Czech Republic (pp. 319–332). Springer.
- Nir, D. (1983). Man as geomorphological agent. Kester.
- Otto, J. M., Gustavson, M., & Geilhausen, M. (2011). Cartography: Design, symbolisation and visualisation of geomorphological maps. In M. J. Smith, P. Paron, & J. S. Griffiths (Eds.), Geomorphological mapping. Methods and applications (pp. 253–295). Elsevier.
- Pawlak, W. (1997). Atlas Śląska Dolnego i Opolskiego. Ossolineum.
- Porebski, S. (1981). Sedymentacja górnego dewonu i dolnego karbonu depresji Świebodzic, Sudety Zachodnie. Geologia Sudetica, 16, 101–192.
- Robinson, A. H., Morrison, J. L., Muehrcke, P. C., Kimerling, A. J., & Guptill, S. C. (1995). Elements of cartography. Wiley.
- Staffa, M., Mazurski, K. R., Czerwiński, J., & Pisarski, G. (2005). Słownik geografii turystycznej Sudetów, t. 10. Góry Wałbrzyskie, Pogórze Wałbrzyskie, Pogórze Bolkowskie. I-BiS.
- Sütő, L. (2010). Mining: Extraction of fossil fuels. In J. Szabó, L. Dávid, & D. Lóczy (Eds.), Anthropogenic geomorphology: A guide to man-made landforms (pp. 131–154). Springer.
- Teisseyre, H. (1969). Szczegółowa mapa geologiczna Sudetów 1:25 000, arkusz Stare Bogaczowice. Wydawnictwa Geologiczne.
- Teisseyre, H., & Gawroński, O. (1965). Szczegółowa mapa geologiczna Sudetów 1:25 000, arkusz Świebodzice. Wydawnictwa Geologiczne.
- Traczyk, A. (2019). Geomorfologia masywu Lisiego Kamienia i problem pionowego zasięgu lądolodu plejstoceńskiego w Górach Wałbrzyskich. Przyroda Sudetów, 22, 189–214.
- Wójcik, J. (1993). Przeobrażanie ukształtowania powierzchni ziemi pod wpływem górnictwa w rejonie Wałbrzycha. Acta Universitatis Wratislaviensis, 1557, Studia Geograficzne, 59.
- Wójcik, J. (2011). Przemiany wybranych komponentów środowiska przyrodniczego rejonu wałbrzyskiego w latach 1975–2000, w warunkach antropopresji, ze szczególnym uwzględnieniem wpływu przemysłu. Rozprawy Naukowe Instytutu Geografii i Rozwoju Regionalnego Uniwersytetu Wrocławskiego, 21.
- Wójcik, J. (2013). Mining changes on the example of the Wałbrzych basin relief (The Sudetes, Poland). Zeitschrift für Geomorphologie, 57(2), 187–205. https://doi.org/10.1127/0372-8854/2012/0090
- Wójcik, J. (2018). Tereny pokopalniane Zagłębia Wałbrzyskiego 20 lat po zamknięciu kopalń węgla. Przegląd Geograficzny, 90(2), 267–290. https://doi.org/10.7163/PrzG.2018.2.4
- Żelaźniewicz, A. (2015). Przeszłość geologiczna. In A. Żelaźniewicz (Ed.), Przyroda Dolnego Śląska (pp. 39–99). Polska Akademia Nauk.