
ABSTRACT
The NW Iberian margin is a hyperextended continental margin, formed during the opening of the North Atlantic Ocean, where a subsequent partial tectonic inversion has undergone during the Alpine Orogeny. This succession of tectonic episodes determines the magnetic signature of the margin. The Spanish Exclusive Economic Zone Project has carried out seven one-month cruises between 2001 and 2009. To extend and densify the spatial coverage, we have used data from the World Digital Magnetic Anomaly Map. Here, we describe the methodology used for the acquisition and data processing of the magnetic field data. The use of diverse instrumentation, a non-complete external field’s cancelation, and the use of different magnetic core field models, contributed to the total error budget. To reduce it, we have used a leveling algorithm which minimizes all these contributions. Finally, a statistical analysis was applied using crossover residuals, showing a resolution better than 28 nT.
1. Introduction
Potential fields’ methods have been used widespread for the analysis of the structure and geodynamics of the Earth’s interior (e.g. CitationBlakely, 1995; CitationReeves, 2005). The geomagnetic method is the oldest technique for Earth’s subsurface exploration, and it is generally used in conjunction with other geophysical and geological data. It is based on the measurement and analysis of anomalies in the Earth’s magnetic field, caused by lateral variations in their magnetic properties. This methodology is used for a large variety of applications ranging from shallow, detailed investigations (archaeological and engineering sites) (e.g. CitationReynolds, 2011), exploration of economic resources (e.g. CitationDentith & Mudge, 2014), deep lithospheric structures and tectonics, geothermal and asthenospheric processes studies (e.g. CitationCatalán, 2003; CitationDyment et al., 2015; CitationMartos et al., 2017, Citation2018, Citation2019). Following this, the analysis of geomagnetic anomalies allows the discrimination between continental and oceanic domains, and the interpretation of the geodynamic evolution of a region. At sea, the high expenses of geological and geophysical exploration make difficult to accomplish extended and detailed studies, but the application of the magnetic method allows a low-cost first approximation to the general structure of a region.
In general terms, we consider an anomaly as the difference between the measured variable (i.e. total magnetic field) at a determined location and the expected measurement at the same place (i.e.: calculated from a magnetic model of the Earth interior). The total magnetic field is the result of several magnetic contributions. Electrical currents associated with convective movements in the Earth’s outer core cause the so-called main field contribution (about 98% of the total measured magnetic field) (CitationReeves, 2005; CitationThébault et al., 2006). In order of importance, the second group of magnetic sources contributing to the total field have a strength on average 3 to 4 orders of magnitude lower than the main field (in quiet solar conditions) (CitationThébault et al., 2010). They are commonly referred as external fields contribution, as their sources lie in the ionosphere and the magnetosphere. Finally, there is a minor contribution to the total magnetic field due to magnetization carried by rocks in the crust and upper mantle. This last contribution is called lithospheric field contribution, and commonly known as magnetic anomaly, as it is what remains once the main and the external fields’ contributions are subtracted from the total field measurements.
The first magnetic anomaly mapping in the NW Iberian margin region was published by CitationBlack et al. (1964), who deduced a continental origin for the seamounts region observed on the northern sector of the west Iberia margin. After that study, the CitationGroupe Galice (1979) published, among other studies related to the Leg 103 of the Deep Sea Drilling Project (CitationBoillot et al., 1988), a magnetic anomaly map of the west margin of Iberia. Later on, CitationVerhoef et al. (1986) made a compilation map of the NE Atlantic, from surveys carried out between 1956 and 1984, and Srivastava and others (CitationSrivastava et al., 2000; CitationSrivastava & Tapscott, 1986; CitationSrivastava & Verhoef, 1992) made a detailed interpretation of the magnetic anomalies observed in the conjugate margins of Iberia and Newfoundland. Other surveys, related to the Deep Sea Drilling Program (Leg 149), led the publication of a detailed magnetic study of the south of the Iberia Abyssal Plain (CitationWhitmarsh & Miles, 1995). These authors dated the onset of the Atlantic oceanic seafloor spreading, and provided hypotheses about the formation of ocean-continent transition in the study area.
More recently, in the frame of the World Digital Magnetic Anomaly Map (WDMAM), global magnetic anomaly grids, with 2 or 3 arc-minute resolution, have been published for the EMAG2 and WDMAM compilations respectively (CitationLesur et al., 2016; CitationMaus et al., 2009). Partially based on a subset of the marine tracklines used for the WDMAM grid, CitationCatalán et al. (2015) showed a magnetic anomaly map of the west Iberian margin, with a 6 km grid resolution. This map included the dataset from the Spanish Exclusive Economic Zone Project (SEEZ), using a special leveling for that study area.
The aim of this work is to present a new and improved magnetic anomaly map of the whole NW Iberia continental margin, including a detailed description of the methodology used for the acquisition and data processing of the magnetic field data. This new map merges previous compilations and available datasets with the measurements collected during the SEEZ cruises, with a 4 km grid resolution.
As the present magnetic anomaly map includes the northwest Iberia’s ocean-continent transition, it contains valuable information for the study of continental rupture processes and the beginning of oceanic accretion, as well as for the initiation of tectonic inversion of this hyperextended margin.
1.1. Geological setting
The area mapped here is located northwest of Iberia, comprising part of the West and the Northwest Iberia margins, from 13.85°W to 6.45°W longitude and between 40.05°N and 45.5°N latitude. It is characterized by an abrupt relief with a seamounts region where depths rise below 1000 m in areas 200 km offshore. To the west and north of this seamounts region, an abrupt increase in depth is found, ranging from less than 3000 m to more than 4000 m, separated only few kilometers. This area is an example of a non-volcanic hyperextended continental margin and it has been used as a reference in the scientific literature for the study of the rift to drift processes (e.g. CitationBoillot et al., 1989, Citation1995; CitationGroupe Galice, 1979; CitationSibuet, 1992; CitationWhitmarsh et al., 1996).
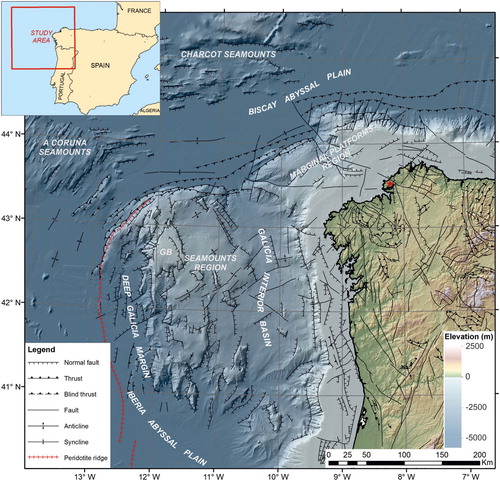
Several rift pulses underwent in the west Iberia margin from Late Triassic to Early Cretaceous times (e.g. CitationDean et al., 2015), including a westward rift axis jump (CitationManatschal & Bernoulli, 1999), in the vicinity of a triple ridge junction connecting the west and north Iberia margins. The first Late Triassic-Early Jurassic extensional phase involved the Galicia Interior Basin (GIB). The younger Aptian phase was characterized by a progressive continental crustal thinning until its final breakup and formation of the proto-Atlantic Ocean at Early Cretaceous (Aptian times). As a result of this staged rifting, there is an along-strike segmentation of the margin, as well as an across-strike succession of the different deformation domains related to the rift process (CitationDruet et al., 2018), matching the wide-ranging seafloor physiography. From east to west, it is distinguished (): the GIB, that is a marginal basin originated during the first rift episode of the margin (e.g. CitationMurillas et al., 1990; CitationPérez-Gussinyé et al., 2003); a horst, locally uplifted area (e.g. CitationDruet et al., 2018 and references therein), here called seamounts region, located between the GIB aborted rift axis and the westward final rift axis location; the Deep Galicia Margin area, where mantle exhumation occurs (e.g. CitationLymer et al., 2009; CitationWhitmarsh et al., 1996); and the Iberia abyssal plain, surrounding the margin to the west and south of the seamounts region. Northwest of Iberia, some marginal platforms can be identified (marginal platforms region), which are former half-graben basins, tectonically inverted (CitationDruet et al., 2018, p. 5; CitationMurillas et al., 1990); to the north and northwest, the Biscay abyssal plain is found.
Figure 1. Structural sketch of NW Iberia, modified from CitationGroupe Galice (1979), CitationBoillot et al. (1988, Citation1995), CitationGrimaud et al. (1982), CitationMurillas et al. (1990), CitationMalod et al. (1993), CitationAlvarez-Marrón et al. (1997), CitationRamírez et al. (2006), CitationVázquez et al. (2008), CitationDruet (2018), and CitationDruet et al. (2018). Gray-shaded background is a digital terrain elevation models from the EMODnet (offshore) and SRTM (onshore) open databases. The red star shows the location of the magnetic reference station at El Ferrol. GB, Galicia Bank. Inset shows the location of the study area represented on the Main Map. Modified from CitationDruet et al. (2019).
The conjugate of the NW Iberia margin is the southeast of the Flemish Cap (East of Newfoundland). Both present different structural characteristics, forming an asymmetric pair (e.g. CitationMohn et al., 2015; CitationSibuet et al., 2007). While the southeast of the Flemish Cap margin is narrow, with an ocean-continent transition (the transition from the normal continental crust to the normal oceanic crust) of only 30 km-width, the West Iberia Margin extends widely towards the ocean, narrowing northwards from ∼190 km at the southern IAP (CitationDean et al., 2000; CitationMinshull et al., 2014) until disappearing by Cenozoic tectonic inversion at the north of the seamounts region (CitationDruet et al., 2018, and references therein). The width of the transitional crust (exhumed mantle) identified along the ocean-continent transition is still under discussion, measured with differences of almost 70 km (from less than 100 km to 170 km) at the south IAP depending on the authors (e.g. CitationDavy et al., 2016; CitationDean et al., 2000, Citation2015; CitationWhitmarsh et al., 1996).
The magnetic pattern of the study region is then determined by two not simultaneous processes: first, the previously cited northward propagation of the Atlantic Ocean opening, mainly during Early Cretaceous; second, the N-S trending convergence between Eurasian and Iberian plates during Cenozoic times.
2. Data set and methods
2.1. Data acquisition and processing
The dataset used in this study was mainly acquired during seven one-month surveys, between the years 2001 and 2009 onboard the R/V Hespérides, in the frame of the Spanish Exclusive Economic Zone Project (SEEZ). A total amount of 16,620 nautical miles of data acquisition were sailed during the SEEZ project cruises. As the main objective of the SEEZ project surveys is to obtain multibeam bathymetry with 100% seafloor coverage, the survey lines are planned according to multibeam echosounder requirements. As a result, the spatial distribution of both the magnetic and gravity measurements is not uniform, with an irregular spacing and variable orientation of the surveyed lines (). The across-track distance range between 13 km (oceanic areas) and 500 m (close to the continental shelf). The along-track distance between readings is 50 m on average. During the surveys, time and position information was acquired via a differential GPS navigation system. Throughout the campaigns of the SEEZ project, three different marine proton-precession magnetometers have been used: Geometrics model G-801 and G-876, and a Marine Magnetics SeaSpy model 300 M. In order to extract the external fields’ contribution, a reference base station was installed and maintained at El Ferrol (Galicia, NW Spain, see ). There, two different proton-precession magnetometers were used: a GEOMAG SM90R for the 2001 and 2002 surveys, and a Scintrex Envimag model for the rest of the surveys. Later, ship’s position was shifted sternwards using a lag correction algorithm, as the sensor was deployed at an average distance of 200 m from the stern during the data acquisition. Taking into account the accuracy of the differential GPS system (better than 20 m) and the magnetic gradients characteristic of the area, it seems reasonable to expect a contribution of less than 1 nT rms error from positioning in areas far from the coast. To derive the corresponding magnetic anomaly values these datasets were reduced using the Definitive Geomagnetic Reference Field (DGRF).
Figure 2. Ship navigation lines with magnetic data acquisition during the different SEEZ project surveys (color coded), track lines compiled for the WDMAM (black lines), and the WDMAM grid points (blue stars) used here to broaden and densify the new grid, over the shaded relief model obtained from EMODnet (offshore) and SRTM (onshore) open datasets.
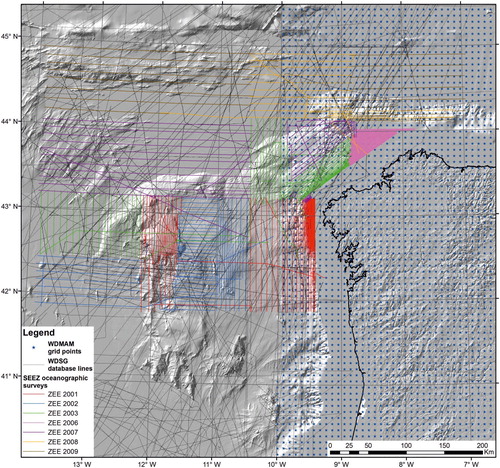
Besides to the SEEZ dataset, we have used data from the World Digital Magnetic Anomaly Map (WDMAM), which have helped to broaden and cover data gaps in the study area. Particularly for the oceanic region, we have used marine track lines data from a variety of oceanographic institutions gathered by the National Oceanic and Atmospheric Administration (see https://ngdc.noaa.gov/mgg/geodas/trackline.html). These data were carefully selected and reprocessed by CitationQuesnel et al. (2009), performing data cleaning, using the comprehensive model CM4 (CitationSabaka et al., 2004) to remove external field and core field contributions, and finally performing line leveling. These data were the base for the WDMAM version 1 and 2 (CitationLesur et al., 2016).
In order to facilitate studies of lithospheric transition from the continental margin to a fully oceanic domain, we have used the data provided for Iberia by the WDMAM database (https://wdmam.org). These data are computed with reference to geomagnetic field model CM4 for year 1990 at an altitude of 5 km above the WGS84 ellipsoid. They have been referred to the DGRF model, restoring the corresponding CM4 core field contribution. The data were then downward continued to sea level, combined with the marine data into a single database and then leveled using the Oasis Montaj™ package to obtain the final anomaly map.
Before merging the WDMAM data with marine data, we separate WDMAM continental and WDMAM oceanic data. Continental data was downward continued to sea level before merging with the leveled marine dataset (see Error Budget sub-Section). While upward continuation is a stable transformation and it can be performed for any height level, downward continuation is an unstable operation and it should be applied carefully as it can amplify the short wavelength part of the spectrum if the continuation downward to the depth of the nearest source (CitationBlakely, 1995).
Hereafter, the continental data were combined with the marine data into a single database and then leveled using the Oasis Montaj TM package to obtain the final map. The final map shows a smooth continuity (Main Map 1) and no distortion at the transition between continental and oceanic areas probably caused by the facts: (a) the continental area doesn’t present large magnetic anomalies, (b) the highest peak onshore (1200 m over sea level) is reached in the eastern boundary (far from coastline), and (c) the horizontal resolution of the WDMAM is 5 km, which restricts the spectral content in the most unstable part of the spectrum.
The final magnetic anomaly map of 4 km resolution for the study region was created using a Kriging algorithm of interpolation (CitationCressie, 1990). This interpolation differs from simpler methods, such as Inverse Distance Weighted Interpolation, Linear Regression … that it determines the most likely value at each grid node based on a statistical analysis of the entire data set. This algorithm helps to avoid possible distortions caused by random data locations, when along-track and across-track density reading are unbalanced (), or when the data acquisition lines have random directions, as is the case when we merge different SEEZ cruises, or the WDMAM cruises. The 4 km grid spacing was selected in order to avoid aliasing effects caused by the ship track-lines separation.
2.2. Error Budget
The anomaly crossover difference statistics between two tracks at tie points should reflect the error budget, allowing an evaluation of the accuracy and internal coherence of the whole dataset.
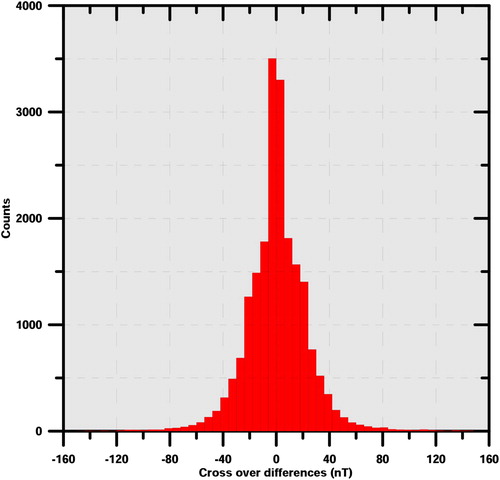
After obtaining the anomaly values along every marine track-line, we performed a cleaning phase by a visual inspection of the whole dataset extracting anomalous values. Subsequently, we carried out a first leveling process, which corrects for intersection errors that follow a specific pattern. We obtained the intersection points (crossovers) between track-lines. After visualizing the magnetic anomaly differences at crossovers, we disregard tie point readings whose differences are anomalous (spikes), generally caused because the tie point was located in a high gradient magnetic anomaly area. Finally, we got 20479 crossovers. For the magnetic anomaly residuals at tie points, we obtained a mean value of 0 nT and a standard deviation of 60 nT.
Using the clean crossover marine data set, and after applying the statistical leveling, we obtained an average residual value of 0.65 nT and a standard deviation of 27.52 nT. Afterwards, we obtained a new tie point readings data set using the leveled marine track-lines and the WDMAM grid at the oceanic realm. The differences at tie points between both data sets provided an average value of 15.2 nT, and a standard deviation of 50 nT. This bias means that the marine magnetic anomaly surface is almost 15 nT above the WDMAM compilation map. By conducting a new leveling process, and using 20693 crossovers, we reduced the bias at crossovers between the marine track-lines and the WDMAM data at the oceanic domain to 0.65 nT and a standard deviation of 27.54 nT ().
Figure 3. Histogram showing the distribution of magnetic anomaly differences at crossovers for the final data set.
The WDMAM shows on-land in this geographical area a quality similar to the presented marine map. According to this, the final marine survey presents an acceptable quality, not being affected by any relevant systematic error.
3. Brief magnetic anomaly map description and interpretation
The map of magnetic anomalies (Main Map) has been represented in color-coded scale. In the study area, the ranges of anomaly values vary from −310 nT to 660 nT, both located in the northern area (north of 44°N). According with regional magnetic anomaly trends, the map shows a very clear distribution. At the southwestern quarter, some north–south long wavelength trends of up to 300 nT amplitude can be identified. The upper half of the map (north of 42.5°N) presents multiple magnetic anomaly highs and lows located and aligned according to two main trends (E-W, and NE-SW).
The east–west high amplitude alignments in the northern area with dominance of negative values coincide with the Charcot seamounts chain (. See Magnetic anomaly map over the shaded relief model in Main Map). Generally speaking, the presence of north–south trends in the southwestern tip area, are related to the tectonic process of the Atlantic Ocean opening. The south central area of the map shows a dipolar anomaly (around 11.5°W longitude and 42.4°N latitude) that correlates with the Galicia Bank region (the highest and biggest of the seamounts, see for location), but slightly shifted towards the southeast with respect to the highest area (See minimum bathymetry point in the Magnetic anomaly map over the shaded relief model, Main Map). The same displacement to the southeast is also observed in the corresponding Bouguer Anomaly map (CitationDruet et al., 2019), associated to a relatively thicker continental crust in this area of the seamounts region (CitationDruet et al., 2018). The NE-SW trending positive anomaly that borders the seamounts region to the northwest and north can be correlated to the existence of a peridotite ridge to the northwest of the seamounts region (e.g. CitationDean et al., 2015; CitationDruet et al., 2018; CitationWhitmarsh et al., 1996), and with an oceanic crust thrust also to the north of this region (CitationDruet et al., 2018). Westwards from the seamounts region, and south of the A Coruña Seamounts (), there is another NE-SW trending positive anomaly that does not have a clear correspondence to any bathymetric or gravimetric feature. CitationDean et al. (2015) propose that these western ridges may result from a combination of oceanic core complex and generation of new oceanic crust.
4. Conclusions
The new magnetic anomaly map of the NW Iberian continental margin and the adjacent abyssal plains presented here, is built upon an improved magnetic database, bringing together the marine magnetic measurements from the SEEZ project surveys, and those compiled by the WDMAM project. The map is represented at a 1:800,000 scale, using a 4 km-squared regular grid.
The calculation of magnetic anomalies offers information on the distribution of magnetized bodies, which in turn provides insight into those geodynamic processes that caused them. Particularly, this magnetic anomaly map delivers a unique window to the geodynamic history of this sector of the North Atlantic Ocean, as well as important information regarding the continental break-up of this margin, considered as the archetype of the hyperextended continental margins.
Software
Data were reduced and processed using Oasis Montaj™ software from Geosoft. The three maps showed on the final chart (Main Map and complementary ones) were made using ArcGIS, with a customized rainbow color-coded scale to emphasize magnetic anomaly values. The final layout was performed with ArcGIS.
Geolocation information
The map and dataset presented are located between 40.05° N and 45.5° N latitude and 6.45° W and 13.85° W longitude.
JofMaps_NWIM_MAG_high__1_.pdf
Download PDF (31.4 MB)Acknowledgements
We are thankful for all the institutions and participants in the research cruises of the Spanish Economic Exclusive Zone project. This project is leaded by Spanish ‘Instituto Hidrográfico de la Marina’ and the ‘Real Instituto y Observatorio de la Armada’. Other participants are the ‘Instituto Geológico y Minero de España’, the ‘Universidad Complutense de Madrid’ and the ‘Instituto Español de Oceanografía’. We are grateful for the work of the different captains and crewmembers operating the R/V Hespérides during the cruises carried out from 2001 to 2009. The ‘Unidad de Tecnología Marina’ (CSIC) offered a priceless support during the cruises. We want to thank Mr. John Abraham and Dr. Wolfram Geissler, whose constructive comments and suggestions that certainly improved the Main Map and manuscript. The composite digital terrain model showed on the additional maps of the main chart has been constructed from the European Marine Observation and Data Network (EMODnet, https://emodnet.eu/bathymetry) and Shuttle Radar Topography Mission (SRTM, https://www2.jpl.nasa.gov/srtm) open databases.
Disclosure statement
No potential conflict of interest was reported by the author(s).
Data availability statement
NW_Iberia_MagneticAnomaly_2020.tif is a downloadable geotiff file of the magnetic anomaly (nT) information, with a 4 km-gridded spacing in a UTM 29N projection (WGS84 datum).
Additional information
Funding
References
- Alvarez-Marrón, J. , Rubio, E. , & Torné, M. (1997). Subduction-related structures in the north Iberian margin. Journal of Geophysical Research , 102 (B10), TC4003. https://doi.org/10.1029/2008TC002337 doi: 10.1029/97JB01425
- Black, M. , Hill, M. , Laughton, A. S. , & Matthews, D. H. (1964). Three non-magnetic seamounts off the Iberian coast. Quaternary Journal of the Geological Society of London , 120 (1–4), 477–517. https://doi.org/10.1144/gsjgs.120.1.0477
- Blakely, R. J. (1995). Potential theory in gravity and magnetic applications . Cambridge University Press, 441 pp.
- Boillot, G. , Beslier, M. O. , & Girerdeau, J. (1995). Nature, structure and evolution of the ocean-continent boundary: Thelesson of the west Galicia margin (Spain). In E. Banda , M. Torné , & M. Talwani (Eds.), Rifted ocean –continent boundaries (Vol. 463, pp. 219–230). NATO Advanced Study Institute Series, Series C, Kluwer.
- Boillot, G. , Féaud, G. , Recq, M. , & Girardeau, J. (1989). Under crusting by serpentinite beneath rifted margins. Nature , 341 (6242), 523–525. https://doi.org/10.1038/341523a0
- Boillot, G. , Winterer, E. L. , & Meyer, A. W. (1988). Proceedings of the ocean drilling program, scientific results , Vol. 103. Ocean Drilling Program.
- Catalán, M. (2003). A magnetic anomaly study offshore the Canary Archipelago. Marine Geophysical Researches , 24 , 129–148. https://doi.org/10.1007/s11001-004-5442-y
- Catalán, M. , Martos, Y. M. , Martín Dávila, J. , Muñoz-Martín, A. , Carbó, A. , & Druet, M. (2015). Radiografía de un margen continental utilizando campos potencialesy espesor de sedimentos: el Margen Atlántico Ibérico. Boletín Geológico Y Minero , 126 (2–3), 515–532.
- Cressie, N. (1990). The origins of kriging. Mathematical Geology , 22 (3), 239–252. https://doi.org/10.1007/BF00889887
- Davy, R. G. , Minshull, T. A. , Bayrakd, G. , Bull, J. M. , Klaeschen, D. , Papenberg, C. , Reston, T. J. , Sawyer, D. S. , & Zelt, C. A. (2016). Continental hyperextension, mantle exhumation, and thin oceanic crust at the continent-ocean transition, West Iberia: New insights from wide-angle seismic. Journal of Geophysical Research, Solid Earth , 121 (5), 3177–3199. https://doi.org/10.1002/2016JB012825
- Dean, S. , Minshull, T. , Whitmarsh, R. , & Louden, K. (2000). Deep structure of the ocean-continent transition in the southern Iberia abyssal plain from seismic refraction profiles: The IAM-9 transect at 40°20′N. Journal of Geophysical Research , 105 (B3), 5859–5885. https://doi.org/10.1029/1999JB900301 doi:10.1029/1999JB900301
- Dean, S. L. , Sawyer, D. S. , & Morgan, J. K. (2015). Galicia Bank ocean–continent transition zone: New seismic reflection constraints. Earth and Planetary Science Letters , 413 (C), 197–207. https://doi.org/10.1016/j.epsl.2014.12.045
- Dentith, M. , & Mudge, S. T. (2014). Geophysics for the mineral exploration geoscientist . Cambridge University Press. 426 pp.
- Druet, M. (2018). Geodinámica del margen continental de Galicia: Estructura profunda y morfotectónica. Publicaciones del Instituto Geológico y Minero de España, Serie Tesis Doctorales , 30 , 235.
- Druet, M. , Muñoz-Martín, A. , Granja-Bruña, J. L. , Carbó-Gorosabel, A. , Acosta, J. , Llanes, P. , & Ercilla, G. (2018). Crustal structure and continent-ocean boundary along the Galicia continental margin (NW Iberia): Insights from combined gravity and seismic interpretation. Tectonics , 37 (5), 1576–1604. https://doi.org/10.1029/2017TC004903
- Druet, M. , Muñoz-Martín, A. , Granja-Bruña, J. L. , Carbó-Gorosabel, A. , Llanes, P. , Catalán, M. , Maestro, A. , Bohoyo, F. , & Martín-Dávila, J. (2019). Bouguer anomalies of the NW Iberian continental margin and the adjacent abyssal plains. Journal of Maps , 15 (2), 635–641. https://doi.org/10.1080/17445647.2019.1644214
- Dyment, J. , Choi, Y. , Hamoudi, M. , Lesur, V. , & Thébault, E. (2015). Global equivalent magnetization of the oceanic lithosphere. Earth and Planetary Science Letters , 430 (C), 54–65. https://doi.org/10.1016/j.epsl.2015.08.002
- Grimaud, S. , Boillot, G. , Collete, B. , Mauffret, A. , Miles, P. R. , & Roberts, D. B. (1982). Western extension of the Iberian-European plate boundary during the early Cenozoic (Pyrenean) convergence: A new model. Marine Geology , 45 (1–2), 63–77. https://doi.org/10.1016/0025-3227(82)90180-3
- Groupe Galice . (1979). The continental margin of Galicia and Portugal, acoustic stratigraphy, dredge stratigraphy and structural evolution. In W. B. F. Ryan & J. C. Sibuet (Eds.), Proceedings of the deep sea drilling project, leg 47 (pp. 633–662). US Government Printing Office.
- Lesur, V. , Hamoudi, M. , Choi, Y. , Dyment, J. , & Thébault, E. (2016). Building the second version of the world digital magnetic anomaly map (WDMAM). Earth, Planets and Space , 68 (1), 27. https://doi.org/10.1186/s40623-016-0404-6
- Lymer, G. , Cresswella, D. J. F. , Reston, T. J. , Bull, J. M. , Sawyer, D. S. , Morgan, J. K. , Stevenson, C. , Causer, A. , Minshull, T. A. , & Shillington, D. J. (2009). 3D development of detachment faulting during continental breakup. Earth and Planetary Science Letters , 515 , 90–99. https://doi.org/10.1016/j.epsl.2019.03.018
- Malod, J. A. , Murillas, J. , Kornprobst, J. , & Boillot, G. (1993). Oceanic lithosphere at the edge of a Cenozoic active continental margin (north-west slope of the Galicia Bank, Spain). Tectonophysics , 221 (1993), 195–206. https://doi.org/10.1016/0040-1951(93)90332-E
- Manatschal, G. , & Bernoulli, D. (1999). Architecture and tectonic evolution of non-volcanic margins: Present day Galicia and ancient Adria. Tectonics , 18 (6), 1099–1119. https://doi.org/10.1029/1999TC900041
- Martos, Y. M. , Catalan, M. , & Galindo-Zaldivar, J. (2019). Curie depth, heat flux, and thermal subsidence reveal the Pacific mantle outflow through the Scotia Sea. Journal of Geophysical Research: Solid Earth , 124 (11), https://doi.org/10.1029/2019JB017677
- Martos, Y. M. , Catalán, M. , Jordan, T. A. , Golynsky, A. , Golynsky, D. , Eagles, G. , & Vaughan, D. G. (2017). Heat flux distribution of Antarctica unveiled. Geophysical Research Letters , 41 (1), 2390. https://doi.org/10.1002/2017GL075609
- Martos, Y. M. , Jordan, T. A. , Catalán, M. , Jordan, T. M. , Bamber, J. L. , & Vaughan, D. G. (2018). Geothermal heat flux reveals the Iceland hotspot track underneath Greenland. Geophysical Research Letters , 431 (7005), 147–149. https://doi.org/10.1029/2018GL078289
- Maus, S. , Barckhausen, U. , Berkenbosch, H. , Bournas, N. , Brozena, J. , Childers, V. , Dostaler, F. , Fairhead, J. D. , Finn, C. , von Freese, R. R. B. , Gaina, C. , Golynsky, S. , Kucks, R. , Lühr, H. , Milligan, P. , Mogren, S. , Müller, D. , Olesen, O. , Pilkington, M. , … Caratori Tontini, F. (2009). EMAG2: A 2–arc min resolution earth magnetic anomaly grid compiled from satellite, airborne, and marine magnetic measurements. Geochemistry Geophysics Geosystems , 10 (8), Q08005. https://doi.org/10.1029/2009GC002471
- Minshull, T. , Dean, S. , & Whitmarsh, R. (2014). The peridotite ridge province in the southern Iberia abyssal plain: Seismic constraints revisited. Journal of Geophysical Research , 119 , 1580–1598. https://doi.org/10.1002/2014JB011011
- Mohn, G. , Karnes, G. D. , Manatschal, G. , & Johnson, C. A. (2015). Structural and stratigraphic evolution of the Iberia – Newfoundland hyper-extended rifted margin: A quantitative modelling approach. In G. M. Gibson , F. Roure , & G. Manatschal (Eds.), Sedimentary basins and crustal processes at continental margins: From modern hyper-extended margins to deformed ancient analogues , Vol. 413. Geological Society, Special Publications, https://doi.org/10.1144/SP413.9
- Murillas, J. , Mougenot, D. G. , Boillot, G. , Comas, M. C. , Banda, E. , & Mauffret, A. (1990). Structure and evolution of the Galicia interior basin (Atlantic western Iberian continental margin). Tectonophysics , 184 (3–4), 297–319. https://doi.org/10.1016/0040-1951(90)90445-E
- Pérez-Gussinyé, M. , Ranero, C. R. , & Reston, T. J. (2003). Mechanisms of extension at nonvolcanic margins: Evidence from the Galicia interior basin, west of Iberia. Journal of Geophysical Research , 108 (B5), 2245. https://doi.org/10.1029/2001JB000901
- Quesnel, Y. , Catalán, M. , & Ishihara, T. (2009). A new global marine magnetic anomaly data set. Journal of Geophysical Research , 114 (B4), 1–11. https://doi.org/10.1029/2008JB006144
- Ramírez, M. S. , Lucini, M. , Plaza, J. , Carreño, E. , Martínez, J. M. , & de Vicente, G. (2006). Proyecto PRIOR: Determinación de fallas de Primer Orden mediante análisis integrado de datos geológicos . Consejo de Seguridad Nuclear, Colección Otros Documentos no 15.
- Reeves, C. (2005). Aeromagnetic surveys: Principles, practice & interpretation . Geosoft. 155 pp.
- Reynolds, J. M. (2011). An introduction to applied and environmental geophysics (2nd ed.). Wiley-Blackwell. 696 pp.
- Sabaka, T. J. , Olsen, N. , & Purucker, M. E. (2004). Extending comprehensive models of the earth’s magnetic field with Ørsted and CHAMP data. Geophysical Journal International , 159 (2), 521–547. https://doi.org/10.1111/j.1365-246X.2004.02421.x
- Sibuet, J. C. (1992). New constraints on the formation of the non-volcanic continental Galicia-Flemish cap conjugate margins. Journal of Geological Society , 149 (5), 829–840. https://doi.org/10.1144/gsjgs.149.5.0829
- Sibuet, J. C. , Srivastava, S. , & Manatschal, G. (2007). Exhumed mantle-forming transitional crust in the Newfoundland-Iberia rift and associated magnetic anomalies. Joournal of Geophysical Research , 112 (B6), B06105. https://doi.org/10.1029/2005JB003856
- Srivastava, S. P. , Sibuet, J. C. , Cande, S. , Roest, W. R. , & Reid, I. D. (2000). Magnetic evidence for slow seaoor spreading during the formation of the Newfoundland and Iberian margins. Earth and Planetary Science Letters , 182 (1), 61–76. https://doi.org/10.1016/S0012-821X(00)00231-4
- Srivastava, S. P. , & Tapscott, C. R. (1986). Plate kinematics of the north Atlantic. In P. R. Vogt & B. E. Tucholke (Eds.), The Geology of north America (vol. M): The western north Atlantic region (pp. 379–404). Geological Society of America.
- Srivastava, S. P. , & Verhoef, J. (1992). Evolution of Mesozoic sedimentary basins around the north central Atlantic: A preliminary plate kinematic solution. In J. Parnell (Ed.), Basins of the Atlantic seaboard: Petroleum geology, sedimentology and basin evolution (Vol. 62, pp. 397–420). Geological Society, Special Publications.
- Thébault, E. , Mandea, M. , & Schott, J. (2006). Modeling the lithospheric magnetic field over France by means of revised spherical cap harmonic analysis (R-SCHA). Journal of Geophysical Research , 111 , B05102. https://doi.org/10.1029/2005JB004110
- Thébault, E. , Purucker, M. , Whaler, K. A. , Langlais, B. , & Sabaka, T. J. (2010). The magnetic field of the earth’s lithosphere. Space Science Reviews , 155 (1–4), 95–127. https://doi.org/10.1007/s11214-010-9667-6
- Vázquez, J. T. , Medialdea, T. , Ercilla, G. , Somoza, L. , Estrada, F. , Fernández Puga, M. C. , Gallart, J. M. , Gràcia, E. , Maestro, A. , & Sayago, M. (2008). Cenozoic deformational structures on the Galicia bank region (NW Iberian continental margin). Marine Geology , 249 (1–2), 128–149. https://doi.org/10.1016/j.margeo.2007.09.014
- Verhoef, J. , Collette, B. J. , Miles, P. R. , Searle, R. C. , Sibuet, J. C. , & Williams, C. A. (1986). Magnetic anomalies in the northeast Atlantic Ocean (35°–50° N). Marine Geophysical Researches , 8 (1), 1–25. https://doi.org/10.1007/BF02424825
- Whitmarsh, R. , & Miles, P. (1995). Models of the development of the west Iberia rifted continental margin at 40°30′ N deduced from surface and deep-tow magnetic anomalies. Journal of Geophysical Research , 100 (B3), 3789–3806. https://doi.org/10.1029/94JB02877
- Whitmarsh, R. , White, R. , Horsefield, S. , & Sibuet, J. (1996). The ocean-continent boundary off the western continental margin of Iberia: Crustal structure west of Galicia Bank. Journal of Geophysical Research , 101 (B12), 28291–28314. https://doi.org/10.1029/96JB02579