
ABSTRACT
The mapping of election results has long been a popular topic among cartographers, journalists, data scientists and infographic authors. However, their work usually concludes with simple visualizations of a single election, and in most cases only the winning party is represented. Can we tell the story of a political party over two decades via maps? What were the reasons for the rise and fall of such party; in our case the Czech Social Democrats? Moreover, how were the changes in voting patterns spatially distributed and manifested? With our paper, we explore voting patterns as well as the voting history of specific parties related to the fate of Social Democrats in the Czech Republic in several national elections from 2006 to 2017. We would like to invite other political scientists to explore the election results in their countries, not just over time, but also in space, and ideally via maps.
1. Introduction
Maps have historically been used by those in power to carve out empires and maintain control over them (CitationChapin et al., 2005). Electoral processes do not exist in a void, they are geographic, that is, they are inherently linked to the locations at which they occur (CitationMansley & Demšar, 2015). Most English-speaking countries use plurality voting system (FPTP), and the majority of cartographic literature describes visualizations suitable for such electoral systems (CitationOndrejka, 2016). Various types of rectangular cartograms (CitationHeilmann et al., 2004), hexagons (CitationField, 2015a), and splashes (CitationField, 2015b), among many other methods (CitationField & Dorling, 2016), were used to visualize election results, but often only from one period/election. Although there have been studies which employed various GIS methods (e.g. CitationBernard et al., 2014; CitationDarmofal, 2008; CitationMansley & Demšar, 2015; CitationMaškarinec, 2017; CitationMaškarinec, 2019; CitationMedeiros et al., 2019; CitationShin & Agnew, 2007), complex spatial analysis of elections is still rare. With our paper, we would like to present a means by which maps, using GIScience with its geospatial analytics, as well as political science, can be used to explore voting patterns as well as the voting history of specific parties in several national elections from 2006 to 2017. We show how the results of spatial analysis can be used to further understand the effect of context on voting. Thematically we analyse the fall of the traditional Czech left-wing parties; the Social Democrats (ČSSD) and the Communist Party of Bohemia and Moravia (KSČM), and the rise of their rivals on the more populist side of the political spectrum; Freedom and Direct Democracy (SPD) and Action of Dissatisfied Voters (ANO 2011).
2. The decline of the traditional left in Europe: the Czech context
The rise of populism across Europe in recent years has been hotly debated in the community of political scientists (CitationMudde, 2004). The success of Donald Trump, Mateo Salvini, Jair Bolsonaro, Viktor Orbán and the occurrence of Brexit shows that radical parties and politicians are on the rise while traditional politics is in decline (CitationRama Caamaño & Casal Bértoa, 2019). The system in Central and Eastern Europe differs from the Western systems, nevertheless, in some countries we observe very similar patterns. The Czech Republic used to be one of the few Central and Eastern European states with a stable party system and no significant populist radical-right party. The party system was, for a long-time, dominated by the right-wing Civic Democrats (ODS) and left-wing Social Democrats. It was even likened to the Western Party system (CitationKlíma, 2013, p. 216). However, since the elections of 2010, the party system has changed dramatically. New populist parties have entered the parliament: Public Affairs (VV) and the ‘newer’ parties in the elections of 2013; Action of Dissatisfied Voters (ANO 2011) and Dawn of New Democracy (Úsvit), later transformed into Freedom and Direct Democracy (SPD) (CitationHaughton & Deegan-Krause, 2015; CitationMaškarinec, 2017; CitationMaškarinec, 2019). While ANO 2011 and VV could be labelled as ‘populists of the political centre’ (CitationHavlík & Voda, 2018), the Úsvit party that was re-established under its founder Tomio Okamura as Freedom and Direct Democracy is a typical right-wing populist movement. The party is a member of the Identity and Democracy faction in the European parliament, founded by Marine le Pen, along with other populist parties such as Lega, whose leader is Matteo Salvini, Alternative für Deutschland (AfD) and Freiheitliche Partei Österreichs (FPÖ).
The winner of the 2013 elections was the Social Democrats and they had no other choice than to form a coalition government with a new unknown political movement ANO 2011 led by billionaire and entrepreneur Andrej Babiš. ANO 2011 gave the impression of being a protest anti-party movement that is not ideological but builds on the expertise of its leaders (CitationWeichsel, 2017). This allowed it to flexibly change its manifesto priorities and segments of the electorate on which it focused, and professional political marketing was also used. As a result, in the recent parliamentary elections of 2017, ANO 2011 become the dominant political party in the country (18.65% in 2013 to 29.64% share of votes in 2017) and the Social Democrats fell from first position (20.45% vote share) to sixth position with a marginal 7.27% share of the vote. For the traditional Czech parties such dramatic shifts can be viewed even more negatively if we compare the 2017 results to those of the 2006 elections. In 2006 the Social Democrats gained 32.32%, and the Civic Democrats won the election with 35.38% of the vote. Interestingly, not only the Social Democrats, but also the traditional Czech Communist party have experienced huge losses despite the fact that the party has not been part of a government since 1989 (their vote dropped by half, from 14.91% to 7.76%). There is a real possibility that after decades of endurance (see CitationStegmaier & Vlachova, 2009) the Communist party will disappear from parliament for the first time since 1925.
The electoral results show the continuing decline of traditional Czech political parties on the left and on the right. While we neglect the story of the traditional conservative right, we focus exclusively on traditional left-wing parties, because their decline can be seen not only as a single country phenomenon, but also from a broader European perspective. The analysis explains three interrelated research questions (1) what socio-demographic variables are associated with the decline of traditional left-wing parties? (2) How do parties differ? (3) Where can we identify any statistically significant spatial effects of electoral change?
3. Analysing electoral results in political science
Technically, we have two distinct data sources to use in the analysis of electoral results and voter behaviour: individual data and aggregate level data. While we can easily model the individual causality from large comparative individual-level studies (e.g. European Election Study (EES) or European Social Survey), they have their own shortcoming (non/response bias, social desirability bias, representativeness, etc.). Yet regarding spatial analysis, we usually have too few cases within a cluster, whether at the level of administrative region or smaller county or even at the municipal level, as the number of individual respondents is typically between 1000 and 3000. Although CitationGhitza and Gelman (2013) showed that by means of multilevel models and post-stratification (MPR) we can quite precisely model and map the different behaviour of voters group across 50 American states, this method is not viable in countries with a smaller number of second-level units, such as the Czech Republic. Generally, the practice of using polling data is relatively limited among electoral geographers (CitationForest, 2018).
Spatial analysis predominantly relies on aggregate level data from electoral results and on sociodemographic and other data collected by the National Statistics office. Aggregate level data contains complete information, and unless an accidental mistake occurs during the collecting process, they are valid and reliable. The lower the level of the aggregation of data provided by the Statistical Office the better (e.g. precinct data would be superior to municipal level data), but the ultimate disadvantage of this is that we are unable to understand voter behaviour at the individual level, commonly known as the ecological fallacy (see CitationForest, 2018). We are completely unable to inspect hypotheses that are attitudinal or emotional (CitationKouba & Lysek, 2019). All interpretations of the results of aggregate level electoral studies must be treated with caution as regards the individual-level characteristics of voters associated with electoral behaviour (e.g. voter turnout or a vote for a specific party or even an invalid vote). Although there are methods which can be used, such as ecological inference (CitationKing et al., 2013), data are still on an aggregated level, and if there is no spatial variation in sociodemographic variables across electoral units (precincts/districts, etc.), there is no correlation between electoral results.
In political science, individual as well as aggregated level data are analysed by means of traditional regression analysis. Various kinds of logit (binomial or multinomial) regressions are employed in the former, while aggregated data are typically analysed by using standard ordinary least squares (OLS), even though the dependent variable cannot be negative, nor can it exceed 1 when measured as a percentage of votes. Additionally, both sets of data can be modelled as hierarchical, with observations clustered by electoral district or administrative region. Hierarchical modelling allows for cross-level interactions to model contextual effects. For example, we can hypothesize that lower-skilled manual workers are less likely to vote for populist parties in large urban areas as opposed to rural areas, and that the share of voters with primary education is associated more with populist votes in certain areas. Whilst regression modelling is the workhorse of electoral data analysis, more sophisticated spatial methods have only rarely been used in political science literature.
There are two methodological tools in GIS software used for the spatial analysis of elections: Geographically Weighted Regression (GWR) and Hot Spot Analysis (HSA). In the analysis of election results, the advice is to run the basic linear regression (OLS) first, in order to identify the key explanatory variables of party support and electoral turnout. In the second step, the key selected variables are then used for the GWR (CitationFotheringham et al., 2003), which identifies local spatial patterns and provides important information about where the explanatory variables are correlated with the percentage of votes gained by a party and where not. This feature can be likened to hierarchical regression models with a random intercept and slopes. Additionally, the value of local r2 or the regression coefficient can be visualized in order for us to see where the statistical model was successful in explaining party support and where not. Although the GWR is a useful tool for visualizing the spatial dimensions of the associations between a party’s share of the votes, electoral turnout and various explanatory variables, it is rarely used in political science literature (e.g. CitationMansley & Demšar, 2015). The GWR could also help in the debate on the contextual effect and whether space matters (see CitationForest, 2018, pp. 6–7). If the associations between predictors differ in space, we may blame the context that somehow shapes the strength of the effect over space. Moreover, sometimes the effect of a single variable is positive in some areas while negative in others.
The Hot Spot Analysis (or an alternative local indicator of spatial association (LISA)) is then used for several purposes. Primarily, we visualize the party ‘strongholds’ and, conversely, the areas where the party fails to attract votes. Differently put, the HSA identifies where the electoral results are spatially clustered and where they are randomly distributed (spatial outliers). This is the most common use of such analysis (e.g. CitationMaškarinec, 2019; CitationShin & Agnew, 2007). However, this tool should be used to analyse not only the electoral results, but also such derived variables as the differences in share of the votes, sociodemographic variables and, most importantly, it should be used to analyse further the residual values saved from the OLS (CitationBernard et al., 2014), the probit model (CitationMedeiros et al., 2019), the HLM and the GWR model. In this regard, the HAS of the residuals from the GWR model seems to be inferior to the HAS of the residuals from the simple OLS model, because the GWR eliminates the effect of spatial context as residuals become smaller and spatially less correlated (see the Supplemental material). Why is this an important analytical step? The combination of regression model and the identification of spatial non-random clusters of residuals may indicate contextual factors (measurable or unmeasurable) that modify the effect of independent variables in a space. Such information is of theoretical relevance for academic research and, moreover, it is equally crucial for effective political campaigning. It provides substantial information on which a PR team may base their campaign strategy.
4. Methods
We have analysed the results of parliamentary elections in the Czech Republic since 2006 when the party system was the most structured and seemingly stable. We have collected the precinct-level data of socio-demographic variables and paired them with the electoral results. The shapefile of the electoral precinct was obtained from the State Administration of Land Surveying and Cadastre Office.Footnote 1 In total there are 14,740 electoral precincts with a mean of 566 voters and a standard deviation of 414 voters. Large cities typically have precincts of around 1100 registered voters. To our knowledge, this is possibly one of the lowest aggregations that is available. For example, CitationMansley and Demšar (2015) analyse the London municipal elections from 625 electoral precincts with a mean population size of 13,078.
The individual household-level data are from the 2011 census conducted by the Czech Statistical Office. Merging the electoral results with census data from 2011 might seem problematic, however, the socioeconomic characteristics tend to be relatively stable over time. Moreover, the census data are only collected every decade and are not even available from the higher municipal level (e.g. religiosity). Census data only provides basic information on age, sex, education, religiosity, marital status and employment status. Therefore, we have also included in our spatial analysis the data on judicially ordered distraints of indebted citizens. The results of map analysis are presented in . The accompanying analysis, including regression models and the more advanced GWR, are presented in the Supplemental Material section where we further discuss our claims. In order to ensure the best possible map readability, sequential colour schemes were constructed following the principle of defining sufficient colour separation between individual shades as described by CitationBrychtová (2015) and CitationBrychtová and Çöltekin (2017). Data and the R code can be downloaded from DataverseFootnote 2 (CitationLysek, 2020).
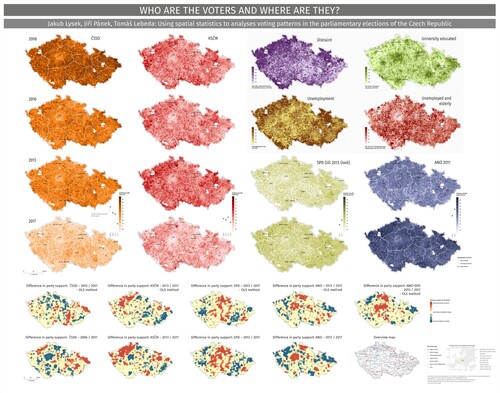
Figure 1. Main map: Using spatial statistics to analyse voting patterns in the parliamentary elections of the Czech Republic.
5. Discussion and conclusion
Before we discuss the results, we briefly comment on the spatial pattern of the sociodemographic variables. The percentage of tertiary educated voters spatially matches the large urban areas (Prague, Brno, Pilsen, the Ostrava agglomeration, etc.). The inverse of this is the map depicting the percentage of unemployed and elderly (age over 65). These both correlate with the percentage of distraints. The Czech Republic is clearly divided into peripheral areas characterized by low education, high unemployment, an ageing population and a high percentage of distraints, with other socioeconomic variables correlated, such as high divorce rates, low religiosity, high levels of criminality, etc. The difference has many causes but most evident is the spatial correlation with the former border of the so-called Sudetenland, where a German minority lived before their expulsion after the Second World War. Those areas were then re-populated by people seeking an easy way to acquire property or those forced to move there by the former Communist regime. The lost identity of those border regions is to blame for the socio-economic underdevelopment of those regions. Moreover, nowadays the situation is intensified by the migration of young and educated people from those regions to the richer cities. The situation on the peripheries of individual regions, which have poor transport accessibility to large cities and regional centres, is similar.
The main map shows that in 2006 and 2010 both traditional left-wing parties had their party support base in peripheral and socio-economically disadvantageous regions. Meanwhile, the new populist parties gained support relatively evenly across the country in 2013 election, and ANO 2011 even gained votes in urban areas. But the recent election in 2017 showed a dramatic shift. The ANO 2011 party became a typical left-wing party according to the structure of the electorate and their spatial support in socio-economically poor peripheral regions. It attracted former voters of the Social Democrats and, to a less extent, former Communist voters. The populist party of Tomio Okamura (SPD) similarly attracted former Communist voters and some from the Social Democrats. The highest rate of shift toward these two populist parties took place just in the areas that were base of left-wing parties before.
Even though ANO 2011 significantly increased its support and won in 2017 election, it also lost some smaller groups of voters from 2013 election. Some right-wing voters moved to ODS mainly in areas with a higher share of entrepreneurs – mainly in towns and cities. The gain of the majority of left-wing voters and the loss of right-wing voters made ANO 2011 a left-wing populist party. We can understand these dynamics because we have not modelled the simple electoral results, but our key variable is the difference in percentage of votes between the elections.
The mapping showed that the new populist parties and movements made gains in peripheral areas that are socially and economically poorer. While this is nothing new, the results of the HAS from OLS models show that the model underestimates the populist gains in several regions (namely Vysočina, Pardubice, and South Bohemia) correctly. The residuals cluster non-randomly, which indicates a possible contextual effect. To identify such effects requires further research and perhaps a more qualitative approach. The areas that are at a similar level of economic development score high on measures such as social capital and perceived local cultural identity.Footnote 3 Such factors are difficult to track using aggregated level census data.
Although many research papers concerning populist voters show that their reasons for voting in a particular way are attitudinal and may be governed by political socializations (CitationSpruyt et al., 2016), the sociodemographic and census data play a major role in explaining the populist parties’ success in the Czech Republic. The results are important for the traditional left-wing parties that have lost their traditional base of supporters to the new populist movements. Mapping the electoral results shows that the Czech Republic has to deal with the socio-economic problems of disadvantaged regions, otherwise the country will be more spatially polarized and this could eventually lead to a less stable political system and to a decline in the quality of democracy or even the loss of liberal democracy.
Software
The dataset was edited in QGIS and exported as PDF to Corel X6 for further cartographic work.
Supplemental Material
Download MS Word (967.4 KB)TJOM_1819901_Main Map.pdf
Download PDF (85.7 MB)Acknowledgements
The output has been financially supported by the Czech Science Foundation (GACR) as part of the grant project no. 19-14506S – Geoparticipatory spatial tools in the decision making processes of local administrations.
Disclosure statement
No potential conflict of interest was reported by the author(s).
Notes
1 The State Administration of Land Surveying and Cadastre Office, available at http://services.cuzk.cz/shp/
2 Dataverse – Open source research data repository software, available at https://dataverse.org/
3 Further analysis indicated that other former voters of ANO 2011 were attracted by STAN usually in the areas of smaller municipalities with higher social capital. Especially if there were STAN (Mayors and Independents) voting base from local elections. And finally, Pirates gained some of the former ANO 2011 liberal voters mainly in large cities – more in Bohemia than in Moravia.
Related Research Data
References
- Bernard, J. , Kostelecký, T. , & Šimon, M. (2014). Are there spatially contextual influences on voter behaviour even in a relatively nationalised party system? Geografie , 119 (3), 240–258. https://doi.org/10.37040/geografie2014119030240. https://www.soc.cas.cz/sites/default/files/publikace/g14-3_s240-258_bernard_kostelecky_simon.pdf
- Brychtová, A. (2015). Exploring the influence of colour distance and legend position on choropleth maps readability. In Lecture Notes in Geoinformation and Cartography (pp. 303–314). Springer. https://doi.org/10.1007/978-3-319-07926-4_23
- Brychtová, A. , & Çöltekin, A. (2017). The effect of spatial distance on the discriminability of colors in maps. Cartography and Geographic Information Science , 44 (3), 229–245. https://doi.org/10.1080/15230406.2016.1140074
- Chapin, M. , Lamb, Z. , & Threlkeld, B. (2005). Mapping indigenous lands. Annual Review of Anthropology , 34 (1), 619–638. https://doi.org/10.1146/annurev.anthro.34.081804.120429
- Darmofal, D. (2008). The Political Geography of the new deal realignment. American Politics Research , 36 (6), 934–961. https://doi.org/10.1177/1532673X08316591
- Field, K. (2015a). Election Pollocks. Retrieved August 27, 2019, from http://carto.maps.arcgis.com/apps/webappviewer/index.html?id=661d96be9fe64b3db4124546b67b2f39
- Field, K. (2015b). Political causeway: UK General Election 2015. Retrieved August 27, 2019, from http://carto.maps.arcgis.com/home/webscene/viewer.html?webscene=6f6c6d2ebe9a43d0bd13bed787ad08e6
- Field, K. , & Dorling, D. (2016). UK election cartography. International Journal of Cartography , 2 (2), 202–232. https://doi.org/10.1080/23729333.2016.1238744
- Forest, B. (2018). Electoral geography: From mapping votes to representing power. Geography Compass , 12 (1), 1–17. https://doi.org/10.1111/gec3.12352
- Fotheringham, A. S. , Brunsdon, C. , & Charlton, M. (2003). Geographically weighted regression: The analysis of spatially varying relationships . John Wiley.
- Ghitza, Y. , & Gelman, A. (2013). Deep interactions with MRP: Election turnout and voting patterns among small electoral Subgroups. American Journal of Political Science , 57 (3), 762–776. https://doi.org/10.1111/ajps.12004
- Haughton, T. , & Deegan-Krause, K. (2015). Hurricane season. East European Politics and Societies: And Cultures , 29 (1), 61–80. https://doi.org/10.1177/0888325414566072
- Havlík, V. , & Voda, P. (2018). Cleavages, protest or voting for hope? The rise of centrist populist parties in the Czech Republic. Swiss Political Science Review , 24 (2), 161–186. https://doi.org/10.1111/spsr.12299
- Heilmann, R. , Keim, D. A. , Panse, C. , & Sips, M. (2004). Recmap: Rectangular map approximations. In Proceedings – IEEE Symposium on information visualization, INFO VIS (pp. 33–40). IEEE. https://doi.org/10.1109/INFVIS.2004.57
- King, G. , Rosen, O. , & Tanner, M. A. (2013). Ecological inference: New methodological strategies . Cambridge University Press.
- Klíma, M. (2013). Koncept klientelistické strany. Případová studie Česká republika. Politologický Časopis , 20 (1), 215–235. https://doi.org/10.5817/PC2013-3-215
- Kouba, K. , & Lysek, J. (2019). What affects invalid voting? A review and meta-analysis. Government and Opposition , 54 (4), 745–775. https://doi.org/10.1017/gov.2018.33
- Lysek, J. (2020). Replication data for: Who are the voters and where are they? Using spatial statistics to analyse voting patterns in the parliamentary elections of the Czech Republic . Harvard Dataverse, https://doi.org/10.7910/DVN/FD0RYS
- Mansley, E. , & Demšar, U. (2015). Space matters: Geographic variability of electoral turnout determinants in the 2012 London mayoral election. Electoral Studies , 40 , 322–334. https://doi.org/10.1016/J.ELECTSTUD.2015.10.003
- Maškarinec, P. (2017). A spatial analysis of Czech Parliamentary Elections, 2006–2013. Europe-Asia Studies , 69 (3), 426–457. https://doi.org/10.1080/09668136.2017.1313962
- Maškarinec, P. (2019). The rise of new populist political parties in Czech parliamentary elections between 2010 and 2017: The geography of party replacement. Eurasian Geography and Economics , 60 (5), 511–547. https://doi.org/10.1080/15387216.2019.1691928
- Medeiros, M. , Forest, B. , & Erl, C. (2019). Where women stand: Parliamentary candidate selection in Canada. Politics Groups and Identities , 7 (2), 389–400. https://doi.org/10.1080/21565503.2018.1557056
- Mudde, C. (2004). The populist Zeitgeist. Government and Opposition , 39 (4), 541–563. https://doi.org/10.1111/j.1477-7053.2004.00135.x
- Ondrejka, P. (2016). Mapping election results in proportional electoral systems. Journal of Maps , 12 (sup1), 591–596. https://doi.org/10.1080/17445647.2016.1239558
- Rama Caamaño, J. , & Casal Bértoa, F. (2019). Are anti-political-establishment parties a Peril for European Democracy? A longitudinal study from 1950 till 2017. Representation , 1–24. https://doi.org/10.1080/00344893.2019.1643770
- Shin, M. E. , & Agnew, J. (2007). The geographical dynamics of Italian electoral change, 1987-2001. Electoral Studies , 26 (2), 287–302. https://doi.org/10.1016/j.electstud.2006.05.002
- Spruyt, B. , Keppens, G. , & Droogenbroeck, F. (2016). Who supports populism and what attracts people to it? Political Research Quarterly , 69 , 10.1177/1065912916639138
- Stegmaier, M. , & Vlachova, K. (2009). The endurance of the Czech Communist Party. Politics & Policy , 37 (4), 799–820. https://doi.org/10.1111/j.1747-1346.2009.00199.x
- Weichsel, V. (2017). Democracy in abeyance: The parliamentary elections in the Czech Republic, 2017. Osteuropa , 67 (9–10), 31–49.