
ABSTRACT
Urban and small catchment landslides and floods are common types of hazards caused by intense rainfall. The detailed geomorphological mapping and analysis of the superficial hydrographic network are fundamental tools to assess the geo-hydrologically critical areas. In this study, the Feltrino Stream and Lanciano area (Adriatic coastal-hills) were investigated through a basin-scale and urban-scale geomorphological analysis – which incorporated temperature-rainfall and morphometric analyses, and the acquisition of geomorphological and hazard data, integrated with geomorphological fieldwork and mapping. The creation of a geodatabase and the data overlay led to assess the landslide–flood critical areas through geomorphology-based matrices. This study aimed to define the distribution of landslide–flood historical/recent events and related critical areas for the realization of an urban EWS, composed of a network of nine gauges, integrating the existing regional monitoring network. It defined a local alert system for landslide–flood and could support real-time communication for civil protection purposes.
1. Introduction
The Mediterranean regions are usually affected by moderate to low annual rainfall and occasional heavy rainfall events, which have generally increased in recent decades (in terms of frequency and magnitude). In this context, in urban areas, the risk presented by pluvial flooding and related geomorphological hazards has emerged as a critical issue. Pluvial flooding occurs if rainfall intensity overcomes the capacity of the natural or engineered drainage network. The risk has increased and is expected to increase in frequency, severity and impact with the combined effects of climate change and urbanization (CitationAlfieri et al., 2015; CitationAlvioli et al., 2018; CitationBathrellos et al., 2016; CitationBlöschl et al., 2019; CitationGroisman et al., 2005; CitationRosenzweig et al., 2018; CitationSharma et al., 2018). Thus, the recurrence and magnitude of flooding (e.g. pluvial) and landslide (e.g. rainfall-induced) events is varying as the related exposure of urban areas. These events are due to various factors such as geological and geomorphological setting, environmental degradation, rapid population growth, and intensified and improper land uses. Furthermore, the expansion of urban areas and infrastructure over the last 50 years has led to a marked increase in flood and landslide exposure and risk (CitationBathrellos et al., 2016; CitationCevasco et al., 2015; CitationFroude & Petley, 2018; CitationGarcía-Soriano et al., 2020; CitationGuerriero et al., 2018; CitationJha et al., 2012; CitationNapolitano et al., 2018; CitationNirupama & Simonovic, 2007; CitationQuesada-Román et al., 2020; CitationRamos et al., 2017). Despite the recent advances in methods for assessing pluvial flood and rainfall-induced landslides hazards and risks and enhancing the resilience of cities, the preparation of maps of natural hazards and critical areas is still fundamental for urban development and management. These methods have not been broadly implemented due to a lack of perception, and there are still many opportunities to apply these methods to urban areas and perform additional research, particularly on multi-hazard assessment and mapping (CitationBathrellos et al., 2017; CitationRosenzweig et al., 2018; CitationSalvati et al., 2014). An evaluation of the potential areas’ extent affected by floods or landslides is crucial for risk assessment and management, the management of civil protection and, consequently, the reduction of human injuries, fatalities and social-economic-structural damage (CitationBozzano et al., 2020; CitationBrunetti et al., 2010; CitationGonçalves et al., 2015; CitationTeng et al., 2017; CitationToda et al., 2017). Geomorphological mapping is an essential tool for analyzing the territories exposed to geo-hydrological hazards. Urban landscapes are probably the most complex to analyze and map because the stratification of urbanization and the anthropic morphological changes obliterate the original natural landscapes. Furthermore, urban growth induces the realization of engineered drainage systems with the sealing of natural surfaces and streams (increasing surface water runoff) and the underground channeling of the natural drainage network (CitationDi Salvo et al., 2017). This might worsen hydraulic hazards. Detailed urban geomorphological mapping is, thus, a useful tool for understanding the effects of urbanization on geomorphic systems and geo-hydrological risk (e.g. pluvial floods; CitationBathrellos et al., 2012; CitationEeyles, 1997; CitationLin et al., 2019; CitationPaliaga et al., 2019; CitationRoccati et al., 2020; CitationVisser, 2014).
Early Warning Systems (EWSs) are one of the methods and tools to increase urban resilience to geomorphological hazards. These systems are fundamental for disaster management and adaptation, and the preparation of response strategies, and are becoming increasingly used at the national and regional scales (CitationChikalamo et al., 2020; CitationCorral et al., 2019; CitationGonzález-Cao et al., 2019; CitationHarilal et al., 2019; CitationHofmann & Schüttrumpf, 2019; CitationKrzhizhanovskaya et al., 2011; CitationMa et al., 2019; CitationParker, 2017; CitationRosi et al., 2015; CitationSegoni et al., 2018). To be useful at the urban scale, EWSs should be implemented incorporating (1) geomorphologically based mapping; (2) an assessment of landslide–flood critical areas at the basin and local scales; (3) an integrated geodatabase for the management of base data and critical area mapping; (4) IOT (internet of things) networks of urban gauge–sensors, realized by taking into consideration the overall features of the specific catchments or urban areas (e.g. temperature, rainfall, morphological, and geomorphological characteristics); and (5) applications for smartphones. Thereby, EWSs can respond to local needs and support/integrate the regional/national scale alerting systems (e.g. CitationChen et al., 2015; CitationFerretti et al., 2019) as a tool for risk prevention and civil protection purposes (CitationAcosta-Coll et al., 2018; CitationAzid et al., 2015; CitationBrandolini et al., 2012; CitationPiacentini et al., 2020; CitationRosi et al., 2017).
This paper aims to illustrate the results of the detailed basin-scale geomorphological analysis for the realization of an EWS in the urban area of Lanciano and the Feltrino Stream basin, a minor coastal basin of the Abruzzo piedmont and Adriatic hills (Central Italy; ), affected by heavy rainfall and pluvial flood/landslide events. In the last 90 years, at least 30 main events have occurred, inducing moderate to severe damage in the study area, which means >1 event every 3 years (considering the incomplete documentation from 1961 to 1980; ). This is one of the main incentives for this study within the Communicate to Protect Project funded by the Abruzzo Region for the realization of an urban-scale EWS (CitationAbruzzo Region, 2017). The geomorphological analysis was focused on the definition of landslide–flood critical areas and incorporates a geomorphological fieldwork, extensive investigations of the superficial hydrographic network and digital mapping. An in-cloud geodatabase and the implementation of rainfall-hydrometers-flooding gauges allowed for the realization of an IOT-based EWS connected to digital applications for smartphones. The overall system – integrating, at the local scale, the existing regional monitoring network (Allarmeteo, http://allarmeteo.regione.abruzzo.it/)–is aimed at creating a local alert system for pluvial flooding and landslides and supporting real-time communication for civil protection purposes in heavy event management and direct citizen alerting and warning.
Figure 1. Three-dimensional view (from 20 m DTM, SINAnet) of the Abruzzo Region and main physiographic domains. The purple line indicates the Feltrino Stream basin.
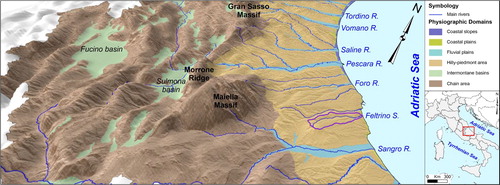
Table 1. Summary of the historical (1928–1961; CitationMunicipality of Lanciano, 2008) and recent rainfall-induced flood and landslide events, which affected the Lanciano area and Feltrino Stream (from CitationPiacentini et al., 2020).
2. Study area
The Feltrino Stream basin is located in the hilly area of the Abruzzo Region. It is an NW-SE elongated basin (area ∼50 km2), flowing from the eastern piedmont of the Maiella Massif (∼400 m a.s.l.) to the Adriatic coast. The landscape features an overall mesa and plateau geomorphological configuration resulting from an Early Pleistocene-to-present evolution connected to regional uplift and drainage network incision (CitationD’Alessandro et al., 2003, Citation2008; CitationMiccadei et al., 2017). Thus, the Feltrino basin is carved on marine bedrock composed of Early Pleistocene clayey-sandy-conglomeratic deposits and Middle Pleistocene sand-conglomerate (CitationArtoni, 2013; CitationBigi et al., 2013; CitationISPRA, 2010; CitationOri et al., 1991). The present structural setting is defined by a regional homocline gently dipping NE.
The geomorphological landscape is strictly related to the SW-NE arrangement of the main valleys, and their connection with structural landforms (i.e. structural scarps, mesa and plateau top surfaces). The landscape results from the superimposition of major slope gravity, fluvial landforms (landslides and V-shaped valleys) and soil erosion processes (surface runoff and gullies), which have progressively incised and smoothed the hillslopes. As a consequence, the bedrock is now largely covered by near-surface clay–silt–sand–gravel Late Pleistocene–Holocene continental deposits (i.e. slope and landslide deposits, and fluvial and colluvial deposits; CitationCalista et al., 2016; CitationCalista et al., 2019; CitationCarabella et al., 2020; CitationMiccadei et al., 2012; CitationPiacentini et al., 2015; CitationPiacentini et al., 2018).
3. Methods
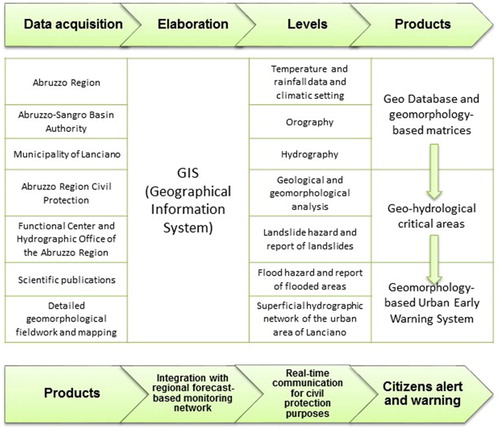
The detailed geomorphological analysis of the Feltrino Stream basin was based on an integrated approach that supported the assessment of landslide–flood-critical areas and the implementation of the EWS. This approach incorporates the analysis of temperature and rainfall data, cartographic and morphometric analyses, and the acquisition of available geological-geomorphological-hazard data, integrated with a detailed geomorphological fieldwork and mapping. The creation of a geodatabase and the data overlay led to the assessment of the critical areas through geomorphology-based matrices ().
Figure 2. Methodological flowchart.
The climatic setting was investigated through the analysis of a temperature and rainfall dataset obtained from a network of 13 gauges provided by the Functional Center and Hydrographic Office of the Abruzzo Region. Using the ArcGIS (CitationESRI, 2018) Kernel Interpolation function, the variation of the distribution of temperature and rainfall in the study area was derived for a 30-year time period (1987–2017).
The morphometric and hydrographic analyses and mapping were carried out with QGIS (CitationQGIS Development Team, 2019). Vectorial topographic data (1:25,000–1:10,000 scale, CitationAbruzzo Region, 2007a, Citation2007b) and a 10 m cell Digital Terrain Model (DTM) were processed (the data were retrieved from Open Data service of the Abruzzo Region). With the DTM, the main orographic features were analyzed (i.e. the elevation, slope and aspect; CitationStrahler, 1952). Furthermore, basin boundaries and drainage lines, as hierarchized according to CitationStrahler (1957), were automatically obtained from the DTM and verified through 1:5,000 air-photos (CitationAbruzzo Region, 2010).
The Main Map presented in this paper includes three main sections:
Previous data analysis (central-upper part);
Field work analysis (upper right part);
Landslide and flood critical area (middle-lower part).
The analysis of existing data was based on public authorities’ technical reports and maps, and scientific publications. The available literature data include scientific papers and maps (i.e. CitationPiacentini et al., 2015), mapping provided by official authorities (i.e. Piano di Assetto Idrogeologico – PAI – database, CitationAbruzzo Region, 2008a, Citation2008b, Citation2019; CitationTrigila et al., 2018; Piano di Difesa dalle Alluvioni – PSDA – database, CitationAbruzzo Region, 2008c; CitationTrigila et al., 2018) and filings – reports of landslide and flood events provided by National Group for Prevention of Hydrological Hazards (CitationGNDCI, 1994) and Municipality of Lanciano (Citation2008, Citation2015, Citation2019). This analysis allowed us to define the lithological and geomorphological setting and the landslide–flood hazard distribution in the study area.
Furthermore, detailed geomorphological field analysis of the superficial and underground drainage network (i.e. urban channelized networks) of the urban area of Lanciano was performed, which allowed the evaluation of the influence of the actual urban drainage network on the local flood-landslide processes. In detail, we used the drainage network from the Regional Technical Maps (CitationAbruzzo Region, 2007c), in which the drainage lines were divided into main and secondary, and natural and artificial streams. These drainage lines were verified using cadastral maps, high-resolution aerial photos with 1 m resolution, and LiDAR data, provided by Ministero dell’Ambiente e della Tutela del Territorio e del Mare. Then, the whole urban area of Lanciano was examined through a detailed field survey. The superficial drainage lines (defined as anthropic drainage lines) and their underground prosecution (termed as underground channels) were identified in the field and mapped, as were the depressed areas already affected by flooding. Finally, all bridges, underpasses and raceways were analyzed by field surveys and mapped, defining the under-bridge channels.
This stepwise analysis led to the definition of a multilayer geodatabase with geological, geomorphological and hydrographic data, which was the base for the assessment of the landslide–flood critical areas.
The critical areas were assessed through geomorphology-based matrices (see the main map), by the overlaying of pre-existing geological, geomorphological and hazard data and new detailed field-based maps of geomorphological and hydrographical features, managed within the geodatabase. Five categories of landslide-critical areas were derived from the overlying of landslide hazard (CitationAbruzzo Region, 2008b, Citation2019; CitationTrigila et al., 2018) and reports of landslide data and geomorphological field surveys (critical areas for scarps and cavities were also included). Three categories of flood critical areas were derived by overlaying flood hazard (CitationAbruzzo Region, 2008c; CitationTrigila et al., 2018), reports of floods and detailed drainage network mapping carried on in this work. Low (C1) critical areas include the lowest flood/landslide hazard areas, areas where secondary streams are present and areas where no previous flood/landslide events were reported. Moderate (C2) critical areas include areas with medium–high values of flood/landslide hazard, main streams and anthropic drainage lines, and areas with no reports of previous flood/landslides. High (C3) critical areas are those in which past floods events or landslide activity are reported (CitationGNDCI, 1994; CitationMunicipality of Lanciano, 2008, Citation2015, Citation2019);very high flood/landslide hazard class is present; and depressed areas, under-bridge and underground channels are present. Finally, the attention areas for scarps and reports of collapsed areas define the critical areas for scarps (Cs) and cavities (Cc), respectively. These critical area maps are not intended to be a static tool but can be continuously updated and verified following detailed hydrological analyses and landslide investigations and after the occurrence of new events.
This analysis allowed the definition of the most critical areas, in which a network of rainfall- and flood-monitoring instruments was implemented (weather stations, hydrometers and flood sensors), which was also integrated with existing monitoring devices (i.e. inclinometers, landslide monitoring systems, weather sensors, etc.). This led to the emplacement of an urban real-time monitoring system in the municipality of Lanciano. This system is the base for the implementation of an IOT-based EWS and communication system for citizen and civil protection communication.
4. Results
4.1. Climatic analysis
The Feltrino Stream basin, as well as the entire Abruzzo coastal hilly area, is characterized by a Mediterranean climate with wet autumns and winters, periods of high snowmelt and rainfall in spring, and dry summers (CitationDi Lena et al., 2012; CitationPeel et al., 2007). The region shows average annual temperature values between 14.5 and 17°C, which are correlated with the elevation, with a 0.25°C/100 m gradient (a). The average rainfall distribution (b) shows values ranging from ∼950 to ∼600 mm/y, with the highest values (∼950 mm/y) in the western area (Guardiagrele) and the lowest (∼600 mm/y) in the SW area (Casoli) and towards the NE (coastal area). The entire Feltrino Stream basin experiences rainfall values of 700–750 mm/y.
Figure 3. Climatic analysis of the study area (modified from CitationPiacentini et al., 2020): (a) Average annual temperature; (b) Average annual rainfall; (c) Average maximum rainfall within 1 h; (d) Average maximum rainfall within 24 h.
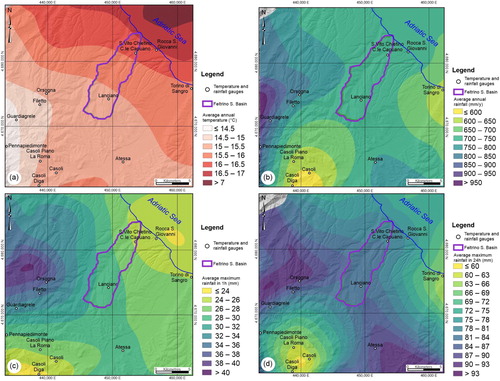
As recorded in rainfall time series, especially for recent decades, occasional heavy rainfall events ranging from 60 to 80 mm within a few hours (with the average values of maximum rainfall within 1 h ranging from 20 and 40 mm; c) to >200 mm in one day (with the average values of maximum rainfall in 24 h ranging from 60 to 93 mm; d) occurred. These events induced several landslide and flood (especially urban flash flood) events (i.e. in January 2003, December 2013, February–March 2015, January–February 2017, November 2017 and June 2018; CitationPiacentini et al., 2018, Citation2020; CitationFerretti et al., 2019).
4.2. Orography and hydrography
The Feltrino Stream basin reaches its maximum altitude in the southernmost sector (∼400 m a.s.l.), and features a tabular relief landscape gently NE-dipping (a). This landscape is interrupted by the principal SW-NE-oriented valleys, with bottom elevation from ∼200 m a.s.l. to sea level. The study area shows a gentle slope gradient (∼5–10%) corresponding to the top of the tabular reliefs, with some steep to sub-vertical scarps (up to >80%) along the edge of the plateau and coastline, especially on the NW-facing slopes (b, c).
Figure 4. Orographical and hydrographical setting of the Feltrino Stream basin (purple line): (a) elevation map; (b) slope map; (c) aspect map; (d) hierarchized hydrographic network map.
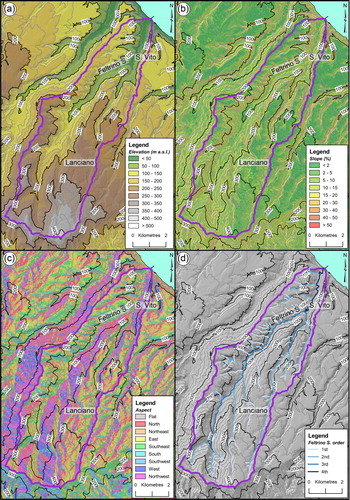
The general hydrography features a basin ∼50 km2 wide, with the main river ∼19 km long. It is a fourth order basin in which the drainage patterns are from subparallel to trellis (from N–S to NE–SW-oriented; CitationTwidale, 2004; d).
4.3. Main map
The enclosed map shows the existing geomorphological data, the new data collected in this work, and the assessment of the critical areas of the Feltrino Stream basin (main map, 1:20,000 scale) and the urban area of Lanciano (inset, 1:8,000 scale). These results support the setting of the rainfall, weather and hydrometric gauges and the EWS.
4.3.1. Previous data
4.3.1.1. Geomorphological map
The geomorphological features are summarized in the central-upper inset on the main map. The lithology of the study area features a bedrock composed of clay, sand-sandstone and conglomerate deposits belonging to Early Pleistocene marine sequences. The older clay unit features the valley bottoms and sides. The sand-sandstone unit is exposed on the upper valley sides and along the scarp at the edges of the mesa-plateau reliefs. The conglomeratic unit is present on the top of the tabular reliefs. The superficial deposits are mainly composed of colluvial deposits, widespread over the whole basin, and related to the weathering of structural landforms. Backfill deposits are frequent in urban areas, especially in the Lanciano area, where they fill entire minor valleys with thicknesses of up to tens of meters (CitationPiacentini et al., 2015, Citation2020).
Regarding the geomorphological landforms, the gravity-induced landforms are the most frequent and include a large number of landslides (i.e. rotational and translational landslides, shallow landslides, complex and deep-seated landslides and, less frequently, rock falls), with associated scarps in active, dormant or inactive states of activity. Other geomorphological elements are related to structural landforms (i.e. mesa and plateau, rimmed by sub-vertical scarps) and fluvial landforms (i.e. fluvial valleys and incised channels). In recent decades, the Feltrino Stream basin has been subjected to notable anthropogenic activities related to farming and the building of infrastructure (CitationPiacentini et al., 2015).
4.3.1.2. Landslide and flood hazard map
The collected data regarding landslide and flood hazards are summarized in the central-upper inset on the main map. The official landslide hazard map (from CitationAbruzzo Region, 2008b, Citation2019; CitationTrigila et al., 2018) shows a complex and wide hazard pattern over the entire basin, especially in the steep slope of the main river valley. The highest values of hazard are found on the right valley side, due to the steeper and NW-facing slopes affected by large active landslides. The attention areas for scarps are at the edges of the mesa and plateau reliefs. Furthermore, a large number of landslide events were reported in the Feltrino Stream basin and especially along the slopes of the urban area of Lanciano (CitationGNDCI, 1994; CitationMunicipality of Lanciano, 2008, Citation2015, Citation2019). One of the most recent events in the area, which induced several landslides, occurred in March 2015: after a cumulative rainfall of ∼110 mm in 24 h and ∼190 mm in one week, more than 70 landslide events were reported in the study area (CitationPiacentini et al., 2020). Furthermore, in the landslide events database, some collapses of the historic center of Lanciano were also included, which occurred due to collapses of the thick (>20 m) backfill deposits filling ancient valleys in the historical urban area (CitationMunicipality of Lanciano, 2019).
The official flood hazard map (CitationAbruzzo Region, 2008c; CitationTrigila et al., 2018) shows high values of hazard, especially in the final stretch of the Feltrino Stream near the sea mouth; here, several flood events were also reported. Several flooding events are also reported in the basin (CitationGNDCI, 1994; CitationMunicipality of Lanciano, 2008, Citation2015, Citation2019).
4.3.2. Field work
4.3.2.1. Hydrography investigation
For the entire basin (upper right inset in the map) and especially for the urban area of Lanciano (1:8,000, right inset map), the hydrographic network was analyzed in detail. The Feltrino Stream catchment area was divided into 15 sub-basins (1–15 in the map), with the relief ranging from ∼290 to ∼20 m and low values of average slope (3–8%, with the highest values >10%). For each of them, specifically in the urban area of Lanciano, the detailed field survey of the actual characteristics of the drainage allowed the definition of the superficial urban drainage network (natural or engineered). The underground drainage network was also investigated since, in recent historical times (first half of the 1900s), some secondary and minor valleys have been completely covered by backfill deposits and channeled. This analysis made it possible to map these features and understand the complex interaction between the surface and underground drainage networks (e.g. sub-basins 14 and 8 are connected through an underground channel, which flows below sub-basins 11 and 12), and to analyze those areas that are often subject to flooding and those that can be affected by these events. Indeed, several cases of flooded areas were also reported in the urban area of Lanciano. One of the most recent and biggest cases of flash pluvial flood in the area occurred in June 2018 when, after an intense (∼55 mm in 1 h) but short (4 h for a total of 75 mm) rainfall event, a huge number of underpasses and roads were flooded, with some cars being stranded. This specific analysis allowed us to integrate the official flood hazard map (CitationAbruzzo Region, 2008c; CitationTrigila et al., 2018) at an urban scale and to define critical areas in the Lanciano urban area.
4.3.3. Landslide and flood critical areas
The critical areas were assessed for the entire basin (main map) and the urban area of Lanciano (lower-right inset) by the overlaying of pre-existing geological, geomorphological and hazard data and new detailed field-based maps of geomorphological-hydrographical features, through specific geomorphology-based matrices (tables in the map).
The high landslide-critical areas are located along the steepest scarps (with critical areas for scarps), which border the sub-flat reliefs of the study area, and especially on the right valley side, where historical and recent landslide events have been documented. The urban area of Lanciano is rimmed in its western and northern parts by high landslide-critical areas. Low and moderate critical areas for landslides are present along the natural and less steep slopes of the river valleys (e.g. the left valley side). Critical areas for cavities are present only in the historic center of Lanciano.
The high flood-critical areas are located along the main watercourse of the Feltrino Stream in its lowest and widest part, near the sea mouth, where several flood events have been reported in recent historical times. High flood-critical areas are also located in the Lanciano urban area (lower-right inset) in the main depressed areas, as determined from the reports of urban flooded areas and the field investigation of the urban drainage network. The moderate critical areas for floods are located along the main streams and anthropic drainage lines, while the low critical areas are found along the secondary valleys.
5. Discussion and conclusions
In urban areas and small catchments, the risk presented by pluvial flooding and related geomorphological (i.e. landslide) hazards have emerged as a critical issue, and the risk is expected to increase in frequency, severity and impact. Flash pluvial floods have a very fast onset, with a relatively short spike and rapid withdrawal, and possibly related to engineered drainage systems, which may not support occasional discharge peaks during heavy rainfall. In order to minimize the risk to human life and reduce the economic consequences, the proper planning for and management of natural disasters are essential, as are adequate and smart adaptation measures to reduce the negative impact on society (e.g. CitationBathrellos et al., 2017; CitationBlöschl et al., 2019; CitationRosenzweig et al., 2018) For this purpose, EWSs – especially if strongly geomorphology-based – are recognized worldwide as one of the best tools for risk prevention, mitigation, preparedness and response strategies (CitationCools et al., 2016; CitationEEA, 2017; CitationMitchell et al., 2010; CitationSahani et al., 2019; CitationUNISDR, 2017).
The Feltrino Stream and Lanciano are examples of basins and urban areas prone to rainfall-induced landslides and flash pluvial floods. This is due to heavy rainfall events on soft clay–sand–sandstone bedrock combined with increasing urbanization and related land-use change, which has induced strong landscape and hydrography changes. In this context, the determination of landslide–flood-critical areas through detailed geomorphological mapping was fundamental to creating an adaptation system to reduce the negative impact of heavy rainfall on society. It was based on an EWS set and realized according to the specific geomorphological and hydrographic features of the area.
In this paper, a multidisciplinary approach for the assessment and mapping of landslide- and flood-critical areas is presented as the basis for the realization of the EWS. This approach includes an integrated geomorphological basin-scale analysis based on (1) the official landslide–flood hazard, (2) field geomorphological mapping, (3) an assessment of landslide- and flood-critical areas, and (4) an integrated geodatabase for the management of collected data and of the critical areas. The landslide-critical areas include five different classes (low, moderate, high critical areas, plus critical areas for scarps and cavities), while the flood-critical areas include three different classes (low, moderate, and high). This result was the basis for the implementation of a local adaptation system in the urban area of Lanciano and, specifically, an urban IOT-based EWS and communication system. This system is composed of a network of nine gauges and stations (i.e. three weather stations – WS; one rainfall gauge – RS; two hydrometers – Hg; and three 2-level flood sensors – LFS) and a related communication system (one gateway – Gw; and ). It is a threshold-based urban alert system based on the real-time records of the gauges, on a web-cloud gauge network, and a communication system and incorporates the information derived from the regional forecast-based warning system (Allarmeteo) (for details, see CitationPiacentini et al., 2020). Finally, it is aimed at supporting real-time communication for civil protection purposes in heavy event management, risk preparedness and response (before, during and after an event), and providing direct alerts and warnings to citizens, through the support of a specific application for smartphones.
Figure 5. Location of the gauges network for the urban Early Warning System (EWS) of Lanciano.
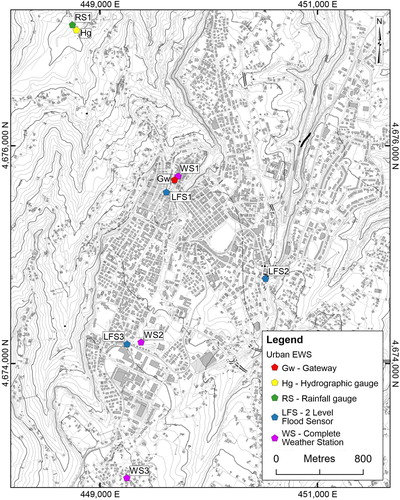
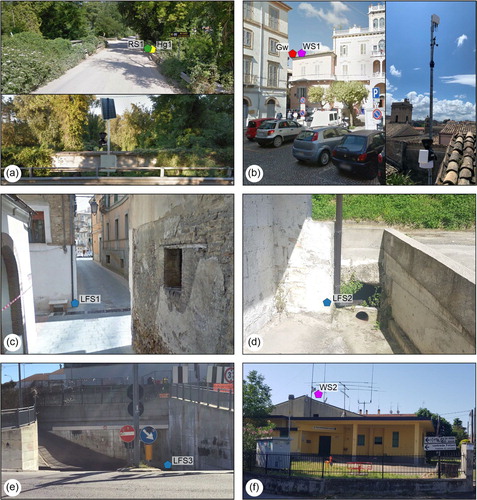
Figure 6. Main sensors composing the urban EWS of Lanciano. (a) Rainfall and hydrographic gauge over the watercourse of the Feltrino Stream, in the northern part of Lanciano; (b) Gateway and complete weather station on the roof of the Lanciano city hall; (c) Ultrasonic Level Sensor in correspondence of a depression in the historical center of Lanciano; (d) Ultrasonic Level Sensor near a commercial area in the eastern part of Lanciano; (e) Ultrasonic Level Sensor in correspondence of an underbridge depression near the industrial area, in the southern part of Lanciano; (f) Complete weather station on the roof of a municipal building, in the southern part of Lanciano.
Software
The vector/raster data and main map were managed using QGIS 3.10 A Coruna® and ESRI ArcMap® 10.6, with final editing performed using Corel Draw 2019®.
TJOM_1819903_Main Map.pdf
Download PDF (47.9 MB)Acknowledgments
The authors are grateful to the reviewers George Bathrellos, Francesco Faccini, and Mike Shand for the precious comments and suggestions that greatly improved the manuscript and map. The authors wish to thank the Cartographic Office of the Abruzzo Region for providing the topographic data, 10 m Digital Terrain Model, aerial photos and orthophotos used for this work by means of the Open Geodata Portal (http://opendata.regione.abruzzo.it/); thanks also go to the Ministero dell’Ambiente e della Tutela del Territorio e del Mare (http://www.minambiente.it/) for providing the LiDAR data. The rainfall data were provided by the Functional Center and Hydrographic Office of the Abruzzo Region (Centro Funzionale e Ufficio Idrografico Regione Abruzzo).
Disclosure statement
No potential conflict of interest was reported by the authors.
Additional information
Funding
References
- Abruzzo Region. (2007a). 1:1:25,000 scale regional topographic maps. Struttura Speciale di Supporto Sistema Informativo Regione Abruzzo. Retrieved May 15, 2019, from http://opendata.regione.abruzzo.it/content/dbtr-regioneabruzzo-scala-125000-edizione-2007
- Abruzzo Region. (2007b). 1:10,000 scale regional topographic maps. Struttura Speciale di Supporto Sistema Informativo Regione Abruzzo. Retrieved May 15, 2019, from http://opendata.regione.abruzzo.it/content/dbtr-regione-abruzzo-scala-110000-edizione-2007-formato-shp
- Abruzzo Region. (2007c). 1:5,000 scale regional technical maps. Struttura Speciale di Supporto Sistema Informativo Regione Abruzzo. Retrieved May 15, 2019, from http://opendata.regione.abruzzo.it/content/dbtr-regione-abruzzoscala-15000-edizione-2007-formato-shp
- Abruzzo Region. (2008a). Piano Stralcio di Bacino per l’Assetto Idrogeologico dei Bacini di Rilievo Regionale Abruzzesi e del Bacino del Fiume Sangro. (L.R. 18.05 1989 n.81 e L. 24.08.2001) – Carta geomorfologica – scala 1:25,000. Retrieved May 21, 2019, from http://autoritabacini.regione.abruzzo.it/index.php/carta-geomorfologica-pai
- Abruzzo Region. (2008b). Piano Stralcio di Bacino per l’Assetto Idrogeologico dei Bacini di Rilievo Regionale Abruzzesi e del Bacino del Fiume Sangro. (L.R. 18.05 1989 n.81 e L. 24.08.2001) – Carta delle Pericolosità PAI – scala 1:25,000. Retrieved May 21, 2019, from http://autoritabacini.regione.abruzzo.it/index.php/carta-delle-pericolosita-pai
- Abruzzo Region. (2008c). Piano Stralcio di Difesa dalle Alluvioni dei Bacini di Rilievo Regionale Abruzzesi e del Bacino del Fiume Sangro. (L.R. 18.05 1989 n.183 e L. 10.12.2010) – Carta delle Pericolosità PSDA – scala 1:10,000. Retrieved May 21, 2019, from http://autoritabacini.regione.abruzzo.it/index.php/carta-della-pericolosita-psda
- Abruzzo Region. (2010). 1:5,000 scale orthophotos color images. Struttura Speciale di Supporto Sistema Informativo Regione Abruzzo. Retrieved May 21, 2019, from http://opendata.regione.abruzzo.it/content/ortofoto-digitale-della-provincia-di-laquila
- Abruzzo Region. (2017). Contratto di Fiume (River Contract) del Feltrino – Accordo di Programmazione Negoziata (D.G.R. 314 – 29.4.2014). Retrieved, 11 June, 2019 from https://www.contrattodifiumefeltrino.net/documenti/
- Abruzzo Region. (2019). Approvazione della I variante parziale del piano stralcio di bacino per l’assetto idrogeologico - Fenomeni gravitativi e Processi erosivi, riferito ai bacini di rilievo regionale dell’Abruzzo e al territorio regionale ricompreso nel bacino interregionale del Fiume Sangro (D.P.C. 19 giugno 2019). Retrieved May 21, 2019, from http://autoritabacini.regione.abruzzo.it/index.php/pai
- Acosta-Coll, M., Ballester-Merelo, F., & Martínez-Peiró, M. (2018). Early warning system for detection of urban pluvial flooding hazard levels in an ungauged basin. Natural Hazards, 92(2), 1237–1265. https://doi.org/10.1007/s11069-018-3249-4
- Alfieri, L., Berenguer, M., Knechtl, V., Liechti, K., Sempere-Torres, D., & Zappa, M. (2015). Flash flood forecasting based on rainfall thresholds. In Q. Duan, F. Pappenberger, J. Thielen, A. Wood, H. Cloke, & J. Schaake (Eds.), Handbook of Hydrometeorological Ensemble Forecasting (pp. 1–38). Springer. ISBN 978-3-642-40457-3.
- Alvioli, M., Melillo, M., Guzzetti, F., Rossi, M., Palazzi, E., von Hardenberg, J., Brunetti, M. T., & Peruccacci, S. (2018). Implications of climate change on landslide hazard in Central Italy. Science of the Total Environment, 630, 1528–1543. https://doi.org/10.1016/j.scitotenv.2018.02.315
- Artoni, A. (2013). The Pliocene-Pleistocene stratigraphic and tectonic evolution of the central sector of the Western Periadriatic Basin of Italy. Marine and Petroleum Geology, 42, 82–106. https://doi.org/10.1016/j.marpetgeo.2012.10.005
- Azid, S., Sharma, B., Raghuwaiya, K., Chand, A., Prasad, S., & Jacquier, A. (2015). SMS based flood monitoring and early warning system. ARPN Journal of Engineering and Applied Sciences, 10(15), 6387–6391.
- Bathrellos, G. D., Karymbalis, E., Skilodimou, H. D., Gaki-Papanastassiou, K., & Baltas, E. A. (2016). Urban flood hazard assessment in the basin of Athens Metropolitan city, Greece. Environmental Earth Sciences, 75(4), 319. https://doi.org/10.1007/s12665-015-5157-1
- Bathrellos, G. D., Skilodimou, H. D., Chousianitis, K., Youssef, A. M., & Pradhan, B. (2017). Suitability estimation for urban development using multi-hazard assessment map. Science of the Total Environment, 575, 119–134. https://doi.org/10.1016/j.scitotenv.2016.10.025
- Bathrellos, G. D., Gaki-Papanastassiou, K., Skilodimou, H. D., Papanastassiou, D., & Chousianitis, K. G. (2012). Potential suitability for urban planning and industry development by using natural hazard maps and geological—geomorphological parameters. Environmental Earth Sciences, 66(2), 537–548. https://doi.org/10.1007/s12665-011-1263-x
- Bigi, S., Conti, A., Casero, P., Ruggiero, L., Recanati, R., & Lipparini, L. (2013). Geological model of the central Periadriatic basin (Apennines, Italy). Marine and Petroleum Geology, 42, 107–121. https://doi.org/10.1016/j.marpetgeo.2012.07.005
- Blöschl, G., Hall, J., Viglione, A., Perdigão, R. A. P., Parajka, J., Merz, B., Lun, D., Arheimer, B., Aronica, G. T., Bilibashi, A., Boháč, M., Bonacci, O., Borga, M., Čanjevac, I., Castellarin, A., Chirico, G. B., Claps, P., Frolova, N., Ganora, D., … Živković, N. (2019). Changing climate both increases and decreases European river floods. Nature, 573(7772), 108–111. https://doi.org/10.1038/s41586-019-1495-6
- Bozzano, F., Carabella, C., De Pari, P., Discenza, M. E., Fantucci, R., Mazzanti, P., Miccadei, E., Rocca, A., Romano, S., & Sciarra, N. (2020). Geological and geomorphological analysis of a complex landslides system: The case of San Martino sulla Marruccina (Abruzzo, Central Italy). Journal of Maps, 16(2), 126–136. https://doi.org/10.1080/17445647.2019.1702596
- Brandolini, P., Cevasco, A., Firpo, M., Robbiano, A., & Sacchini, A. (2012). Geo-hydrological risk management for civil protection purposes in the urban area of Genoa (Liguria, NW Italy). Natural Hazards and Earth System Sciences, 12(4), 943–959. https://doi.org/10.5194/nhess-12-943-2012
- Brunetti, M. T., Peruccacci, S., Rossi, M., Luciani, S., Valigi, D., & Guzzetti, F. (2010). Rainfall thresholds for the possible occurrence of landslides in Italy. Natural Hazards and Earth System Sciences, 10(3), 447–458. https://doi.org/10.5194/nhess-10-447-2010
- Calista, M., Mascioli, F., Menna, V., Miccadei, E., & Piacentini, T. (2019). Recent geomorphological evolution and 3d numerical modelling of soft clastic rock cliffs in the mid-western adriatic sea (Abruzzo, Italy). Geosciences (Switzerland), 9(7), Article 309. https://doi.org/10.3390/geosciences9070309
- Calista, M., Miccadei, E., Pasculli, A., Piacentini, T., Sciarra, M., & Sciarra, N. (2016). Geomorphological features of the Montebello sul Sangro large landslide (Abruzzo, Central Italy). Journal of Maps, 12(5), 882–891. https://doi.org/10.1080/17445647.2015.1095134
- Carabella, C., Buccolini, M., Galli, L., Miccadei, E., Paglia, G., & Piacentini, T. (2020). Geomorphological analysis of drainage changes in the NE Apennines piedmont area: The case of the middle Tavo River bend (Abruzzo, Central Italy). Journal of Maps, 16(2), 222–235. https://doi.org/10.1080/17445647.2020.1726833
- Cevasco, A., Diodato, N., Revellino, P., Fiorillo, F., Grelle, G., & Guadagno, F. M. (2015). Storminess and geo-hydrological events affecting small coastal basins in a terraced Mediterranean environment. Science of the Total Environment, 532, 208–219. https://doi.org/10.1016/j.scitotenv.2015.06.017
- Chen, Y., Zhou, H., Zhang, H., Du, G., & Zhou, J. (2015). Urban flood risk warning under rapid urbanization. Environmental Research, 139, 3–10. https://doi.org/10.1016/j.envres.2015.02.028
- Chikalamo, E. E., Mavrouli, O. C., Ettema, J., van Westen, C. J., Muntohar, A. S., & Mustofa, A. (2020). Satellite-derived rainfall thresholds for landslide early warning in Bogowonto catchment, Central Java, Indonesia. International Journal of Applied Earth Observation and Geoinformation, 89, Article 102093. https://doi.org/10.1016/j.jag.2020.102093
- Cools, J., Innocenti, D., & O’Brien, S. (2016). Lessons from flood early warning systems. Environmental Science and Policy, 58, 117–122. https://doi.org/10.1016/j.envsci.2016.01.006
- Corral, C., Berenguer, M., Sempere-Torres, D., Poletti, L., Silvestro, F., & Rebora, N. (2019). Comparison of two early warning systems for regional flash flood hazard forecasting. Journal of Hydrology, 572, 603–619. https://doi.org/10.1016/j.jhydrol.2019.03.026
- D’Alessandro, L., Miccadei, E., & Piacentini, T. (2003). Morphostructural elements of central-eastern Abruzzi: Contributions to the study of the role of tectonics on the morphogenesis of the Apennine chain. Quaternary International, 101-102(1), 115–124. https://doi.org/10.1016/S1040-6182(02)00094-0
- D’Alessandro, L., Miccadei, E., & Piacentini, T. (2008). Morphotectonic study of the lower Sangro River valley (Abruzzi, Central Italy). Geomorphology, 102(1), 145–158. https://doi.org/10.1016/j.geomorph.2007.06.019
- Di Lena, B., Antenucci, F., & Mariani, L. (2012). Space and time evolution of the Abruzzo precipitation. Italian Journal of Agrometeorology, 1, 5–20.
- Di Salvo, C., Ciotoli, G., Pennica, F., & Cavinato, G. P. (2017). Pluvial flood hazard in the city of Rome (Italy). Journal of Maps, 13(2), 545–553. https://doi.org/10.1080/17445647.2017.1333968
- EEA. (2017). Climate change adaptation and disaster risk reduction in Europe. https://doi.org/10.2800/938195
- Eeyles, N. (1997). Environmental geology of urban areas (GEOtext series). Geological Association of Canada.
- ESRI. (2018). ArcGIS Desktop: Release 10.6. Environmental Systems Research Institute.
- Ferretti, R., Lombardi, A., Tomassetti, B., Sangelantoni, L., Colaiuda, V., Mazzarella, V., Maiello, I., Verdecchia, M., & Redaelli, G. (2019). Regional ensemble forecast for early warning system over small Apennine catchments on Central Italy. Hydrology and Earth System Sciences Discussions, 1–25. https://doi.org/10.5194/hess-2019-223
- Froude, M. J., & Petley, D. N. (2018). Global fatal landslide occurrence from 2004 to 2016. Natural Hazards and Earth System Sciences, 18(8), 2161–2181. https://doi.org/10.5194/nhess-18-2161-2018
- García-Soriano, D., Quesada-Román, A., & Zamorano-Orozco, J. J. (2020). Geomorphological hazards susceptibility in high-density urban areas: A case study of Mexico City. Journal of South American Earth Sciences, 102, Article 102667. https://doi.org/10.1016/j.jsames.2020.102667
- GNDCI. (1994). AVI Project. Retrieved July 10, 2019, from http://wwwdb.gndci.cnr.it/php2/avi/frane_comune.php?lingua=it
- Gonçalves, P., Marafuz, I., & Gomes, A. (2015). Flood hazard, Santa Cruz do Bispo sector, Leça River, Portugal: A methodological contribution to improve land use planning. Journal of Maps, 11(5), 760–771. https://doi.org/10.1080/17445647.2014.974226
- González-Cao, J., García-Feal, O., Fernández-Nóvoa, D., Domínguez-Alonso, J. M., & Gómez-Gesteira, M. (2019). Towards an automatic early warning system of flood hazards based on precipitation forecast: The case of the Miño River (NW Spain). Natural Hazards and Earth System Sciences, 19(11), 2583–2595. https://doi.org/10.5194/nhess-19-2583-2019
- Groisman, P. Y., Knight, R. W., Easterling, D. R., Karl, T. R., Hegerl, G. C., & Razuvaev, V. N. (2005). Trends in intense precipitation in the climate record. Journal of Climate, 18(9), 1326–1350. https://doi.org/10.1175/JCLI3339.1
- Guerriero, L., Focareta, M., Fusco, G., Rabuano, R., Guadagno, F. M., & Revellino, P. (2018). Flood hazard of major river segments, benevento province, southern Italy. Journal of Maps, 14(2), 597–606. https://doi.org/10.1080/17445647.2018.1526718
- Harilal, G. T., Madhu, D., Ramesh, M. V., & Pullarkatt, D. (2019). Towards establishing rainfall thresholds for a real-time landslide early warning system in Sikkim, India. Landslides, 16(12), 2395–2408. https://doi.org/10.1007/s10346-019-01244-1
- Hofmann, J., & Schüttrumpf, H. (2019). Risk-based early warning system for pluvial flash floods: Approaches and Foundations. Geosciences, 9(3), Article 127. https://doi.org/10.3390/geosciences9030127
- ISPRA. (2010). Carta Geologica d’Italia alla scala 1:50,000, Foglio 361 ‘chieti’. Servizio Geologico d’Italia. Retrieved July 21, 2019, from http://www.isprambiente.gov.it/%0AMedia/carg/361_CHIETI/Foglio.html
- Jha, A. K., Bloch, R., & Lamond, J. (2012). Cities and flooding: A guide to integrated urban flood risk management for the 21st Century. The World Bank. doi:10.1596/978-0-8213-8866-2.
- Krzhizhanovskaya, V. V., Shirshov, G. S., Melnikova, N. B., Belleman, R. G., Rusadi, F. I., Broekhuijsen, B. J., Gouldby, B. P., Lhomme, J., Balis, B., Bubak, M., Pyayt, A. L., Mokhov, I. I., Ozhigin, A. V., Lang, B., & Meijer, R. J. (2011). Flood early warning system: Design, implementation and computational modules. Procedia Computer Science, 4, 106–115. https://doi.org/10.1016/j.procs.2011.04.012
- Lin, L., Wu, Z., & Liang, Q. (2019). Urban flood susceptibility analysis using a GIS-based multi-criteria analysis framework. Natural Hazards, 97(2), 455–475. https://doi.org/10.1007/s11069-019-03615-2
- Ma, M., Zhang, J., Su, H., Wang, D., & Wang, Z. (2019). Update of early warning indicators of flash floods: A case study of Hunjiang District, Northeastern China. Water (Switzerland), 11(2), Article 314. https://doi.org/10.3390/w11020314
- Miccadei, E., Piacentini, T., & Buccolini, M. (2017). Long-term geomorphological evolution in the Abruzzo area, central Italy: Twenty years of research. Geologica Carpathica, 68(1), 19–28. https://doi.org/10.1515/geoca-2017-0002
- Miccadei, E., Piacentini, T., Gerbasi, F., & Daverio, F. (2012). Morphotectonic map of the Osento River basin (Abruzzo, Italy), scale 1:30,000. Journal of Maps, 8(1), 62–73. https://doi.org/10.1080/17445647.2012.668764
- Mitchell, T., Ibrahim, M., Harris, K., Hedger, M., Polack, E., Ahmed, A., Hall, N., Hawrylyshyn, K., Nightingale, K., Onyango, M., Adow, M., Sajjad, M. S. (2010). Climate smart disaster risk management, Strengthening climate resilience. IDS.
- Municipality of Lanciano. (2008). Relazione geologica a corredo del Piano Regolatore Generale. Retrieved May 23, 2019 from http://www.lanciano.eu/c069046/zf/index.php/trasparenza/index/index/categoria/475
- Municipality of Lanciano. (2015). Studio di Microzonazione Sismica di I livello del Comune di Lanciano, ai sensi dell’Art.11 della Legge 24 Giugno 2009, n. 77 (p. 92). p. 92. Retrieved May 23, 2019 from http://www.lanciano.eu/c069046/zf/index.php/trasparenza/index/index/categoria/262
- Municipality of Lanciano. (2019). Schede di censimento e monitoraggio preventivo delle aree critiche per rischio idrogeologico, rilevamento danni e criticità. Comune di Lanciano, Ufficio Lavori Pubblici, Servizio Protezione Civile.
- Napolitano, E., Marchesini, I., Salvati, P., Donnini, M., Bianchi, C., & Guzzetti, F. (2018). LAND-deFeND – An innovative database structure for landslides and floods and their consequences. Journal of Environmental Management, 207, 203–218. https://doi.org/10.1016/j.jenvman.2017.11.022
- Nirupama, N., & Simonovic, S. P. (2007). Increase of flood risk due to urbanisation: A Canadian example. Natural Hazards, 40(1), 25–41. https://doi.org/10.1007/s11069-006-0003-0
- Ori, G., Serafini, G., Visentin, C., Ricci Lucchi, F., Casnedi, R., Colalongo, M. L., & Mosna, S. (1991). The Pliocene-Pleistocene Adriatic foredeep (Marche and Abruzzo, Italy): an integrated approach to surface and subsurface geology. 3rd e.A.P.G. Conference, Adriatic Foredeep Field Trip, Guide Book, 85. May 26th–30th, 1991, Firenze, Italy.
- Paliaga, G., Faccini, F., Luino, F., & Turconi, L. (2019). A spatial multicriteria prioritizing approach for geo-hydrological risk mitigation planning in small and densely urbanized Mediterranean basins. Natural Hazards and Earth System Sciences, 19(1), 53–69. https://doi.org/10.5194/nhess-19-53-2019
- Parker, D. J. (2017). Flood warning systems and their performance. Oxford Research Encyclopedia of Natural Hazard Science. https://doi.org/10.1093/acrefore/9780199389407.013.84
- Peel, M. C., Finlayson, B. L., & McMahon, T. A. (2007). Updated world map of the Köppen-Geiger climate classification. Spatial data access tool (SDAT)OGC standards-based geospatial Data visualization/download. Hydrology and Earth System Sciences, 11(5), 1633–1644. https://doi.org/10.5194/hess-11-1633-2007
- Piacentini, T., Carabella, C., Boccabella, F., Ferrante, S., Gregori, C., Mancinelli, V., Miccadei, E., et al. (2020). Flood–landslide critical areas in small catchments for civil protection purposes and early warning systems: The case of the Feltrino Stream and the Lanciano urban area (Abruzzo, Central Italy). Water (Switzerland), 12(8), Article 2228. https://doi.org/10.3390/w12082228
- Piacentini, T., Galli, A., Marsala, V., & Miccadei, E. (2018). Analysis of soil erosion induced by heavy rainfall: A case study from the NE Abruzzo Hills Area in Central Italy. Water (Switzerland), 10(10), Article 1314. https://doi.org/10.3390/w10101314
- Piacentini, T., Sciarra, M., Miccadei, E., & Urbano, T. (2015). Near-surface deposits and hillslope evolution of the Adriatic piedmont of the Central Apennines (Feltrino Stream basin and minor coastal basins, Abruzzo, Italy). Journal of Maps, 11(2), 299–313. https://doi.org/10.1080/17445647.2014.949884
- QGIS Development Team. (2019). QGIS Geographic information system, Version 3.10 “A Coruna”. Open Source Geospatial Foundation Project. http://qgis.osgeo.org
- Quesada-Román, A., Villalobos-Portilla, E., & Campos-Durán, D. (2020). Hydrometeorological disasters in urban areas of Costa Rica, Central America. Environmental Hazards. https://doi.org/10.1080/17477891.2020.1791034
- Ramos, H. M., Pérez-Sánchez, M., Franco, A. B., & López-Jiménez, P. A. (2017). Urban floods adaptation and sustainable drainage measures. Fluids, 2(4). https://doi.org/10.3390/fluids2040061
- Roccati, A., Mandarino, A., Perasso, L., Robbiano, A., Luino, F., & Faccini, F. (2020). Large-scale geomorphology of the Entella River floodplain (Italy) for coastal urban areas management. Journal of Maps. https://doi.org/10.1080/17445647.2020.1738281
- Rosenzweig, B. R., McPhillips, L., Chang, H., Cheng, C., Welty, C., Matsler, M., Iwaniec, D., & Davidson, C. I. (2018). Pluvial flood risk and opportunities for resilience. WIRES Water, 5(6), Article e1302. https://doi.org/10.1002/wat2.1302
- Rosi, A., Lagomarsino, D., Rossi, G., Segoni, S., Battistini, A., & Casagli, N. (2015). Updating ews rainfall thresholds for the triggering of landslides. Natural Hazards, 78(1), 297–308. https://doi.org/10.1007/s11069-015-1717-7
- Rosi, A., Segoni, S., Battistini, A., Rossi, G., Catani, F., & Casagli, N. (2017). Definition of a fully functional EWS based on rainfall thresholds, the case of study of Tuscany Region. In M. Mikos (Ed.), Advancing Culture of Living with landslides (pp. 169–174). https://doi.org/10.1007/978-3-319-53487-9_19
- Sahani, J., Kumar, P., Debele, S., Spyrou, C., Loupis, M., Aragão, L., Porcù, F., Shah, M. A. R., & Di Sabatino, S. (2019). Hydro-meteorological risk assessment methods and management by nature-based solutions. Science of the Total Environment, 696, Article 133936. https://doi.org/10.1016/j.scitotenv.2019.133936
- Salvati, P., Bianchi, C., Fiorucci, F., Giostrella, P., Marchesini, I., & Guzzetti, F. (2014). Perception of flood and landslide risk in Italy: A preliminary analysis. Natural Hazards and Earth System Sciences, 14(9), 2589–2603. https://doi.org/10.5194/nhess-14-2589-2014
- Segoni, S., Piciullo, L., & Gariano, S. L. (2018). A review of the recent literature on rainfall thresholds for landslide occurrence. Landslides, 15(8), 1483–1501. https://doi.org/10.1007/s10346-018-0966-4
- Sharma, A., Wasko, C., & Lettenmaier, D. P. (2018). If precipitation extremes are increasing, why aren’t floods? Water Resources Research, 54(11), 8545–8551. https://doi.org/10.1029/2018WR023749
- Strahler, A. N. (1952). Dynamic basis of geomorphology. Geological Society of America Bulletin, 63(9), 923–938. https://doi.org/10.1130/0016-7606(1952)63[923:DBOG]2.0.CO;2
- Strahler, A. N. (1957). Quantitative classification of watershed geomorphology. Transactions, American Geophysical Union, 38(6), 913–920. https://doi.org/10.1029/TR038i006p00913
- Teng, J., Jakeman, A. J., Vaze, J., Croke, B. F. W., Dutta, D., & Kim, S. (2017). Flood inundation modelling: A review of methods, recent advances and uncertainty analysis. Environmental Modelling and Software, 90, 201–216. https://doi.org/10.1016/j.envsoft.2017.01.006
- Toda, L. L., Yokingco, J. C. E., Paringit, E. C., & Lasco, R. D. (2017). A LiDAR-based flood modelling approach for mapping rice cultivation areas in Apalit, Pampanga. Applied Geography, 80, 34–47. https://doi.org/10.1016/j.apgeog.2016.12.020
- Trigila, A., Iadanza, C., Bussettini, M., & Lastoria, B. (2018). Dissesto idrogeologico in Italia: pericolosità e indicatori di rischio - Edizione 2018. In ISPRA, Rapporti 287/2018. https://doi.org/ISBN 978-88-448-0751-1
- Twidale, C. R. (2004). River patterns and their meaning. Earth-Science Reviews, 67(3–4), 159–218. https://doi.org/10.1016/j.earscirev.2004.03.001
- UNISDR. (2017). National Disaster Risk Assessment (C. O’Shaughnessy, ed.). Retrieved from https://www.shareweb.ch/site/DRR/Documents/Types of activity/Risk Assessments/UNISDR-NationalDisasterRiskAssessment-2017.pdf
- Visser, F. (2014). Rapid mapping of urban development from historic ordnance survey maps: An application for pluvial flood risk in Worcester. Journal of Maps, 10(2), 276–288. https://doi.org/10.1080/17445647.2014.893847