
ABSTRACT
The aim of the paper is to reconstruct differences between the paleotopography and contemporary topography of the historic centre of Krakow city, Poland, during the last millennium. The paleotopography was reconstructed using published contour-line maps based on archaeological and geoengineering investigations and showing the roof of in situ fossil soil. The preliminary contour-line map represented a digital elevation model (DEM) base map. A DEM from aerial laser scanning (ALS DEM) shows the contemporary topography of Krakow city centre. The application of selected morphometric indices makes it possible to quantitatively describe changes in the spatial dimension with regard to altitude, relative heights, slope, and aspect classes. The analysis of the changes in the values of the elements of topography studied shows that, at the scale of the whole study area, a trend to flattening occurs, however this trend is locally balanced or overridden by an increase of surface unevenness.
1. Introduction
In geomorphology more and more attention has recently been paid to changes in urban topography, especially in the case of town centres with a long history. Changes in urban topography are defined as the building over and flattening of the land surface due to the increase of anthropogenic deposits, sometimes with the participation of natural sediments, and also as ground surface lowering caused, for example, by earthworks (CitationDall’Aglio et al., 2017; CitationBrandolini et al., 2017, Citation2018, Citation2020; CitationDel Monte et al., 2016, CitationKaniecki, 2013; CitationŁajczak & Zarychta, 2020; CitationMandarino et al., 2020; CitationPica et al., 2017; CitationReynard et al., 2017; CitationZarychta et al., 2018; CitationZwoliński et al., 2017). Less frequently, spatial differentiation of the thickness of anthropogenic deposits in old towns is the subject of study (CitationKaniecki, 2013; CitationLuberti, 2018; CitationLuberti et al., 2019; CitationMolewski & Juśkiewicz, 2014; CitationPröschel & Lehmkuhl, 2019). Important information is obtained from investigations located at the margin of archaeology, geomorphology, and geology, which indicates (based on studies of the stratigraphy of cultural deposits and natural sediments) the rate of change in topography of some towns (CitationBrandolini et al., 2018; CitationCampagna & Scardozzi, 2014; CitationCarver, 1983; CitationMozzi et al., 2018; CitationRadwański, 1972, Citation1975; CitationVogel et al., 2011).
Determination of the changes in topography of historic town centres depends most of all on the precise determination of the paleotopography of these areas before the rapid growth of cultural deposits. The paleotopography is determined on the basis of the calculation of the coordinates [m a.s.l.] of the roof of in situ paleosoils at the largest possible number of reference points. Geophysical and geoelectric methods, such as ground penetrating radar, are applied in such investigations. They make it possible to determine the geology of the shallow substratum and the depth of the paleosoil roof in densely built up centres of old towns (CitationRapp & Hill, 1999). However, more reliable information is obtained from archaeological investigations (CitationCarver, 1983; CitationLuberti, 2018; CitationMozzi et al., 2018; CitationVogel et al., 2011) provided that the method of determination of the paleosoil roof is unequivocal and the density of reference points is large (CitationRadwański, 1975). Such information may also be obtained from an analysis of geological outcrops or geological drillings carried out during geoengineering works (CitationKaniecki, 2013; CitationMcMillan & Powell, 1999; CitationOrengo & Fiz, 2008; CitationRosenbaum et al., 2003; CitationSetmajer, 1973) or scientific research (CitationMolewski & Juśkiewicz, 2014) which gives precise heights of the roof of the paleosoils.
In the investigations on the changes of the topography of historic town centres attention is focused on the estimation of the thickness of cultural layers and on the determination of changes of land topography in selected small areas or along profiles. Attention is less frequently focused on the determination of the spatial differentiation of these changes within larger areas of the centres of historic towns. The aim of this paper is to reconstruct differences between the paleotopography and contemporary topography of the historic centre of Krakow, Poland over the last millennium (Main Map). The paleotopography identified represents the situation before the 10th century without any significant human impact. The application of selected morphometric indices makes it possible to quantitatively describe these changes with precision as far as the spatial aspect is concerned.
2. Study area
Krakow is located on the River Vistula in southern Poland in a location where the borders of the three main geomorphological units of Poland come together, namely the Polish Upland, the Carpathians, and the Subcarpathian Basins (). The study area (9 km2) is located in the centre of Krakow and covers 3% of the territory of the city. In this area, the River Vistula cuts through the southern part of the Polish Upland (the Krakow Gate) which is adjacent to the Carpathians, part of the Alpine orogeny (CitationKondracki, 2000). The study area is made up of Jurassic limestones which are homoclinally stratified and cut by faults, locally overlain by Cretaceous marls and loess sediments. They form tectonic grabens and horsts. The grabens are partly filled with Miocene clay. The upper parts of the horsts, exhumed from clay sediments, are formed as 30 m high flat-topped hills of steep, partly rocky slopes. The lower-located areas are covered by Pleistocene and Holocene alluvia and locally by peat sediments (CitationGrabowski, 2008; CitationGradziński, 1972; CitationObjaśnienia do Mapy geośrodowiskowej Polski, 2004; CitationRutkowski, 1989).
Figure 1. Study area.
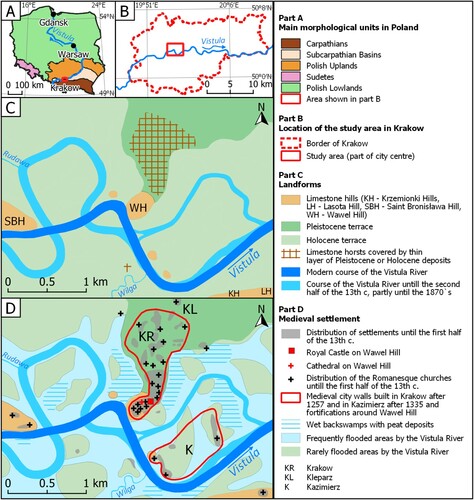
There are four categories of landform in the study area: limestone hills, the Middle Pleistocene terrace, the Holocene bottoms of the Vistula valley and its tributaries, and the channels of these rivers (). The western and south-eastern part of this area includes parts of the highest limestone hills (Saint Bronisława Hill, Krzemionki Hills, Lasota Hill), whereas in the central part four lower isolated hills occur with Wawel Hill dominating. They are accompanied by unexposed limestone horsts covered by a thin layer of alluvial sediment. A Middle Pleistocene terrace (7-10 m high) is located in the north-eastern and central part of the study area and forms a long neck reaching towards Wawel Hill. Tectonic horsts occur in this part of the Pleistocene terrace at shallow depth under the ground surface. Arched undercuttings of the escarpment of this terrace are the result of the migration of the Vistula channel in the Holocene. The majority of the area of Krakow city centre is located on the Holocene floodplain of the River Vistula and its tributaries (the Rudawa, the Wilga). Before the process of urbanisation in this area, its landscape mainly contained vast sandbars, peat-covered backswamps and oxbow lakes (CitationGrabowski, 2008; CitationHumnicki, 1979; CitationKmietowicz-Drathowa, 1974; CitationRadwański, 1975; CitationSetmajer, 1973; CitationTobiasz, 1977). The course of the Vistula in the area of the current city centre was subjected to many changes during the last millennium which are well-documented (CitationHumnicki, 1979; CitationRadwański, 1975; CitationRutkowski, 2008; CitationTobiasz, 1977). In Medieval times, the Vistula upstream of Wawel Hill formed a large meander, which was probably intentionally cut-off by the city’s inhabitants in the second part of the 13th century (CitationRadwański, 1975). Downstream of Wawel Hill, the Vistula flowed along two winding channels of which the southern one had been the dominant one until the 15th century, and the northern one had been dominant in the 16th-17th centuries but later silted up and was filled in during the 1870s (CitationTobiasz, 1977).
The distribution of landforms elevated above the level of the Vistula floods within the study area has determined the development of settlement since Neolithic times and also its territorial development since mediaeval times (CitationRadwański, 1975; CitationRutkowski, 2008; CitationSokołowski, 2009). The plateaux of limestone hills were populated first, then a vast neck of the Middle Pleistocene terrace and also some sandbars on the Holocene floodplain of the Vistula. The study area became densely populated as early as the 10th-12th centuries, which is suggested by the distribution of fortified settlements with stone churches in Romanesque style built in the 10th-12th centuries, mainly on Wawel Hill and on the neck of the Middle Pleistocene terrace (CitationRadwański, 1975; ). The settlement in areas of pre-location Krakow was determined by defensive factors because they were surrounded on three sides by the Vistula floodwaters and wetlands. Settlements with churches also developed on other limestone hills and locally on lower located areas. From the early 11th century until the turn of the 16th/17th centuries, Krakow was the capital of Poland (as the second capital, after Poznan) and the Wawel Hill with the Royal Palace and the Cathedral was the centre of power. In the face of the danger caused by the Mongol invasions in the 13th century, a decision was made to make changes to the town plan of Krakow and the surrounding areas (CitationRutkowski, 2008). As a result of the establishment of Krakow under the Magdeburg law in 1257 and of neighbouring Kazimierz in 1335 and Kleparz in 1366, there was a rapid development of the towns surrounded by their medieval city walls and their adjacent suburbs. By the beginning of the nineteenth century these towns had been combined into one urban centre which, at the beginning of the twentieth century, included the whole study area and now represents the historic centre of Krakow.
3. Data used and calculation methods
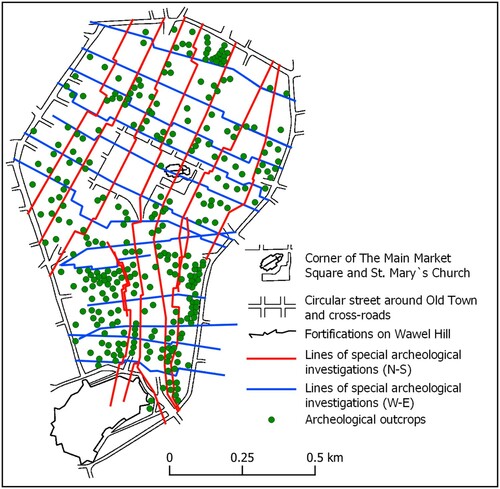
To determine the changes that have taken place in the topography of Krakow city centre it is first necessary to assess the paleotopography of this area before the town and its suburbs had started to develop. The paleotopography was reconstructed basing on the published contour-line maps at different scales covering different parts of the study area, which all together show the former topography. These maps were prepared from archaeological investigations (CitationHumnicki, 1979; CitationJamka, 1963; CitationKmietowicz-Drathowa, 1974; CitationRadwański, 1975; CitationŻaki, 1962, Citation1965) and do not show essential divergences. The roof of the in situ fossil soil overlain by cultural deposits is assumed as the former level of the ground surface. The accuracy of the results of such investigations depends on the density of reference points (CitationRadwański, 1975). For example, in the area of the Old Town and its surrounding park, known as Planty, the distance between the reference points locally does not exceed 20 m (). Such a situation in the study area makes it possible to interpret deposit profiles which are often disturbed by former cesspits, urban moats or marketplaces. Another source of information included in the assessment of the paleotopography of the study area is Setmajer’s map (Citation1973) based on the results of geoengineering investigations. This map shows the altitude of deposits [m a.s.l.] lying under the cultural layer. The total number of reference points taken into consideration which were used to prepare the contour-line diagram showing the paleotopography of the part of Krakow city centre covered by the study was about one thousand. This made it possible to prepare a preliminary (base) contour map of the study area with contours at 1 m intervals (without the Vistula channel).
Figure 2. Distribution of archeological reference points in the area of Old Town in Krakow.
The preliminary contour map allowed a DEM of 5 m resolution to be generated using the v.surf.rst function (spline with tension and smoothing). This shows the topography of the study area from a little more than 1000 years ago. A DEM based on aerial laser scanning (ALS DEM) with a 1 m resolution and showing the contemporary topography of Krakow city centre was obtained from the Provincial Centre of Geodetic and Cartographic Records in Krakow. This DEM was resampled to a 5 m resolution using the weighted average method and transformed to the Poland 92 Coordinate System (EPSG: 2180). The comparison of DEMs showing the former and contemporary land topography made it possible to evaluate changes in the topography of Krakow city centre which have occurred over the last millennium. To evaluate these changes the following morphometric indices were taken into consideration at both points in time: (1) elevation [m a.s.l.], (2) relative heights [m], (3) slope [°], (4) aspect classes (N 315°-45°, E 45°-135°, S 135°-225°, W 225°-315°). Slope and aspect maps were generated using the CitationZevenbergen and Thorne (1987) algorithm. QGIS 3.4, SAGA GIS 7.2 and GRASS GIS 7.6 were used for spatial analyses of the morphometric indices. Calculations of the areas [m2] within separated elevation classes, slope classes and aspect classes were performed in Microsoft Excel 2013. QGIS 3.4 was used for the map processing and final visualisation. The value of these indices was shown graphically for the whole area studied which made it possible to evaluate changes in the topography of any part of the area between the historical and contemporary situations. The changes in elevation and relative heights were analysed based on the grid square cells of side 150 × 150 m present on each map (391 squares each with an area of 2.25 ha). Based on the index (1) calculated as a mean value for each grid square at both of the points in time analysed, changes in elevation Δh1 [m] were determined. Analogously, based on the index (2) assessed for each grid square, changes in relative heights Δh2 [m] over the time period analysed were determined. Changes in the slopes of the study area were estimated based on a comparison of the percentage [%] of the study area showing selected slopes [°] at both points in time analysed. Changes in the aspect of the study area were determined in an analogous fashion. The calculations applied in the investigation make it possible to answer the questions: In which parts of the study area was there an increase or decrease of elevation as well as relative height and slope?; Did this area become flatter or more uneven?; What are the changes in aspect?
4. Results
4.1. Paleotopography
The paleotopography of the study area before the start of settlement in the 10th century showed the major part of the area falling in the elevation range 195–200 m a.s.l., which included most of the Vistula floodplain (Main Map – Part A). The foot of the escarpment of the Middle Pleistocene terrace and the foot of the limestone hills did not exceed 205 m a.s.l. The neck of the Middle Pleistocene terrace and isolated limestone hills with clearly marked boundaries looked like a ‘peninsula’ or ‘islands’ rising above the usually swampy area of the Vistula floodplain (CitationŁajczak & Zarychta, 2020). Each of these landforms was of a table-like shape with a flat plateau inclined towards the Vistula and bordered by steep slopes (limestone hills – stony slopes). The highest hills, including the centrally located Wawel Hill, dominantly rising 30 m above the Vistula floodplain. Other hills were located 5–10 m above the floodplain including the long neck of the Middle Pleistocene terrace. In the area of the Vistula floodplain 5 m high sandbars occurred. Some of these were located directly downstream of the isolated limestone hills and formed ramparts up to 0.5 km long. Between the sandbars there was the meandering channel of the River Vistula and paleochannels filled with peat sediments. The largest backswamps of the Vistula filled with peat sediments were located at the foot of the neck escarpment of the Middle Pleistocene terrace.
The majority of the study area (ca. 90%) showed a slope <=2° (Main Map – Part A). This was typical for almost the whole area of the Vistula floodplain and the plateau of the Middle Pleistocene terrace and also for small fragments of the plateaux of the limestone hills. Other areas of terrain with steeper and steeper slopes showed smaller and smaller areas respectively (e.g. areas of slope >20° only covered 0.1%). Some parts of the sandbars on the Vistula floodplain and parts of the escarpments of the Middle Pleistocene terrace and the foot of the limestone hills showed a slope of 2–5°. The escarpment of the high terrace towering directly above the Vistula backswamps and also parts of the slopes of the limestone hills showed slopes of 5–10°. Steeper slopes (10-20°, locally >20°) were typical for Wawel Hill and Saint Bronisława Hill, and in the case of other limestone hills only the slope facing towards the river showed steep slopes. The vast area with a slope <=2° (ca. 90%) was classified as areas with no aspect. The surfaces with N and S aspects occupied about 7% of the study area and with W and E aspects circa 3% of the area.
4.2. Contemporary topography
At present almost whole area of the Vistula floodplain in Krakow city centre is located at an altitude range of 200–205 m a.s.l. (Main Map – Part B) therefore former sandbars are not as well exposed as the lowest limestone hill. The foot of the escarpment of the Middle Pleistocene terrace is located at an altitude above 205 m a.s.l. The foot of the highest limestone hills reaches an altitude of 210 m a.s.l. Small fragments of two other limestone hills rise above this height by 2 m or 7 m. There are some anthropogenic landforms which rise over 5 m (205–210 m a.s.l.) in the area of the Vistula floodplain, such as the railway embankment, promenades on the flood embankments of the Vistula river and its tributaries, bridge abutments, a hillock. Other parts of the Vistula floodplain which have been changed by human impact slightly exceed 205 m a.s.l. Concave landforms (several metres deep) were formed during construction work and these were then occupied by buildings. Within the Vistula floodplain, in areas built-up during the 19th and beginning of the twentieth century, local depressions commonly occur. These are courtyards are located among buildings and they are situated 1–2 m lower than the neighbouring streets. The present Vistula channel has been deepened by 4 m due to regulation works (CitationŁajczak, 1995). The plateau of the neck of the Middle Pleistocene terrace is elevated above 210 m a.s.l. across its whole surface and its W-E profile is not a tableland any more with the exception of its southern segment. Local depressions up to 3 m deep lying on the Vistula floodplain and the Middle Pleistocene terrace represent former topography present around old churches and synagogues. The altitude of the highest limestone hills is still as it was about a thousand years ago, however on the Wawel Hill plateau the extent of the area over 220 m a.s.l. has increased.
Contemporary slopes in the study area are still mainly <=2° (ca. 84%, Main Map – Part B). Within the Vistula floodplain there are numerous small sections of steeper slopes, even reaching 20°. These are places occupied by anthropogenic forms (concave or convex), among which linear forms are the most visible. The escarpment of the Middle Pleistocene terrace shows a softened profile and its slopes reach 10° in some places. The slope of the highest limestone hills reaches 20° and the N and W slopes of Wawel Hill exceed 20°. The contemporary topography of the Krakow city centre still features a majority of the area with no aspect. Slopes (>2°), which cover the remainder of the study area, cover a larger area than they did in the past. There are numerous small fragments of the Vistula floodplain with differentiated aspects which result from the development of anthropogenic landforms, especially linear ones.
4.3. Quantitative evaluation of changes in the topography of Krakow city centre during the last millennium
During the last millennium the average elevation of the area in Krakow city centre increased from 201.59–204.99 m a.s.l. due to the development of a layer composed of anthropogenic deposits, and the median of the altitude increased from 199.90–203.56 m a.s.l. (Main Map – Part C). At a local scale, within the individual grid squares one mainly finds increases in altitude Δh1 in the range 2–6 m, which covers 82% of the study area (changes 6–10 m – 2%, below 2 m – 15%), while negative changes cover 1% of the study area. For example, on the SE slope of Wawel Hill, where the Royal Castle was extended from the 11th to the 16th centuries, positive changes in altitude reached 6–14 m and in the area of the former backswamps of the River Vistula 4–10 m at the foot of the escarpment of the neck of the Middle Pleistocene terrace. Most of the surface in the Old Town was raised by 2–4 m. The largest area with negative changes in altitude includes former quarries. Negative changes in altitude start ‘temporarily’ in places occupied by pits for foundations of buildings constructed on the Vistula floodplain.
Spatial variation in changes in elevation Δh1 caused large changes in relative height Δh2. Overbuilding or lowering of the topographic surface caused changes of Δh2 values in different directions (Main Map – Part C). Despite greater build-up of lower lying areas with anthropogenic deposits in Krakow city centre, there was an increase of relative height in most of the study area. This mainly concerns linear anthropogenic forms, where (at grid square scale) Δh2 values increased by about 4–8 m. In the zone adjacent to the currently poorly visible escarpment of the neck of the Middle Pleistocene terrace, relative heights Δh2 decreased by 4 m (in individual grid squares) as compared to the initial state. Within the Old Town, the cultural layer caused a decrease of Δh2 values by as much as 4 m, which resulted in a gently sloping surface in this area. Changes of Δh2 values are also visible on the slopes of Wawel Hill. Build-up of anthropogenic deposits on the plateau and the upper parts of the S and SE slopes caused an increase in Δh2 values by as much as 14 m as compared to the areas at the foot of these slopes, whereas the build-up of these deposits on the N foot caused a decrease of Δh2 values by 4–8 m. Within former quarries (SE part of the study area) the creation of deep niches and cavities caused, at grid square scale, an increase in Δh2 values by a dozen or so metres, and in the adjacent areas, a decrease of Δh2 values by several metres. Those areas where the positive Δh2 values within individual grid squares are the highest (by 8–14 m) cover 1% of the study area, whereas the areas where positive Δh2 values increased by less than 8 m cover as much as 80% of the area studied, and less than 4 m 61% of the area studied. A decrease in Δh2 values, even by as much as 10 m, occurred over 19% of the area of Krakow city centre.
Despite the fact that in the last millennium almost all of the area of Krakow city centre has been overlain by anthropogenic deposits, the differentiation of slopes at a local scale has increased (Main Map – Part C). This increase results from changes in relief caused by anthropogenic landforms, especially convex linear forms, and very locally by concave forms (permanent or ephemeral). In the time period analysed slope areas <=2° decreased by 6.4%, and the areas of steeper slope (originally 0.82 km2) increased 1.7 times in the slope interval 2-5°, 1.9 times in the slope interval 5-10°, 1.1 times in the slope interval 10-20°, and 2.0 times in the slope interval >20°. The largest area of such changes included part of the Vistula floodplain, the zone of the neck escarpment of the Middle Pleistocene terrace, and the slopes of limestone hills. Such differentiation of slope resulted in changes of aspect. As compared to the historical situation, the flat area (slope <=2°, no aspect) decreased, whereas the areas with N, S, W, and E aspects increased. This resulted from the development of anthropogenic landforms, especially long forms of N-S or W-E orientation.
5. Conclusions
The results of the investigations enable the Authors to answer the questions asked at the start of the paper:
An increase of elevation Δh1 was found over almost whole of the study area, especially on the SE slopes of Wawel Hill, in concave forms at the foot of the neck escarpment of the Middle Pleistocene terrace, in the buried Vistula channel (in the nineteenth century), and in some convex anthropogenic forms within the Vistula floodplain. The largest decrease in altitude Δh1 was discovered on a small area of the N slopes of the limestone hills (former quarries).
The greatest increase of relative heights Δh2 was found within the built-up areas on the Vistula floodplain, where convex linear anthropogenic landforms were created, and also locally on Wawel Hill and in the area of former quarries. On the N part of Wawel Hill, within the boundaries of the Old Town, in the zone of the former foot of the neck of the Middle Pleistocene terrace, a decrease in the Δh2 value was found.
A spatially unequal increase of Δh1 values resulting in a local increase in Δh2 values caused a growth of areas of slope >2° in Krakow city centre (in the case of slopes 5-10° and >20° it was a twofold increase).
The development of anthropogenic landforms, mainly in the area of the Vistula floodplain, caused an increase in slope surfaces with S, W and E aspects, and of the N aspect to a lesser degree.
The answer to the question whether the uneven spatial increase or decrease of elevation which occurred in the part of Krakow investigated during the last millennium caused a flattening or increased unevenness of the study area is that it depends on the size of the areas of the study area that are analysed and on their distribution. At the scale of the whole study area, the changes are directed towards the flattening of the area. In some places at a local scale, areas with a flattening trend are adjacent to areas with a trend to increased unevenness.
It is difficult to back up the above results with other papers because the attention of authors is focused on other aspects of the topography of the town. Only a few papers discuss changes in the town’s topography as the consequence of a long lasting increase in anthropogenic deposits resulting in land flattening or increased unevenness. These papers, however, do not consider a quantitative evaluation of the many-sided character of this process (e.g. CitationKaniecki, 2013; CitationLuberti et al., 2019; CitationMolewski & Juśkiewicz, 2014; CitationPröschel & Lehmkuhl, 2019). Similar remarks concern the papers on the modern development of towns (CitationQiao et al., 2019; CitationTran Thi Van et al., 2015). The positive vertical changes in the topography of Krakow city centre which occurred during the last millennium and which are described in this paper show a large spatial differentiation and range up to over 10 m. In the literature (CitationTyczyńska, 1968) a value of 5 m has been suggested for the Old Town area. Other parameters of change in Krakow’s topography analysed by the Authors have never been considered in the literature.
Dominating convex anthropogenic landforms, like railway embankments, promenades on flood embankments of the River Vistula and its tributaries, bridge abutments, and hillocks, all formed in fluvial sediments, as well as concave landforms (limestone quarries), belong to typical anthropogenic landforms in towns which are discussed by CitationMcMillan and Powell (1999) and CitationRosenbaum et al. (2003).
Software
Spatial analyses of the morphometric indices were conducted using QGIS 3.4, SAGA GIS 7.2 and GRASS GIS 7.6. Microsoft Excel 2013 was used for calculations of the areas within separate elevation classes, slope classes and aspect classes. QGIS 3.4 was used for the map processing and final visualisation.
Supplemental Material
Download JPEG Image (674.3 KB)
Supplemental Material
Download JPEG Image (986.4 KB)
Supplemental Material
Download JPEG Image (927.3 KB)
MapC_v2.tif
Download TIFF Image (11.6 MB)MapB_v2.tif
Download TIFF Image (31.7 MB)MapA_v2.tif
Download TIFF Image (28.8 MB)MapC_v2.pdf
Download PDF (843.4 KB)MapB_v2.pdf
Download PDF (9.6 MB)MapA_v2.pdf
Download PDF (6.5 MB)Acknowledgements
We would like to thank the Provincial Centre of Geodetic and Cartographic Record in Krakow for providing the DEM from aerial laser scanning (ALS DEM) showing the contemporary topography of Krakow city centre. Thanks are also due to referees for their critical comments. Cartographical basis map data is copyrighted to OpenStreetMap contributors and available from https://www.openstreetmap.org
Disclosure statement
No potential conflict of interest was reported by the author(s).
Additional information
Funding
Related Research Data
References
- Brandolini, P., Cappadonia, C., Luberti, G.M., Donadio C., Stamatopoulos, L., Di Maggio, C., Faccini, F., Stanislao, C., Vergari, F., Paliaga, G., Agnesi, V., Alevizos, G., & Del Monte, M. (2020). Geomorphology of the Anthropocene in Mediterranean urban areas. Progress in Physical Geography, 44(X), 461–494. https://doi.org/10.1177/0309133319881108
- Brandolini, P., Faccini, F., Paliaga, G., & Piana, P. (2017). Urban geomorphology in coastal environment: Man-made morphological changes in a seaside tourist resort (Rapallo, eastern Liguria, Italy). Quaestiones Geographicae, 36(3), 97–110. https://doi.org/10.1515/quageo-2017-0027
- Brandolini, P., Faccini, F., Paliaga, G., & Piana, P. (2018). Man-made landforms survey and mapping of an urban historical center in a coastal Mediterranean environment. Geografia Fisica e Dinamica Quaternaria, 41, 23–34. https://doi.org/10.4461/GFDQ.2018.41.2
- Campagna, L., & Scardozzi, G. (2014). The archaeological Map for the Reconstruction of the Ancient topography of the Greek and Roman city of Taormina. LAC2014 Proceedings, 1–9. https://doi.org/10.5463/lac.2014.28
- Carver, M. O. H. (1983). Forty French towns: An essay on archaeological site evaluation and historical aims. Oxford Journal of Archaeology, 2(3), 339–378. https://doi.org/10.1111/j.1468-0092.1983.tb00346.x
- Dall’Aglio, P. L., De Donatis, M., Franceschelli, C., Guerra, C., Guerra, V., Nesci, O., Piacentini, D., & Savelli, D. (2017). Geomorphological and anthropic control of the development of some Adriatic historical towns (Italy) since the Roman age. Quaestiones Geographicae, 36(3), 111–123. https://doi.org/10.1515/quageo-2017-0028
- Del Monte, M., D’Orefice, M., Luberti, G. M., Marini, R., Pica, A., & Vergari, F. (2016). Geomorphological classification of urban landscapes: The case study of Rome (Italy). Journal of Maps, 12(1), 178–189. https://doi.org/10.1080/17445647.2016.1187977
- Grabowski, A. (2008). Topografia dawnego Krakowa: wypisy z dzieł. Dziennik Polski. Wydawnictwo Jagiellonia.
- Gradziński, R. (1972). Przewodnik geologiczny po okolicach Krakowa. Wydawnictwa Geologiczne.
- Humnicki, J. (1979). Plany grodów przedlokacyjnych 1:30,000. Kraków w XI-XII w. In J. Adamaszek (Ed.), Atlas historyczny Polski. (pp. 6) PPWK.
- Jamka, R. (1963). Kraków w pradziejach. T. 1. Zakład Narodowy im. Ossolińskich.
- Kaniecki, A. (2013). Environmental changes in the Warta valley within the Poznań area connected with antropopressure. Landform Analysis, 24, 23-34. https://doi.org/10.12657/landfana.024.003
- Kmietowicz-Drathowa, I. (1974). Wstępna rekonstrukcja naturalnej topografii centrum Krakowa. Materiały Archeologiczne, 15, 151–159.
- Kondracki, J. (2000). Geografia regionalna Polski. PWN.
- Łajczak, A. (1995). The impact of river regulation, 1850-1990, on the channel and floodplain of the upper vistula river, southern Poland. In E. J. Hickin (Ed.), River geomorphology (pp. 209–233). Wiley.
- Łajczak, A., & Zarychta, R. (2020). Reconstruction of the morphology and hydrography of the centre of Kraków before the mid-13th century. Geographia Polonica, 93(1), 25–50. https://doi.org/10.7163/GPol.0161
- Luberti, G. M. (2018). Computation of modern anthropogenic deposit thickness in urban areas: A case study in Rome, Italy. The Antropocene Review, 5(1), 2–27. https://doi.org/10.1177/2053019618757252
- Luberti, G. M., Vergari, F., Pica, A., & Del Monte, M. (2019). Estimation of the thickness of anthropogenic deposits in historical urban centres: An interdisciplinary methodology applied to Rome (Italy). The Holocene, 29(1), 158–172. https://doi.org/10.1177/0959683618804630
- Mandarino, A., Luino, F., Turconi, L., & Faccini, F. (2020). Urban geomorphology of a historical city straddling the Tanaro River (Alessandria, NW Italy). Journal of Maps, 1–13. https://doi.org/10.1080/17445647.2020.1746420
- McMillan, A. A., & Powell, J. H. (1999). BGS Rock Classification Scheme, Volume 4: Classification of artificial (man-made) ground and natural superficial deposits – applications to geological maps and datasets in the UK. Research Report Number RR 99-04. British Geological Survey, 1-65.
- Molewski, P., & Juśkiewicz, W. (2014). An attempt to reconstruct the primary relief of the Old town of Toruń and its close suburbs on the basis of the geological and historical geoinformation. Landform Analysis, 25, 115–124. https://doi.org/10.12657/landfana.025.010
- Mozzi, P., Ferrarese, F., Zangrando, D., Gamba, M., Vigoni, A., Sainati, C., Fontana, A., Ninfo, A., Piovan, S., Rossato, S., & Veronese, F. (2018). The modeling of archaeological and geomorphic surfaces in a multi-stratified urban site in Padua, Italy. Geoarchaeology, 33(1), 67–84. https://doi.org/10.1002/gea.21641
- Objaśnienia do Mapy geośrodowiskowej Polski 1:50,000, Ark. Kraków (973). (2004). PIG, Warszawa.
- OpenStreetMap contributors. (2019). Planet dump. Data file from 2019-10 of database dump https://planet.openstreetmap.org
- Orengo, H. A., & Fiz, I. (2008). The application of 3D reconstruction techniques in the analysis of ancient Tarraco’s urban topography. In A. Posluschny, K. Lambers, & I. Herzog (Eds.), Layers of perception. Proceedings of the 35th international conference on computer applications and quantitative methods in archaeology (CAA), Berlin, Germany, April 2–6, 2007 (Kolloquien zur Vor- und Frühgeschichte, vol. 10), 1–6.
- Pica, A., Luberti, G. M., Vergari, F., Fredi, P., & Del Monte, M. (2017). Contribution for an urban geomorphoheritage assessment method: Proposal from three geomorphosites in Rome (Italy). Quaestiones Geographicae, 36(3), 21–36. https://doi.org/10.1515/quageo-2017-0030
- Pröschel, B., & Lehmkuhl, F. (2019). Paleotopography and anthropogenic deposition thickness of the city of Aachen, Germany. Journal of Maps, 15(2), 269–277. https://doi.org/10.1080/17445647.2019.1590248
- Qiao, W., Wang, Y., Ji, Q., Hu, Y., Ge, D., & Cao, M. (2019). Analysis of the evolution of urban three-dimensional morphology: The case of Nanjing city, China. Journal of Maps, 15(1), 30–38. https://doi.org/10.1080/17445647.2019.1568922
- Radwański, K. (1972). Stosunki wodne wczesnośredniowiecznego Okołu w Krakowie, ich wpływ na topografię osadnictwa, próby powiązania tych zjawisk ze zmianami klimatycznymi. Materiały Archeologiczne, 13, 5–37.
- Radwański, K. (1975). Kraków przedlokacyjny: rozwój przestrzenny. Polskie Towarzystwo Archeologiczne i Numizmatyczne Oddział w Nowej Hucie, Muzeum Archeologiczne w Krakowie.
- Rapp, G., & Hill, Ch.L. (1999). Geoarchaeology: The Earth-Science Approach to archaeological Interpretation. Yale University Press, https://doi.org/10.2307/2694232
- Reynard, E., Pica, A., & Coratza, P. (2017). Urban geomorphological heritage. An overview. Quaestiones Geographicae, 36(3), 7–20. https://doi.org/10.1515/quageo-2017-0022
- Rosenbaum, M. S., McMillan, A. A., Powell, J. H., Cooper, A. H., Culshaw, M. G., & Northmore, K. J. (2003). Classification of artificial (man-made) ground. Engineering Geology, 69(3-4), 399–409. https://doi.org/10.1016/S0013-7952(02)00282-X
- Rutkowski, H. (Ed.). (2008). Atlas historyczny Polski. Województwo krakowskie w drugiej połowie XVI wieku. Część I. Mapy, plany. Wydawnictwo Instytutu Historii PAN.
- Rutkowski, J. (1989). Budowa geologiczna regionu Krakowa. Przegląd Geologiczny, 37(6), 302–308.
- Setmajer, J. (1973). Główne rysy budowy geologicznej oraz pierwotnej topografii Krakowa i strefy przełomowej Wisły. Acta Archaeologica Carpathica, 13, 139–151.
- Sokołowski, T. (2009). Topograficzne tło osadnictwa w Krakowie. Geologia, 35(1), 67–76.
- Tobiasz, M. (1977). Dziejowe przemiany sieci wodnej i zagospodarowania przestrzennego Krakowa. Zakład Narodowy im. Ossolińskich, Wydawnictwo PAN.
- Tran Thi Van, Phuong, D. T. K., Y Van, P., & Bao, H. D. X. (2015). Mapping Changes of Surface Topography under Urbanization Process in Ho Chi Minh City, Vietnam, Using Satellite Imagery. 1st International Electronic Confrence on Remore Sensing 22 June – 5 July 2015 (pp. 1–7). https://doi.org/10.3390/ecrs-1-d002
- Tyczyńska, M. (1968). Relief and geological structure of the Site of Cracow. Folia Geographica, ser. Geographica-Physical, 1, 9–34.
- Vogel, S., Märker, M., & Seiler, F. (2011). Revised modelling the post-AD 79 volcanic deposits of Somma-Vesivius to reconstruct the preAD 79 topography of the Sarno River plain (Italy). Geologia Carpathica, 62(1), 5-16. https://doi.org/10.2478/v10096-011-0001-3
- Żaki, A. (1962). O dawnej rzeźbie terenu Wzgórza Wawelskiego. Sprawozdanie z Posiedzeń Komisji PAN (p. 349–351).
- Żaki, A. (1965). Początki Krakowa. Wydawnictwo Literackie.
- Zarychta, R., Łajczak, A., & Struś, P. (2018). Rekonstrukcja zmian topografii centrum Krakowa w ciągu ostatniego 1000 lat z wykorzystaniem zaawansowanych narzędzi geoinformatycznych oraz historycznych informacji o rozwoju miasta i zmianach w sieci hydrograficznej. In A. Kostrzewski, A. Stach, M. Majewski (Eds.), Geneza, litologia i stratygrafia utworów czwartorzędowych. T. VII (pp. 217–220). IGIG UAM.
- Zevenbergen, L. W., & Thorne, C. R. (1987). Quantitative analysis of land surface topography. Earth Surface Processes and Landforms, 12(1), 47–56. https://doi.org/10.1002/esp.3290120107
- Zwoliński, Z., Hildbrandt-Radke, I., Mazurek, M., & Makohonienko, M. (2017). Existing and proposed urban geosites values resulting from geodiversity of Poznań city. Quaestiones Geographicae, 36(3), 125–149. https://doi.org/10.1515/quageo-2017-0031