
ABSTRACT
A map derived by rockfall analysis at Mount Pellegrino is presented herein. The study area is affected by several phenomena of rockfall which caused numerous damage and a strong social and economic impact. Official reports and maps that give a general assessment of rockfall hazard are available in this respect, however, it would be advisable to provide a more specific cartographic support useful for land management and planning. The drafting of new maps showing the rockfall runout areas is an additional tool that may be used in conjunction with the existing maps as a means of risk mitigation and reduction. On the basis of geological, geomorphological, and geomechanical analysis and exploiting the information relating to a landslides inventory obtained by using both analytical and empirical methods, two different rockfall propagation areas were reconstructed. The final thematic map permit to appreciate the differences and similarities between the obtained runout areas.
1. Introduction
According to the database of floods and landslides (CitationGuzzetti et al., 2005) and the related economic and human lives losses occurred in Italy between AD 1279 and 2002, about 75% of the fatalities and 55% of the injured people were caused by fast-moving failures (e.g. rock falls, rockslides, debris flows); furthermore, these phenomena have considerable economic and social impacts resulting from the damages of the structures and infrastructures. In particular, several rockfall cases are documented in the international literature, especially when such mass movements threaten cultural heritages or strategic elements (CitationMineo et al., 2018; CitationMineo & Pappalardo, 2019)
In rockfall slope processes a rock mass detaches from a steep slopes descending fast by falling and subsequently rolling, sliding, bouncing and finally stopping (CitationCruden & Varnes, 1996; CitationHutchinson, 1988); when rock blocks impact the ground, generally break up in fragmental blocks depending the type of outcrops and slope morphology. The sizes and type of rockfall range depending on the structural setting, the characteristics, and the frequency of discontinuities.
Several methodologies have been proposed to assess rockfall hazards (CitationCalligaris et al., 2017; CitationCrosta & Agliardi, 2003, Citation2004; CitationFell et al., 2008; CitationFrattini et al., 2008; CitationKanwal et al., 2017; CitationMineo et al., 2017) and the obtained results are useful tools for territory management since allow the identification of potentially dangerous areas and the drafting of guidelines for the risk mitigation measures. The hazard due to rockfall propagation consists of reach probability and rockfall intensity at specific locations (CitationFrattini et al., 2008) and the related mapping requires definition of the runout distance and the area which can be reached by blocks (propagation area; CitationJaboyedoff & Labiouse, 2011). The rockfall runout zones can be identified by means several methodologies: empirical methods (CitationCorominas, 1996; CitationHunter & Fell, 2003) analytical methods (CitationBozzolo & Pamini, 1982; CitationPfeiffer & Bowen, 1989; CitationScioldo, 1991) and numerical methods (CitationCundall & Hart, 1993). The rockfall trajectories study requires the collection and the evaluation of the past rockfall events which contain information on when, where and what rockfall events occurred. These datasets should be checked and related to the results of the geological and geomechanical surveys.
The Mount Pellegrino is a very important area regarding both religious and cultural traditions of the city of Palermo; in the last 20 years the urbanized areas at the slopes of the mount have been affected by several rockfall (CitationCafiso & Cappadonia, 2019).
On the basis of the national guidelines of the Basin Master Plan for geo-hydrological risk mitigation (PAI), maps containing the areas where new landslides potentially may occur (hazard zones) distinguished according to the hazard level are available (e.g. Main Map, Fig.e). As regard rockfall the PAI maps show a potential blocks propagation area defined on the basis of the information deriving from the runout area of the past phenomena and the presence of active interventions and passive defence works. These maps give an overview of the landslides but could be implemented by means of additional studies useful for planning and monitoring of geomorphological risk as also foreseen in the directive issued by the Regional Department of Environment and Territory (Direttiva Crolli, Regione Siciliana, 2013). Finally, the PAI hazard maps are still under development with updates and it is expected that they will be integrated (regarding the rockfall phenomena) with maps derived by the implementation of the empirical models.
In order to realize the Main Map in which are reported the rockfall runout zones for the whole area of Mount Pellegrino and to compare these with of the hazardous areas of PAI, two different methodologies were applied: the ‘reach angle’ empirical model and the ‘lumped mass’ analytical model. The reach angle method is an empirical way to estimate the areas that might be reached by rockfall and refers to angle of dipping of the line joining the top of the slope and the tip of the rockfall deposit (CitationCorominas, 1996; CitationHeim, 1932).
The runout areas were also defined through numerical simulations of rockfall trajectories using the 3D numerical model Rotomap, which implements the lumped mass analytical model codified by CitationScioldo, 2006.
The drafting of the Main Map was carried out by means several geological and geotechnical analysis conducted over the years. The first results for three sectors of Mount Pellegrino are already described in CitationCafiso & Cappadonia, 2019 and CitationCafiso et al., 2020, where it is available a GIS-database of main phenomena occurring in the last 20 years, which also was used to carry out the analysis in this study.
2. Study area
The isolated relief of Mount Pellegrino (594.4 m a.s.l.) is a sector of the urban zone of Palermo, one of the most important cities of Italy (see top right box of the Main Map) located in the northern coast of Western Sicily. The mount extents for about 6 kilometres in NNW-SSE direction with a large flat top bounded by very steep slopes (). The study area has a key importance to the urban territory in many respects. In the Southern sector, at the slopes of the Mount takes origin a medieval path (g) that leads to the most important religious site of the city (Santuario di Santa Rosalia). In the whole study area, extends a natural oriented reserve characterized by an extraordinary example of Mediterranean scrubland (biogenetic and wildlife reserve) develops, which is criss-crossed by numerous paths (). In the western sector there are the sporting facility of the city (d) and an ancient hunting reserve (a park of about 400 hectares). The northern sector shows an undulate shape caused by the karstic phenomena which favoured the formation of numerous caves (a,e) which constitute a geosite of international relevance. Along the coastal route, on the eastern slopes of the Mount, there is located the Santa Maria dei Rotoli (f) monumental cemetery; in this scenic coast drive, which leads to Mondello, one of the most affluent tourist area of Sicily, there are also many bathing facilities. From the geological point of view, Mount Pellegrino is located in the northernmost edge of the Palermo Mts. and is a part of the emerged Sicily Fold and Thrust Belt (FTB, CitationAvellone et al., 2010), which links the African Maghrebide to the Calabrian arc and Southern Apennines. This region originated because of a complex interaction of compressional events, crustal thinning, and strike-slip faulting. Tectonic activity started in the Miocene with the deformation of the Sicilian FTB and lasted until the early Pliocene. The present-day setting of Mount Pellegrino (b) is the results of the overthrust of carbonate platform terrains and the subsequent dissection of these tectonic units by means high angle normal faults related to the Plio-Quaternary extensional and transtensional tectonic events during the opening of Tyrrhenian Sea. These latter events influenced the morphological setting of the area characterized by the presence of isolated carbonatic reliefs alternated with depressions due to the drowning of the northern sectors of the Sicilian chain in the Tyrrhenian Sea and filled by marine deposits (CitationCatalano et al., 2013a, Citation2013b). The physical continuity of the mountain range is broken by the wide, topographically-depressed, coastal area of Conca d’Oro surrounded towards the hinterland by large scarps broad scarps hundreds of metres tall passing inland, and lies on a depression of tectonic origin consisting of lowered faulted blocks (CitationBrandolini et al., 2019; CitationCappadonia et al., 2020; CitationDi Maggio et al., 2017). It is a block-faulted structural setting where different morpho-structural depressions filled with Quaternary marine and continental deposits are bounded by prominent Meso-Cenozoic carbonate promontories of Mount Pellegrino and Mount Catalfano (CitationLo Iacono et al., 2014). The tectonic pattern of the area is also characterized by normal and strike slip faults systems with main NE-SW and N-S directions, cutting also the Quaternary deposits (CitationGugliotta et al., 2010).
Figure 1. Slope angle classes map of the Mount Pellegrino and panoramic views of main landscape elements.
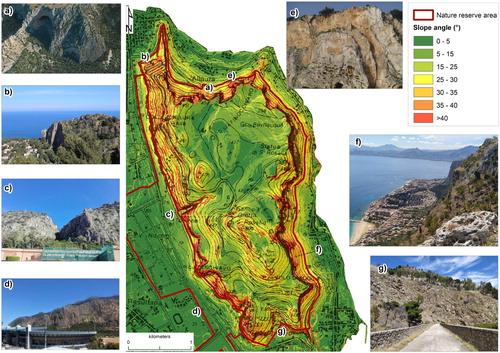
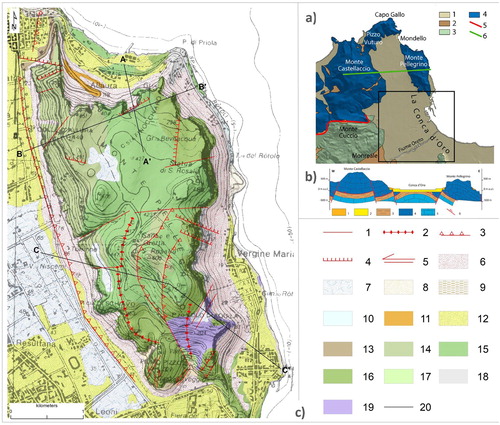
Figure 2. (a) Tectonic scheme (after CitationCappadonia et al., 2020, modified): 1. Quaternary deposits; Structural Stratigraphic Units (USS) deriving from 2. Numidian Flysch; 3. Imerese basin successions; 4. Panormide platform successions; 5. Main thrust; 6. Trace of the geological section of (b). (b) Schematic geological cross-section section through the Conca d’Oro Plain (trace (a); after CitationCappadonia et al., 2020, modified). 1. Slope deposit; 2. Marsala synthem; 3. Numidian Flysch; 4. Panormide succession (upper tectonic units); 5. Panormide succession (lower tectonic units); 6 Fault or thrust. (c) Geological map of the study area (modified from Catalano, 2013). 1. Fault; 2. Anticline; 3. Reverse fault; 4. Normal fault; 5. Left lateral strike slip; 6. Detritus and poor sorted materials (Upper Pleistocene-Holocene); 7. Eluvial and colluvial deposits (Upper Pleistocene-Holocene); 8. Sands (Upper Pleistocene-Holocene); 9. Aeolian Deposits (Upper Pleistocene-Holocene); 10. Conglomerates (middle-upper Pleistocene); 11. Cross laminated aeolian calcarenites (middle Pleistocene); 12. Terraced calcarenites (Calabrian); 13. Bioclastic packstone-to-rudstone (middle Lutezian – late Cuisian); 14. Bioclastic packstone (Cenomanian – Senonian); 15. Bioclastic wackestone-packstone (Barremian – Aptian); 16. Coralgal biolitites (Tithonian – Neocomian); 17. Reddish marly carbonates and nodular pseudobreccias (middle-upper Liassic); 18. Dolomitic limestones and dolomites (upper Triassic – lower Liassic); 19. Massive grey limestones and dolomitic limestones (upper Triassic); 20. Trace of geological cross-section.
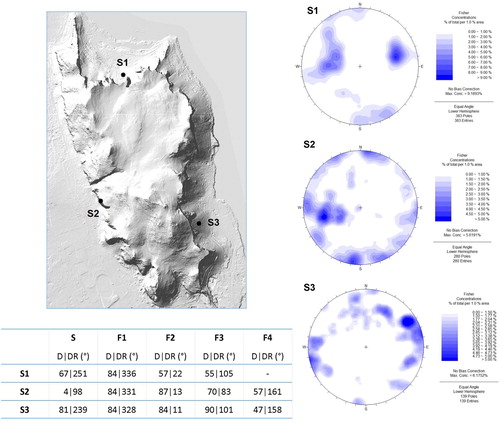
The Mount Pellegrino area consists of the rocks belonging to the Structural Stratigraphic Units which derive from the deformation of the Panormide Domain (USS, CitationCatalano et al, 2013a) characterized by homogeneous lithologies (pelagic carbonates, mainly) intensely fractured and karstified (a). In the lowest altitude outcrops quaternary deposits like as calcarenites and conglomerates terraced; these deposits are covered by detritus and eluvial-colluvial deposits. shows three schematic geological cross-section of representative sectors of the Mount Pellegrino, highlighting how each sector is characterized by different stratigraphic and structural conditions. The geological setting and the several expositions of the very steep slopes of the mount mean that the rocky faces are affected by several rockfall phenomena. The rock cliffs in the study area contains complex bedding planes geometries, several sets of discontinuities and are characterized by intense karst processes; it is possible, therefore, to observe for each sector of the mount, various typologies of rockfall that can be classified, according to CitationHoek & Bray, 1981, as plane failure, wedge failure, toppling and rock-fall. When the rock slopes are characterized by a high fracture densities forming numerous unstable rock blocks, the most common models of failures are the rock-fall (); in particular, the rock-fall failure happens where there is a recess of the rocks caused by karstic phenomena or precedent collapses (CitationCafiso et al., 2020; CitationCafiso & Cappadonia, 2019). When, instead, rock masses are affected by sub-horizontal bedding planes and sub-vertical discontinuities isolating unstable rock blocks, phenomena like rock-fall and toppling occur. In some cases, the unstable rock blocks are shaped like slabs or pinnacles (). The sliding phenomena (planar sliding or wedge failure) occur along discontinuities where the strike of the sliding plane is close to the strike of the topographical slope and the dip of the sliding plane is less than the dip of the slope (). To mitigate the rockfall risk, over the years, several works were carried out, including active interventions and passive defence works (CitationCafiso & Cappadonia, 2019). In order to determine geo-mechanical characteristics of the rock masses, detailed geological and geostructural surveys along horizontal and vertical scanlines have been carried out. This step allowed to identifying main sets of discontinuities using the standard method proposed by CitationISRM, 1978; results were used to better understand the overall structure of the rock masses, to characterize the kinematics of the rockfall source areas and to recognize the basic failure mechanisms (sensu CitationHoek & Bray, 1981) as described above. The data of the scanline surveys were contoured using Dips 5.109 software (CitationRocscience, 2012); the results for the some representative sectors (S1, S2, S3) are presented in . Five discontinuity sets have been identified; the bedding planes (S) are sub vertical in S1 and S3 while are horizontal in S2 as one sees from the . The sets F1, F2 and F3 include discontinuities sub vertical, parallel and orthogonal to the rocky slopes, while in F4 joints inclined averagely to the horizontal were detected.
Figure 3. Representative geological cross-sections of Mount Pellegrino area (See for the traces).
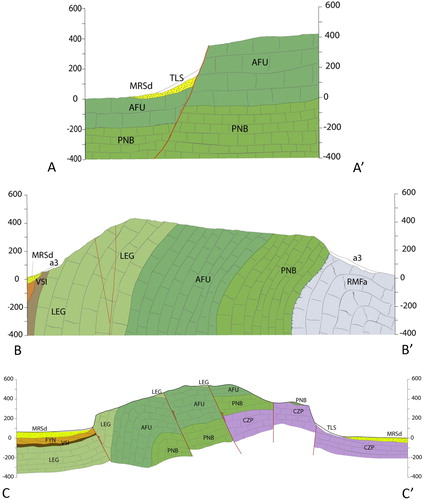
Figure 4. Examples of rock-fall in a main road in northern sector of the study area: (b) rock-fall release area and (c) rock-fall deposits.
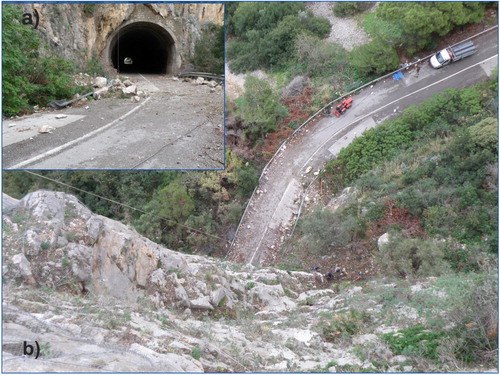
Figure 5. Unstable blocks as a. slabs, b.,c.boulders and d. pinnacles which could involve in kinematics of toppling.
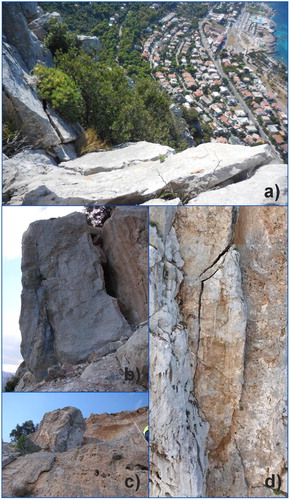
Figure 6. Example of a block-slide along the street leading to the Santuario of S. Rosalia. b. Unstable huge rock block in a rock wall affected by slide phenomena.
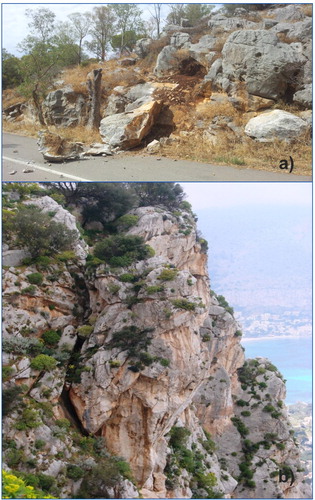
Figure 7. Contour diagram of the discontinuities measured during the scanline surveys in three representative sectors (S1,S2,S3) and values od Dip and Dip-direction relating to the bedding plane (S) and the other discontinuity sets (F1-F4).
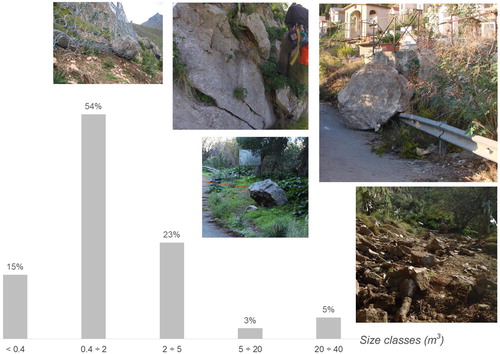
The intersections between of the discontinuity sets separate the rock mass into discrete and interlock blocks that depending on their positions are stable or instable; for these latter are kinematically possible the modes of failure as sliding (plane and wedge), toppling and falling. The rock block dimensions are the result of the intersection of the discontinuity sets, but also from the spacing of the individual sets. On the basis of the landslides inventory (CitationCafiso & Cappadonia, 2019) and the field surveys it was found that the sizes of the collapsed and instable blocks vary from fractions to tens of cubic metres ().
Figure 8. Rock block size distribution and some examples of collapsed and instable blocks in the study area.
3. Methods
The input data useful for the drafting of the Main Map were collected by various steps including geological, geomorphological and geomechanical surveys of the rock masses look out over the urbanized area.
The drafting of the Main Map was realized exploiting two models: the ‘reach angle’ empirical model (CitationCorominas, 1996) and the ‘lumped mass’ analytical model (CitationScioldo, 2006).
Despite the presence of active interventions (panels of steel ropes and harness with steel cables fixed to rock anchors) and passive defence works (high energy absorption barriers) to mitigate the rockfall risk, these were not taken into consideration when calculating runout areas.
The reasons behind this choice are related to the fact that the regular maintenance lacks or is in progress; but also because the presence of the works could have been taken into consideration only in the analytical model application, and the results would not have been comparable.
These two methods allowed us to define two different rockfall runout areas and to compare the results with the corresponding areas in the hazard map of the PAI (See Main Map and Main Map Fig.d).
The geomorphological analysis underlies for the acquirement of input data useful for the empirical method application, while the analytical method required a series of detailed geological surveys and the support deriving from the back analysis applied to the rockfall phenomena collected in the inventory as described in CitationCafiso & Cappadonia, 2019.
In order to identify the runout areas, it is necessary to investigate the unstable rock blocks trajectories; as regarding the study area, characterized by the presence of several unstable elements at different altitudes, as a precautionary approach, the detachments located in the highest scarps have been considered.
The reach angle (α) method is an empirical way to estimate the areas that might be reached by rockfall and refers to angle between the horizontal line and the line joining the top of the slope and the farthest fallen block (CitationCorominas, 1996; CitationHeim, 1932). Therefore, the intersection between the topographic profile and the line starting from the point of detachment with a certain angle to the horizontal line defines the point of maximum propagation (CitationEvans & Hungr, 1993; CitationJaboyedoff & Labiouse, 2011). Various α values are documented in the literature as: 28,5° (CitationOnofri & Candian, 1979), 32° (CitationToppe, 1987), 37° (CitationMeiβl, 1998), 33° (CitationHeinimann et al., 1998), 41° (CitationJomelli & Francou, 2000).
This variability depends on several factors, including rockfall source altitude, the slope morphology and the presence of obstacles.
For this study the reach angle values have been measured based on the landslides inventory considering the source and the stop point of the rockfall deposits (see Main Map).
The reach angle values are similar for those phenomena occurred, respectively, in the sectors of the Mount which differing according to the exposure, the litho-structural setting, and, consequently, to the rockfall typologies.
As a consequence, in order to apply this model, for each sector with different direction of exposure of the slopes, the reach angle values have been calculated and the averaged have been considered: W – α=35°; E – α=37°; N – α=42°; S – α=42° (Figure 10). These values are consistent with the sizes of the collapsed or unstable blocks as described in and according to CitationCorominas (1996), in which the reach angle must be included in the range of 33–48 degrees for rockfall involving volumes smaller to 1000 m3. The reach angle method was integrated into the r.droka raster, a module of an open-source GIS (GRASS). This application, which develops in two dimensional environment identifying the maximum area of invasion of a rockfall from morphometric analysis of the slope (CitationFilipello et al., 2010), allowed to draw the runout areas for each above indicated value (see Main Map).
The empirical models are based on data acquired in a sector analysed by statistical methods. The predicted runout areas are suitable to be used even in another site with similar conditions (CitationCopons & Vilaplana, 2008; CitationSoeters & VanWesten, 1996). However, using these methods, there is no information about the boulders behaviour during the runout (CitationCopons et al., 2009).
Then, after the identification and mapping of the litho-stratigraphic and mechanical characteristics of the outcrops terrains on the slopes of the Monte Pellegrino, where the rock blocks movement occurs, the analytical method was applied.
The runout areas were defined through simulations of rockfall trajectories using 3D model Rotomap, which implements the lumped mass analytical model codified by CitationScioldo, 2006 using a 2 m cell size digital terrain model (DTM) interpolated from LIDAR (ATA 2007-2008), according to this approach the block is, by convention, considered to be dimensionless as a simple lumped mass system.
The mechanical characteristics of the surface material where the rock blocks movement occurs have been surveyed, because of these influence the loss of energy at the impact points modelled using restitution and friction coefficients (CitationScioldo, 2006) calculated by means the back-analyses of the landslides of inventory; the parameters for the rockfalls analysis are presented in .
Table 1. Parameters used for the rockfall analysis: Kn. coefficient of restitution of normal energy; Kt. coefficient of restitution of tangential energy; Cr. friction coefficient of the rolling boulders; δ(°). flying limit angle; χ(°). colliding limit angle; j(°). bouncing limit angle; n. number of starting points; v. initial velocities; d(°). maximum angular deviation; N. Number of trajectories.
The results show the block trajectories (Main Map-Fig.c), the arrival points and the type of movement along the slope surface (bouncing or rolling). The trajectories individuate the potential runout of the blocks, while the potential propagation areas can be defined by means the envelope of the sources and stop points.
This approach allowed distinguishing two propagation areas: terrestrial and marine (see Main Map); the second of these comes from the union of the stop points of the potential bouncing blocks on the marine area.
Achieved data were summarized in the Main Map, where the obtained propagation areas by means the two methodologies were drawn. Those derived by exploiting the reach angle method were distinguished with different colours depending on the mean values (W – α=35°; E – α=37°; N – α=42°; S – α=42°) and also considering the runout areas that reach the sea. The areas resulting from the analytical method were differentiated just into marine and terrestrial.
4. Results
The Main Map consists of a central part where the runout areas obtained by the two models were reported at scale 1:6000. Furthermore, the rockfall of the inventory using to carry out the back analysis are represented. For these phenomena, the source and the stop points were drawn. The map also includes the main scarps along which the detachments for the models have been considered, as a precautionary approach. The scarps were mapped by means the field surveys and the analysis of the orthophotos and DTM.
The runout areas were defined by means the ‘reach angle’ (CitationCorominas, 1996) and the ‘lumped mass’ models (CitationScioldo, 2006) and compared with each other and also to the corresponding hazard areas identified in the framework of the PAI (See Main Map). In the course of implementation of the models, the interventions of risk mitigation present in the study area were not considered.
As regard the runout zones obtained by the implementation of the reach angle method, were used the average values calculated for each sector with different direction of exposure of the slopes.
The areas are represented with different colours on the basis of the angle value used. Furthermore, it was reported the propagation marine area. The runout areas obtained by the analytical method come from the union of the points (source and stop) of the trajectories. Even in this case, for the eastern sector, it was reported the propagation marine area. This area was drawn taking into account the stop points of the bouncing trajectories into the sea.
The areas obtained with the two methods often coincide, especially in eastern and southern sectors. In the northern part of the study area, those obtained by the implementation of the analytical method are a little wider. In the western sector there are always small differences but in alternate way.
Figure c of the Main Map shows the trajectories derived from the analytical method, distinguished on the basis of the movement (rolling or bouncing). For some sectors of the analysed area, these trajectories had already been defined (CitationCafiso et al., 2020; CitationCafiso & Cappadonia, 2019) and in this study have been recalculated in the light of new field surveys with the intention of improving the analytical model on the whole area. The results at slope scale coincide with previously obtained and only locally there are small differences in terms of a reduction of runout areas.
Figure d gives a chart comparison among the obtained runout areas and those indicated in the hazard map of the PAI and distinguished according to the hazard level. The comparison shows that the PAI areas generally fall within the borders of the two different runout areas.
5. Discussion and conclusion
The study carried out in the Monte Pellegrino area has allowed to define the rockfall propagation areas for the slopes look out over the urbanized area exposed to serious rockfall risk. The runout areas were defined by means the ‘reach angle’ and ‘lumped mass’ methods and compared with each other and also to the corresponding hazard areas indicate on of the official cartography, in terms of areal extent.
As observable in the Main Map Fig.d, the comparison shows that there are no significant differences between the calculated areas and that the hazard zones of the PAI fall within these, generally.
This result is particularly significant in light of the study scale in which the empirical method results are in accordance with those of the analytical method.
Generally, the empirical method represents the better way in terms of timeframe and resources but it is considered too much precautionary, especially at medium and small scales.
However, in this case the large similarity between the two derived runout areas seems to suggest that the reach angle method can be used at medium scale for the study area and for similar cases if supported by a good landslides inventory. This latter allowed to define in a geometrical way the reach angle values and relate them to each other in terms of litho-structural and morphological setting of the area.
The obtained results could be useful also for Institutions, considering that the available maps of the PAI are still under development with updates and it is expected that it will be integrated (regarding the rockfall phenomena) with maps derived by the implementation of the empirical models.
Therefore, the produced map could be considered as a tool useful for the hazard rockfall areas assessment and related mitigation actions on territory.
Software
QGis, ESRI ArcGIS, GRASS GIS (r.droka), ROTOMAP, Dips 5.109 and Adobe Illustrator software were used to carried out the analysis and to produce the Main Map.
Supplemental Material
Download PDF (293.9 MB)Disclosure statement
No potential conflict of interest was reported by the authors.
Additional information
Funding
References
- Avellone, G., Barchi, M. R., Catalano, R., Gasparo Morticelli, M., & Sulli, A. (2010). Interference between shallow and deep-seated structures in the Sicilian fold and thrust belt, Italy. Journal of the Geological Society, 167(1). https://doi.org/10.1144/0016-76492008-163
- Bozzolo, D., & Pamini, R. (1982). Modello matematico per lo studio della caduta dei massi, Laboratorio di fisica terrestre-ICTS, Dipartimento Pubblica Educazione, Lugano-Trevano (89 pp).
- Brandolini, P., Cappadonia, C., Luberti, G. M., Donadio, C., Stamatopoulos, L., Di Maggio, C., Faccini, F., Stanislao, C., Vergari, F., Paliaga, G., Agnesi, V., Alevizos, G., & Del Monte, M. (2019). Geomorphology of the anthropocene in mediterranean urban areas. Progress in Physical Geography: Earth and Environment, https://doi.org/10.1177/0309133319881108
- Cafiso, F., & Cappadonia, C. (2019). Landslide inventory and rockfall risk assessment of a strategic urban area (Palermo, Sicily). Rendiconti Online Della Società Geologica Italiana, 48, 96–105. https://doi.org/10.3301/ROL.2019.42
- Cafiso, F., Cappadonia, C., & Ferraro, R. (2020). La Riserva Naturale Orientata di Monte Pellegrino (Palermo): analisi e valutazione della pericolosità da crolli nel versante sud-occidentale. XXVII Convegno Nazionale di Geotecnica, 7-9 Luglio 2021, Reggio Calabria (8pp.) (accepted contribution).
- Calligaris, C., Tariq, S., Khan, H., & Poretti, G. (2017). Landslide susceptibility analysis in Arandu area Shigar Valley, CKNP (Gilgit-Baltistan- Pakistan). In M. Mikos, B. Tiwari, Y. Yin, & K. Sassa (Eds.), Advancing Culture of Living with landslides (pp. 909–916). Springer International Publishing. https://doi.org/10.1007/978-3-319-53498-5_103
- Cappadonia, C., Di Maggio, C., Agate, M., & Agnesi, V. (2020). Geomorphology of the urban area of Palermo (Italy). Journal of Maps, 16(2), 274–284. https://doi.org/10.1080/17445647.2020.1739154
- Catalano, R., Avellone, G., Basilone, L., Contino, A., Agate, M., Di Maggio, C., Lo Iacono, C., Sulli, A., Gugliotta, C., Gasparo Morticelli, M., Caputo, G., Albanese, C., Di Maio, D., Vattano, M., & Lo Cicero, G. (2013b). Note Illustrative della Carta Geologica d’Italia alla scala 1: 50.000, F. 595 Palermo. 218 pp., SystemCard. Roma.
- Catalano, R., Valenti, V., Albanese, C., Accaino, F., Sulli, A., Tinivella, U., Gasparo Morticelli, M., Zanolla, C., & Giustiniani, M. (2013a). Sicily's fold-thrust belt and slab roll-back: The SI.RI.PRO. Seismic crustal transect. Journal of the Geological Society, 170(3), 451–464. https://doi.org/10.1144/jgs2012-099
- Copons, R., & Vilaplana, J. M. (2008). Rockfall susceptibility zoning at a large scale: From geomorphological inventory to preliminary land use planning. Engineering Geology, 102(3-4), 142–151. https://doi.org/10.1016/j.enggeo.2008.03.020
- Copons, R., Vilaplana, J. M., & Linares, R. (2009). Rockfall travel distance analysis by using empirical models (Solà d’Andorra la Vella, central Pyrenees). Natural Hazards and Earth System Sciences, 9(6), 2107–2118. https://doi.org/10.5194/nhess-9-2107-2009
- Corominas, J. (1996). The angle of reach as a mobility index for small and large landslides. Canadian Geotechnical Journal, 33(2), 260–271. https://doi.org/10.1139/t96-005 doi:10.1139/t96-005
- Crosta, G. B., & Agliardi, F. (2003). A methodology for physically based rockfall hazard assessment. Natural Hazards and Earth System Science, 3(5), 407–422. https://doi.org/10.5194/nhess-3-407-2003
- Crosta, G. B., & Agliardi, F. (2004). Parametric evaluation of 3D dispersion of rockfall trajectories. Natural Hazards and Earth System Science, 4(4), 583–598. https://doi.org/10.5194/nhess-4-583-2004
- Cruden, D. M., & Varnes, D. J. (1996). Landslide types and processes, transportation research Board, U.S. National Academy of Sciences. Special Report, 247, 36–75.
- Cundall, P. A., & Hart, D. H. (1993). Numerical modeling of discontinua. Comprehensive Rock Engineering, 2, 231–243. https://doi.org/10.1016/B978-0-08-040615-2.50015-0
- Di Maggio, C., Madonia, G., Vattano, M., Agnesi, V., & Monteleone, S. (2017). Geomorphological evolution of western Sicily, Italy. Geologica Carpathica, 68(1), 80–93. https://doi.org/10.1515/geoca-2017-0007
- Evans, S. G., & Hungr, O. (1993). The assessment of rock fall hazard at the base of the talus slope. Canadian Geotechnical Journal, 30(4), 620–636. https://doi.org/10.1139/t93-054
- Fell, R., Corominas, J., Bonnard, C., Cascini, L., Leroi, E., & Savage, W. Z. (2008). Guidelines for landslide susceptibility, hazard and risk zoning for land-use planning. Engineering Geology, 102(3–4), 99–111. https://doi.org/10.1016/j.enggeo.2008.03.014
- Filipello, A., Giuliani, A., & Mandrone, G. (2010). Rock slopes failure susceptibility analysis: From remote sensing measurements to geographic information system raster modules. American Journal of Environmental Sciences, 6(6), 489–494. https://doi.org/10.3844/ajessp.2010.489.494
- Frattini, P., Crosta, G., Carrara, A., & Agliardi, F. (2008). Assessment of rockfall susceptibility by integrating statistical and physically-based approaches. Geomorphology, 94(3–4), 419–437. https://doi.org/10.1016/j.geomorph.2006.10.037
- Gugliotta, C., Avellone, G., Gasparo Morticelli, M., & Agate, M. (2010). Constraining the onset and development of “deep-seated” tectonics in the Sicilian thrust belt; field data from northern Sicily. Rendiconti Online Società Geologica Italiana, 11(2), 737–738.
- Guzzetti, F., Stark, C. P., & Salvati, P. (2005). Evaluation of flood and landslide risk to the population of Italy. Environmental Management, 36(1), 15–36. https://doi.org/10.1007/s00267-003-0257-1
- Heim, A. (1932). Bergsturz und Menschenleben., Fretz und Wasmuth, Zürich, p. 218.
- Heinimann, H. R., Holtenstein, K., Kienholz, H., Krummenhacher, B., & Mani, P. (1998). Methoden zur Analyse und Bewertung von Naturgefahren. Umwelt-Materialien Nr. 85, Naturgefahren, BUWAL, Bern, 248 pp.
- Hoek, E., & Bray, J. W. (1981). Rock slope engineering (3rd ed., p. 364). The institution of Mining and Metallurgy.
- Hunter, G., & Fell, R. (2003). Travel distance angle for “rapid” landslides in constructed and natural soil slopes. Can Geotech J, 40(6), 1123–1141. https://doi.org/10.1139/t03-061
- Hutchinson, J. N. (1988). General report: Morphological and geotechnical parameters of landslides in relation to geology and hydrogeology. Proceedings, Fifth International Symposium on Landslides (Ed: Bonnard, C.), 1, 3-35. Rotterdam: Balkema.
- ISRM - International society for rock mechanics commission on standardization of laboratory and field tests. (1978). Suggested methods for the quantitative description of discontinuities in rock masses. International Journal of Rock Mechanics and Mining Sciences, 15(6), 319–368. https://doi.org/10.1016/0148-9062(78)91472-9
- Jaboyedoff, M., & Labiouse, V. (2011). Technical note: Preliminary estimation of rockfall runout zones. Natural Hazards and Earth System Science, 11(3), 819–828. https://doi.org/10.5194/nhess-11-819-2011
- Jomelli, V., & Francou, B. (2000). Comparing the characteristics of rockfall talus and snow avalanche landforms in an Alpine environment using a new methodological approach: Massif des Ecrins, French Alps. Geomorphology, 35, 181–192. https://doi.org/10.1016/S0169-555X(00)00035-0
- Kanwal, S., Atif, S., & Shafiq, M. (2017). GIS based landslide susceptibility mapping of northern areas of Pakistan, a case study of Shigar and Shyok Basins. Geomatics, Natural Hazards and Risk, 8(2), 348–366. https://doi.org/10.1080/19475705.2016.1220023
- Lo Iacono, C., Sulli, A., & Agate, M. (2014). Submarine canyons of north-western Sicily (Southern Tyrrhenian Sea): variability in morphology, sedimentary processes and evolution on a tectonically active margin. Deep Sea Research Part II: Topical Studies in Oceanography, 104, 93–105. https://doi.org/10.1016/j.dsr2.2013.06.018
- Meiβl, G. (1998). Modellierung der reichweite von Felsstürzen: fallbeispiele zur GIS gestütezen gefahrenbeurteilung aus dem Bayerischen und Tiroler Alpernraum. Innsbrucker Geographische Studien, Band 28, Universitat Innsbruck, Innsbruck, Austria.
- Mineo, S., & Pappalardo, G. (2019). Sustainable fruition of cultural heritage in areas affected by rockfalls. Sustainability, 12(1), 296. https://doi.org/10.3390/su12010296
- Mineo, S., Pappalardo, G., D’Urso, A., & Calcaterra, D. (2017). Event tree analysis for rockfall risk assessment along a strategic mountainous transportation route. Environmental Earth Sciences, 76(17), 620. https://doi.org/10.1007/s12665-017-6958-1
- Mineo, S., Pappalardo, G., Mangiameli, M., Campolo, S., & Mussumeci, G. (2018). Rockfall analysis for Preliminary hazard assessment of the Cliff of Taormina Saracen Castle (Sicily). Sustainability, 10(2), 417. https://doi.org/10.3390/su10020417
- Onofri, R., & Candian, C. (1979). Indagine sui limiti di massima invasione dei blocchi rocciosi franati durante il sisma del Friuli del 1976. Regione Autonoma Friuli-Venezia-Giulia, CLUET, 42 pp.
- Pfeiffer, T. J., & Bowen, T. D. (1989). Computer simulation of rockfalls. Environmental and Engineering Geoscience, XXVI(1), 135–146. https://doi.org/10.2113/gseegeosci.xxvi.1.135
- Regione Siciliana Assessorato Territorio e Ambiente – ARTA. (2006). Piano Stralcio per l’Assetto Idrogeologico (P.A.I.) - Area Territoriale tra bacino F. Oreto e Punta Raisi (040). Relazione e Carte dei Dissesti e della Pericolosità e del Rischio - 595010. http://www.sitr.regione.sicilia.it/pai/bac039-040.htm
- Rocscience. (2012). Dips v.5.109 graphical and statistical analysis of orientation data. Rocscience Inc., Toronto.
- Scioldo, G. (1991). Rotomap: Analisi statistica del rotolamento dei massi. In G. Guariso (Ed.), Guida di informatica ambientale (pp. 81–84). Patron.
- Scioldo, G. (2006). User guide: ISOMAP & ROTOMAP—3D surface modelling and rockfall analysis. Retrieved April 28, 2020, from http://www.geoandsoft.com/english/download.htm
- Soeters, R., & VanWesten, C. J. (1996). Slope stability: Recognition, analysis and zonation. In A. K. Turner, & R. L. Shuster (Eds.), Landslides: Investigation and mitigation (pp. 129–177). Trasportation research board National research council.
- Toppe, R. (1987). Terrain model: A tool for natural hazard mapping. In B. Salm, & H. Gubler (Eds.), Avalanche formation, movement and effects (162, pp. 629–638). Int Ass. Of Hydrological Sciences.