
ABSTRACT
Walking provides a number of health, social and environmental benefits for urban sustainability, which is why it has become attractive from the perspective of sustainable transport planning. The concept of walkability is related with the built environment and land use to facilitate walking to activities in an area. The aim of this work is to provide a set of street walking quality maps for the ‘Centro’ district in Madrid (Spain), covering four categories of walking needs: attractiveness, comfort, safety and accessibility. They classify the streets from least to most walkable in relation to each other. The maps are built using 21 urban environmental factors selected from the literature. The values for each factor are computed in each street from open access databases and combined following the PROMETHEE II method function in order to assign a street value for each of the four classes of walking needs.
KEYWORDS:
1. Introduction
As mobility levels increased, cities gradually transformed to meet the needs of motorised modes, while active modes such as walking were often pushed into second place. According to the literature, the consequences of motor-oriented developments that may discourage walking include changes in land-use mixes, deterioration and reduction of public spaces, decrease in pedestrian connectivity, and an increase in obstacles to walking in the city (CitationDelso et al., 2019; CitationGarcía-Palomares, 2010). However, walking provides a number of health, social and environmental benefits for urban sustainability. From the mobility perspective, increasing the active-mode share reduces the use of motorised modes and their negative consequences such as air pollution, land take and traffic congestion (CitationKim & Macdonald, 2016). From a socio-economic viewpoint, walking does not rely on non-renewable resources and is accessible to most of the population regardless of their income level (CitationInternational Transport Forum, 2012). From the health standpoint, the literature documents benefits in social interactions, mental health and physical activity (CitationMoniruzzaman et al., 2014; CitationWorld Health Organization, 2017).
For all these reasons, active travel has become more attractive in recent years from the standpoint of sustainable transport planning. Walking – which in the past was viewed as part of a trip chain in a motorised mode – is now considered a stand-alone mode (CitationLitman, 2003). Numerous recent urban planning initiatives also revolve around active modes and seek to improve the quality and quantity of spaces dedicated to active mobility (CitationDelso et al., 2017, Citation2018), since the design of more pedestrian-friendly built environments can increase the convenience of walking (CitationBlecic et al., 2017). The literature contains a large body of research on the environmental factors that influence walking (CitationEwing & Handy, 2009; CitationLeslie et al., 2007; CitationSaelens et al., 2003; CitationTalavera-Garcia & Soria-Lara, 2015). The concept of walkability was developed against this backdrop. According to CitationFitzsimons D’Arcy (2013), the concept of walkability was first introduced in the early 90s, and was used by urban designers and spatial planners (e.g. CitationSouthworth & Ben-Joseph, 1995; CitationSouthworth & Owens, 1993), and in the public health (e.g. CitationLeslie et al., 2007; CitationSaelens et al., 2003) and transport planning disciplines (e.g. CitationHenson, 2000; CitationStangl, 2008). CitationLee and Moudon (2004) considered these research fields to be complementary and useful for improving the understanding of the determinants of physically active travel from a multidisciplinary approach (CitationDelso, 2020). This multidisciplinarity may explain why walkability does not have a single definition in the literature. This paper mentions two of the most cited definitions in the literature: CitationFitzsimons D’Arcy (2013), for whom ‘the core meaning of the term relates to facilitating and encouraging walking trips by providing both attractive routes and destinations and functional paths and routes’; and CitationLeslie et al. (2007), who define walkability as ‘the extent to which characteristics of the built environment and land use may or may not be conducive to residents in the area walking for either leisure, exercise or recreation, to access services, or to travel to work’.
The walkability of an area is therefore a measurable set of its characteristics, and the literature provides different sets of indicators intended for use by urban planners and designers. A correct measurement of the factors that describe the qualities of the urban environment that influence the public’s desire to walk should be supported on objective, relevant and usable indices and scales (CitationEwing & Handy, 2009; CitationLeslie et al., 2007; CitationSaelens et al., 2003). One widely used method for walkability analysis is WalkScore® (CitationDuncan et al., 2013; CitationKnight et al., 2018). It measures the walkable access to daily amenities by analysing hundreds of walking routes, using a distance-decay function to assign points to more distant amenities and measuring pedestrian-friendliness by analysing population density and road metrics such as block length and intersection density. The final score ranges from 0 (car dependent) to 100 (maximum walkability) (CitationWalk Score, 2014). In the Spanish context, CitationGullón et al. (2017) measured walkability in the municipality of Madrid using a composite index of four indicators based on an adaptation of the one proposed by CitationCreatore et al. (2016): Residential Density (occupied dwellings/km2), Population Density (Residents/km2), Retail Destinations (retail and services destinations/km2), and Street Connectivity (kernel density in 3 × 3 m pixels of the density of street intersections). Also in Madrid, but restricted to three neighbourhoods (Carabanchel, Ciudad Lineal and Chamartin), CitationGullón et al. (2015) assessed the walking and cycling environments in streets using the audit tool SPACES (CitationPikora et al., 2002), which takes into account the walking/cycling surface, characteristics of the streets, permeability, personal safety, traffic safety, streetscape, views and facilities. In all the research works reviewed, the quality of the street segments that influence the practice and experience of walking is an important part of the walkability concept. CitationTalavera-Garcia and Soria-Lara (2015) reviewed 61 academic articles on the topic of walkability in order to identify relevant pedestrian factors from the literature on active mobility and built environment. They then selected 48 factors and grouped them according to four categories of walking needs: accessibility, security, comfort, and attractiveness (see ). According to the review of CitationTalavera-Garcia and Soria-Lara (2015), accessibility refers to basic factors linked to walkways and urban structure, such as intersections or pavement width; safety refers to built-environmental factors that directly influence whether or not pedestrians feel safe, like lightning or traffic calming; comfort involves a range of factors such as climate or presence of trees; and attractiveness is related to social interaction, for example the presence of public spaces or shops.
Table 1. Selected factors grouped by walking needs.
Walkability-related factors – those that contribute to the quality of street segments in terms of the practice and experience of walking – have a marked spatial character, hence the importance of having an adequate map on which to represent them for planning purposes. Maps are communication and demonstration tools for transport planning and diagnosis, but they can also be useful for creating common frameworks for stakeholder discussions during policy-making (CitationArranz-López et al., 2017). The aim of this work is to provide a set of maps for the ‘Centro’ district in Madrid (Spain) Main Map that classify the streets from poorest to highest quality based on the practice and experience of walking. These maps spatially represent the mappable factors proposed by CitationTalavera-Garcia and Soria-Lara (2015), covering the four categories of walking needs: attractiveness, comfort, safety and accessibility. The set of factors proposed by these authors is a comprehensive list drawn from an extensive literature review that includes most of the built environment factors at the street level listed in other methodologies in the literature. Based on this strong theoretical framework, the results of this study provide a valuable set of maps of street segment quality in a case study that has not previously been reported. The study area is of particular interest, as it is located in a zone that is currently undergoing a profound transformation. Various municipal policies such as Plan A (CitationAyuntamiento de Madrid, 2016), partially implemented in 2018, and its redesign Madrid 360 (CitationAyuntamiento de Madrid, 2019a), scheduled for launch at the end of 2019, include the improvement of public space for pedestrians among their main objectives. These policies have attracted considerable attention from citizens and local governments, and can therefore also be expected to be of interest in transport planning research.
2. Method
2.1. Selection of factors
The walking quality of the streets in the ‘Centro’ district of Madrid is analysed by considering the factors relating to the urban environment described in previous studies. From all these factors, those listed in CitationTalavera-Garcia and Soria-Lara (2015) are mappable, and were selected to build the map. shows the selected factors grouped by walking needs:
Some factors have been discarded for a variety of reasons. For example, crosswalks and security camera data are incomplete. This is also the case for information on street furniture such as benches and street lights. The shadow cast by buildings has not been taken into account as it changes throughout the day, and this variable is considered through the height of the buildings. Land use is not applicable in the centre of Madrid because it is similar in the whole area (commercial-residential mix). No information was obtained on the cleanliness of the streets and the type of pavement, although both these factors are very homogeneous throughout the centre of Madrid. Finally, one of the most important variables, namely pollution, has not been included, since it is not available in GIS layer. Fortunately, there is information on traffic volume, which is closely related.
After selecting the factors, the corresponding value is calculated for each street according to the set of indicators described below.
2.2. Building the street layer
Three base layers were used to obtain the GIS polygon layer of the streets: (i) a layer representing the polygon corresponding to the entire area belonging to the ‘Centro’ district of Madrid (CitationAyuntamiento de Madrid, 2017); (ii) a polygon layer corresponding to the blocks in the ‘Centro’ district (CitationAyuntamiento de Madrid, 2017); and (iii) a linear layer representing the street axes (CitationInstituto de Estadística de la Comunidad de Madrid, 2018).
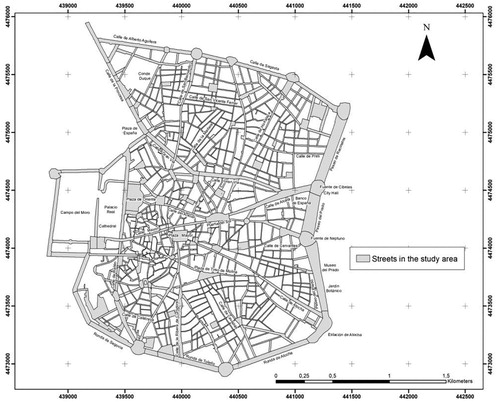
A new layer was obtained for the entire area and the block layer for the ‘Centro’ district representing the total space occupied by the streets bounded by the blocks of buildings. This polygon was divided into several other polygons through a series of geoprocessing unions and selections. A polygon layer was finally obtained (see ), in which each polygon is identified with the name and the official code of the street. Finally, the length of the axis is added to each street. The axis length is calculated from node to node in the street axe network.
Figure 1. Study area.
2.3. Indicator calculations
The indicators used to evaluate each factor and how they were calculated are described below.
2.3.1. Walking need: attractiveness
- Green area: green area as a percentage of the total street area.
- Public transport: number of bus and underground stations on each street, divided by the street length.
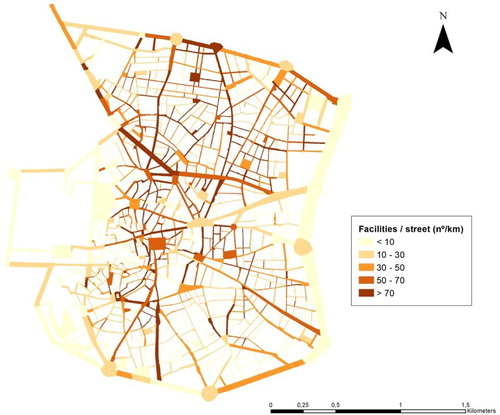
- Facilities: number of food stores, commercial establishments, and restaurants or similar establishments on each street, divided by the street length ().
- Pedestrian street: each street is marked according to whether it is pedestrian (value equal to 1) or not (value equal to 0).
- Furniture: number of furniture elements (bus shelters, underground accesses, permanent pavement constructions, kiosks, street-level and raised warehouses, lifts), divided by the street length.
- Public spaces: number of hospitals, police stations, etc. in each street, divided by the street length.
- Amenities: number of playgrounds, museums, libraries, cinemas, etc. in each street, divided by the street length.
- Art: number of monuments and fountains (tourist attraction) on each street.
Figure 2. Number of facilities per street length.
2.3.2. Walking need: comfort
- Shade: the street axes were first divided into COGO lines and the aspect values of the street axes were calculated. They were then reclassified into: N-S, NW-SE, NE-SW, E-W, ALL (roundabouts and squares). The shade values are assigned according to this classification: 1 to N-S and NE-SW; 0 to NE-SW and E-W; and 0.5 to NW-SE and ALL.
- Noise: the equivalent continuous sound level from 7 am to 7 pm, classified into six levels (<55 dBA; 55–60 dBA; 60–65 dBA; 65–70 dBA; 70–75 dBA and >75 dBA) was obtained from the Madrid Strategic Noise Map 2016, (CitationAyuntamiento de Madrid, 2018) and added to each street.
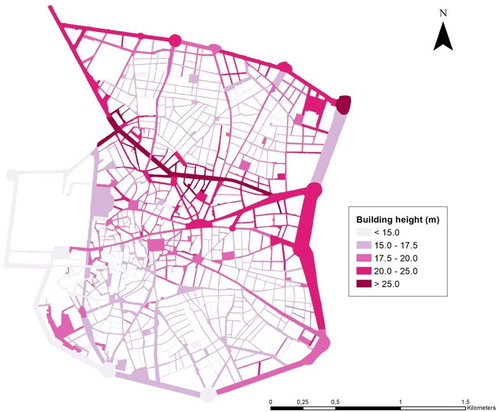
- Building height (): the building height was added to the buildings layer according to the following procedure: (i) the corresponding DEM is generated from LiDAR data (first return) and this height data was added to the buildings layer; (ii) the building height was calculated according to the number of floors (each floor was assigned a height of 3 metres); and finally (iii) the two heights were compared. If the two values were similar, the height assigned is the one obtained from the LiDAR data. If the differences were significant, the height assigned is the one obtained from the number of floors. The mean height value per street is then calculated.
- Trees: number of trees on each street, divided by the street length.
- Street width: on the block and street axis layers, the distance from the axis to the block border is calculated and multiplied by two.
Figure 3. Building height.
2.3.3. Walking need: safety
- Fence: length of the line formed by the bollards in the street, divided by the street length.
- Traffic intensity (): average traffic intensity was extracted from the historical data offered by Madrid City Council in its SICTRAM database (Sistema Integral de Control de Tráfico de Madrid) (CitationAyuntamiento de Madrid, 2019b). Intensity values (vehicles/hour) are measured at 221 measurement points in 97 streets. The average monthly value (May) was calculated for each point using all the validated values from the database. The intensity values of all the points that have the same direction were averaged in each street section, and the values in both directions were then added together.
Figure 4. Traffic intensity.
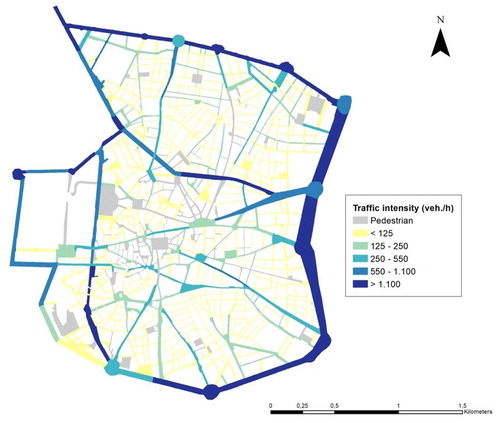
As not all the streets have traffic values, the values were assigned as follows: (i) the traffic intensity data were reclassified into five quantile classes, (ii) the street sections with no values in the traffic intensity database were assigned to one of these five classes. Each street was assigned the value of the nearest street with a similar traffic intensity value and characteristics in terms of street width and noise.
- Vehicle parking: length of areas allocated for car parking, divided by the street length.
- Traffic management: number of pedestrian traffic lights in the street, divided by the street length.
2.3.4. Walking need: accessibility
- Slope: the altitude value was added to the points corresponding to the ends of the street axes, and this information was attached to the line layer. The slope was then calculated as the difference in altitude divided by length. Finally, the mean value was obtained for each street.
- Obstacles: number of furniture elements (bus shelters, underground access, permanent pavement constructions, kiosks, levelled and elevated warehouses, lifts), divided by the street length.
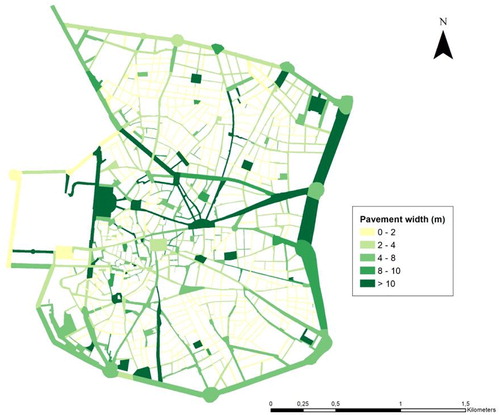
- Pavement width (): The pavement layer is intersected with the street polygons layer and the area is computed. This value corresponds to the two pavements, and then it is divided by 2. We assume that the pavement resembles a parallelogram; therefore we divide the area by the length of the street, to get an average width. In pedestrian streets the pavement width is equal to the width of the street.
- Intersection distance: number of street intersections divided by the street length.
Figure 5. Pavement width.
The data required for public transport, pedestrian, furniture, public spaces, trees, street width, fence, traffic management, vehicle parking, obstacles, intersection distance and pavement width were obtained from an open access database on the municipality of Madrid (CitationAyuntamiento de Madrid, 2017). The data for facilities, amenities and art were obtained from Open Street Map (CitationOSM Contributors, 2018). A digital terrain model (DTM) was generated from LiDAR data (CitationIGN, 2015) and used to compute shade and slope factors. Finally, building height was calculated from LiDAR data 0.5 points/m2 (CitationIGN, 2015) and land registry information (CitationDirección General del Catastro, 2018).
All the variables described by points, such as facilities, trees, intersections or traffic lights were calculated using a spatial union with the street polygons. The value for each street is the sum of the variables that fall within each polygon. For variables described by lines, such as bollard lines or parking lines, the lines were first intersected with the street polygons to obtain the corresponding arcs for each polygon, the length was calculated, and they were then merged spatially to obtain the total length of these lines.
2.4. Aggregating the values
After obtaining all the values for each indicator, the next step was to aggregate them and assign a value to each street in order to rank them for each of the four walking needs classes defined by CitationTalavera-Garcia and Soria-Lara (2015) in their classification of urban environmental factors.
This was done using the PROMETHEE II method (Preference Ranking Organization METHod for Enrichment Evaluations) (CitationBrans & Vincke, 1985), which is an outranking MCDA method used to determine the best out of a set of actions based on a number of criteria. The method has been applied in many fields (see as examples: CitationAnagnostopoulos et al., 2003; CitationLiu et al., 2019; CitationVulevic & Dragovic, 2017), due to features such as the clear method and simple conception, and the option of verifying the stability of the results (CitationBrans et al., 1986).
The application of the method requires: (i) the determination of the type of criterion (maximum or minimum). Most of the factors considered (criteria) are maximised, as the objective is to rank streets and identify the most walkable. Noise, traffic intensity, slope and obstacles are minimised (see ); (ii) determination of the weights of the decision criteria wj. PROMETHEE does not provide specific guidelines for determining these weights but assumes that the decision-maker is able to weigh the criteria appropriately. In our case, the wj values were obtained from a survey of 12 transport planning experts, who assigned a value from 1 to 5 to each factor; the final wj value for each factor is the statistical average for the set of answers. The wj values are listed in . (iii) Determination of the preference function, which represents the difference between the two evaluations. There is a preference function for each factor, according to the data ().
Table 2. Evaluation matrix for the selected factors, grouped by walking needs.
The method was computed using Visual Promethee 1.4 Academic Edition software (CitationVPSolutions, 2013), which determines the adequate preference function and preference (p) thresholds. It calculates the global preference index, the positive outranking flow φ+(a) and the negative outranking flow φ-(a), and finally the net outranking flow (φ(a) = φ+(a) − φ-(a)) to rank the streets for each walking need.
Finally, to represent the walkability needs maps, the φ(a) values are converted to a scale of 0–1, where 1 means a high walkability value.
3. Resulting street walking quality maps
The result of this work is a set of four street walking quality maps for the ‘Centro’ district in Madrid (Spain) (Main Map). They show the streets classified from least to most walkable, based on four categories of walking needs: attractiveness, comfort, safety and accessibility, proposed by CitationTalavera-Garcia and Soria-Lara (2015). These four categories include 21 mappable walking factors reported in the literature: green, public transport, facilities, pedestrian street, furniture, public spaces, amenities, art, shade, noise, building height, trees, street width, fence, traffic intensity, vehicle parking, traffic management, slope, obstacles, pavement width, intersection distance.
The four maps covering the four categories of walking needs are included on a single sheet. For the symbology of each map, the values are classified into ten quantile classes and the legend is in the form of a stretched colour ramp.
An interactive version of the map is available at: http://despacio.transyt-projects.com/mapas/Calidad-calles/
4. Discussion and conclusions
The street walking quality maps for the ‘Centro’ district in Madrid (Spain) presented in the Main Map provide a valuable set of maps of street segment quality in a case study that has not previously been reported. The streets are classified from least to most walkable, based on four categories of walking needs: attractiveness, comfort, safety and accessibility, proposed by CitationTalavera-Garcia and Soria-Lara (2015).
In general terms, the attractiveness in the district is high, due to the predominance of cultural and commercial activities. The historical area of Madrid is also located in the ‘Centro’ district, and is characterised by the presence of facilities and amenities, as well as being very well served by public transport (a dense underground, bus and rail network). The streets differentiated by their high attractiveness value are generally pedestrian streets with a wide range of amenities and facilities. The presence of a large number of public transport stops or stations (usually not located in pedestrian streets) also significantly increases the level of attractiveness. Everywhere in the district, the streets with the lowest values are located mainly between main streets, as they have few facilities, amenities, green areas or public transport services. The areas with the lowest values are mainly in the south, a less commercial area with fewer historical attractions. The comfort map shows medium values in general. As mentioned previously, this is because it is a commercial and leisure zone, which attracts motorised traffic, making it noisy as a result. The city’s historical centre is also characterised by narrow intricate streets, which does not contribute to improving comfort. Tree presence and building height compensate for these factors in some areas. Aspect also has a significant influence, and pedestrian streets, squares and N-S streets have the highest values. Street safety values are highly influenced by traffic intensity, which explains why safety is low on the main axes in the district. The highest values are found in pedestrian streets or squares, and in the interior network of narrow streets, except in the northwest and southeast parts of the district. Many of these interior streets also have on-street parking and bollards on the pavement that increase levels of safety. Pavement width plays an important role in accessibility values (), so higher accessibility values are found for major axes and lower values in the interior network. Intersection distance contributes to this effect, as this interior network has shorter street sections and frequent intersections. This general situation is modified by slope, which also has a high weight in the result and reduces the accessibility level in some main streets. Finally, it is worth noting the concurrence of high attractiveness and low safety values, while low accessibility also generally coincides with high safety to some extent in the interior network. The streets with a high attractiveness value are generally commercial streets with a wide array of services, while less commercial streets with low traffic intensity are considered to be safer. As a rule, streets with low accessibility are short and intricate with narrow pavements and low traffic intensity levels (high safety).
The methodology is based in the measurement of 21 urban environmental factors (indicators) selected from the literature and combined following the PROMETHEE II method function, which is fed with expert-based weights. However, recent studies on street walkability have calibrated the physical or visual indicators using individual travel behaviour data obtained either from subjective values (e.g. CitationFancello et al., 2020) or from geo data, such as GPS routes (e.g. CitationDean et al., 2020). Although our methodology is supported by a strong body of literature, an interesting future work line could be to explore differences between the expert-based aggregation proposed in this paper and individual travel behaviour calibrations based in GPS tracks.
The methodology was applied to a specific case study, and proved to be a useful tool for measuring street walking quality as an element of walkability. High-resolution data (at street level) is needed to replicate it. The underlying data in this study have been downloaded from the open sources detailed in the references, and the accuracy of the maps therefore depends on the sources. We have detected that the information is in some cases out of date or incomplete. Further work should include fieldwork to increase the reliability of the final product. However, the use of open databases has advantages, the first of which is that no resources needed to be allocated to data collection, and the map can easily be updated and/or compared with other districts in the city.
The PROMETHEE method is used to decide which action is better compared to others based on a number of criteria, so the maps classify the streets from least to most walking quality in relation to each other within the district. A consequence of this methodological approach is that the maps cannot be used to compare this district with other cities. However, these street walking quality maps offer valuable insights to allow urban planners to measure improvements deriving from the implementation of urban planning measures over time – even there is the possibility of adding it to automated analysis systems- to encourage active travel in the study area. Streets where each of the four walking needs can be improved can easily be identified with the map, enabling measures to be put in place to potentially reduce differences in the ‘Centro’ district, or even to increase overall walkability: (i) relocation or new locations for public transport stops, pedestrian streets, green areas, public spaces, furniture, trees, fences or obstacles; (ii) pavement widening; and (iii) changes in motorised traffic management to reduce traffic intensity and noise. In fact, the study area is of particular interest for mobility planning as it is located in a zone that is currently undergoing a radical transformation as a result of municipal initiatives aimed at improving air quality and the public space.
5. Software
ESRI ArcGIS 10.X and ESRI ArcInfo Workstation were used as the analysis platform for this project. ESRI ArcGIS 10.X was used to create the maps.
TJOM_1829114_Main Map.pdf
Download PDF (3.4 MB)Acknowledgements
This paper was produced under the framework of the following projects: ‘DESPACIO’ (TRA2017-88058-R) funded by the Spanish Ministry of Economy, Industry and Competitiveness in the ‘Programa Estatal de I + D+i Orientada a los Retos de la Sociedad’ and ‘Desarrollo de aplicaciones SIG para la implementación de indicadores de fragmentación urbana y mejora de la movilidad’ funded by the Universidad Politécnica de Madrid, research project no. RP151320028.
Disclosure statement
No potential conflict of interest was reported by the author(s).
Additional information
Funding
References
- Anagnostopoulos, K., Giannopoulou, M., & Roukounis, Y. (2003). Multicriteria evaluation of transportation infrastructure projects: An application of PROMETHEE and GAIA methods. Advances in Transport, 14, 599–608. https://doi.org/10.2495/UT030591
- Arranz-López, A., Soria-Lara, J. A., López-Escolano, C., & Pueyo Campos, Á. (2017). Making ‘retail mobility environments’ visible for collaborative transport planning. Journal of Maps, 13(1), 90–100. https://doi.org/10.1080/17445647.2017.1383945
- Ayuntamiento de Madrid. (2016). Plan A. Plan de Calidad del Aire y Cambio Climático 2017-2020. https://www.madrid.es/UnidadesDescentralizadas/Sostenibilidad/CalidadAire/Ficheros/PlanACalidadAire2019.pdf
- Ayuntamiento de Madrid. (2017). Portal de datos abiertos del Ayuntamiento de Madrid. Cartografía municipal por distritos a escala 1:1000. https://datos.madrid.es/portal/site/egob/menuitem.c05c1f754a33a9fbe4b2e4b284f1a5a0/?vgnextoid=a4f36d34fa86c410VgnVCM2000000c205a0aRCRD&vgnextchannel=374512b9ace9f310VgnVCM100000171f5a0aRCRD
- Ayuntamiento de Madrid. (2018). Mapa Estratégico de Ruido de la Ciudad de Madrid 2016. https://www.madrid.es/UnidadesDescentralizadas/Sostenibilidad/Ruido/MapaRuido/MapaRuido2016/Ficheros/MemoriaMER2016.pdf
- Ayuntamiento de Madrid. (2019a). Madrid 360. Avance de la estrategia de sostenibilidad ambiental. https://www.madrid.es/UnidadesDescentralizadas/UDCMedios/noticias/2019/09%20septiembre/30Lunes/Notasprensa/Presentaci%C3%B3n%20Madrid%20360/ficheros/Avance-Estrategia-Sostenibilidad-Ambiental-Madrid-360.pdf
- Ayuntamiento de Madrid. (2019b). Tráfico. Histórico de datos del tráfico desde 2013. https://datos.madrid.es/portal/site/egob/menuitem.c05c1f754a33a9fbe4b2e4b284f1a5a0/?vgnextoid=33cb30c367e78410VgnVCM1000000b205a0aRCRD&vgnextchannel=374512b9ace9f310VgnVCM100000171f5a0aRCRD&vgnextfmt=default
- Blecic, I., Canu, D., Cecchini, A., Congiu, T., & Fancello, G. (2017). Walkability and street intersections in rural-urban fringes: A decision aiding evaluation procedure. Sustainability, 9(6), 883. https://doi.org/10.3390/su9060883
- Brans, J. P., & Vincke, P. (1985). A preference ranking organization method (The Promethee method for multiple criteria decision-making). Management Science, 31(6), 647–656. https://doi.org/10.1287/mnsc.31.6.647
- Brans, J. P., Vincke, P., & Mareschal, B. (1986). How to select and how to rank projects: The Promethee method. European Journal of Operational Research, 24(2), 228–238. https://doi.org/10.1016/0377-2217(86)90044-5
- Creatore Maria I., Glazier Richard H., Moineddin Rahim, Fazli Ghazal S., Johns Ashley, Gozdyra Peter, Matheson Flora I., Kaufman-Shriqui Vered, Rosella Laura C., Manuel Doug G., Booth Gillian L. (2016). Association of neighborhood walkability with change in overweight, obesity, and diabetes. Jama, 315(20), 2211–2220. https://doi.org/10.1001/jama.2016.5898
- Dean, J., Biglieri, S., Drescher, M., Garnett, A., Glover, T., & Casello, J. (2020). Thinking relationally about built environments and walkability: A study of adult walking behavior in Waterloo, Ontario. Health & Place, 64, 102352. https://doi.org/10.1016/j.healthplace.2020.102352
- Delso, J. (2020). Developing methodologies for assessing pedestrian mobility based on landscape connectivity approaches [Doctoral dissertation]. Universidad Politécnica de Madrid.
- Delso, J., Martín, B., & Ortega, E. (2018). A new procedure using network analysis and kernel density estimations to evaluate the effect of urban configurations on pedestrian mobility. The case study of Vitoria–Gasteiz. Journal of Transport Geography, 67, 61–72. https://doi.org/10.1016/j.jtrangeo.2018.02.001
- Delso, J., Martín, B., Ortega, E., & Otero, I. (2017). A model for assessing pedestrian corridors. Application to Vitoria-Gasteiz city (Spain). Sustainability, 9(3), 434. https://doi.org/10.3390/su9030434
- Delso, J., Martín, B., Ortega, E., & Van De Weghe, N. (2019). Integrating pedestrian-habitat models and network kernel density estimations to measure street pedestrian suitability. Sustainable Cities and Society, 51, 101736. https://doi.org/10.1016/j.scs.2019.101736
- Dirección General del Catastro. (2018). Cartografía Vectorial. https://www.sedecatastro.gob.es/Accesos/SECAccDescargaDatos.aspx
- Duncan, D. T., Aldstadt, J., Whalen, J., & Melly, S. J. (2013). Validation of walk scores and transit scores for estimating neighborhood walkability and transit availability: A small-area analysis. GeoJournal, 78(2), 407–416. https://doi.org/10.1007/s10708-011-9444-4
- Ewing, R., & Handy, S. (2009). Measuring the unmeasurable: Urban design qualities related to walkability. Journal of Urban Design, 14(1), 65–84. https://doi.org/10.1080/13574800802451155
- Fancello, G., Congiu, T., & Tsoukiàs, A. (2020). Mapping walkability. A subjective value theory approach. Socio-Economic Planning Sciences, 100923. https://doi.org/10.1016/j.seps.2020.100923
- Fitzsimons D’Arcy, L. (2013). A multidisciplinary examination of walkability: Its concept, measurement and applicability [Doctoral dissertation]. Dublin City University. http://doras.dcu.ie/19387/
- García-Palomares, J. C. (2010). Urban sprawl and travel to work: The case of the metropolitan area of Madrid. Journal of Transport Geography, 18(2), 197–213. https://doi.org/10.1016/j.jtrangeo.2009.05.012
- Gullón, P., Badland, H. M., Alfayate, S., Bilal, U., Escobar, F., Cebrecos, A., & Franco, M. (2015). Assessing walking and cycling environments in the streets of Madrid: Comparing on-field and virtual audits. Journal of Urban Health, 92(5), 923–939. https://doi.org/10.1007/s11524-015-9982-z
- Gullón, P., Bilal, U., Cebrecos, A., Badland, H. M., Galán, I., & Franco, M. (2017). Intersection of neighborhood dynamics and socioeconomic status in small-area walkability: The Heart Healthy Hoods project. International Journal of Health Geographics, 16(1), 21. https://doi.org/10.1186/s12942-017-0095-7
- Henson, C. (2000). Levels of service for pedestrians. ITE Journal, 70(9), 26–30.
- IGN. (2015). Centro de descargas CNIG. LiDAR 2ª Cobertura (2015-Actualidad). Madrid.
- Instituto de Estadística de la Comunidad de Madrid. (2018). Nomenclátor oficial y Callejero. https://www.madrid.org/nomecalles/
- International Transport Forum. (2012). Pedestrian safety, urban space and health. Organisation for Economic Co-Operation and Development (OECD).
- Kim, H., & Macdonald, E. (2016). Does wind discourage sustainable transportation mode choice? Findings from San Francisco, California, USA. Sustainability, 8(3), 257. https://doi.org/10.3390/su8030257
- Knight, J., Weaver, R., & Jones, P. (2018). Walkable and resurgent for whom? The uneven geographies of walkability in Buffalo, NY. Applied Geography, 92, 1–11. https://doi.org/10.1016/j.apgeog.2018.01.008
- Lee, C., & Moudon, A. V. (2004). Physical activity and environment research in the health field: Implications for urban and transportation planning practice and research. Journal of Planning Literature, 19(2), 147–181. https://doi.org/10.1177/0885412204267680
- Leslie, E., Coffee, N., Frank, L., Owen, N., Bauman, A., & Hugo, G. (2007). Walkability of local communities: Using geographic information systems to objectively assess relevant environmental attributes. Health & Place, 13(1), 111–122. https://doi.org/10.1016/j.healthplace.2005.11.001
- Litman, T. (2003). Measuring transportation: Traffic, mobility and accessibility. Institute of Transportation Engineers Journal, 73(10), (Institute of Transportation Engineers: 28).
- Liu, A., Hong, N., Zhu, P., & Guan, Y. (2019). Characterizing petroleum hydrocarbons deposited on road surfaces in urban environments. Science of the Total Environment, 653, 589–596. https://doi.org/10.1016/j.scitotenv.2018.10.428
- Moniruzzaman, M., Páez, A., & Morency, C. (2014). Compliance potential mapping: A tool to assess potential contributions of walking towards physical activity guidelines. BMC Public Health, 14(1), 511. https://doi.org/10.1186/1471-2458-14-511
- OSM Contributors. (2018). [Online]. Retrieved October 1, 2018, from http://planet.openstreetmap.org
- Pikora, T. J., Bull, F. C., Jamrozik, K., Knuiman, M., Giles-Corti, B., & Donovan, R. J. (2002). Developing a reliable audit instrument to measure the physical environment for physical activity. American Journal of Preventive Medicine, 23(3), 187–194. https://doi.org/10.1016/S0749-3797(02)00498-1
- Saelens, B. E., Sallis, J. F., & Frank, L. D. (2003). Environmental correlates of walking and cycling: Findings from the transportation, urban design, and planning literatures. Annals of Behavioral Medicine, 25(2), 80–91. https://doi.org/10.1207/S15324796ABM2502_03
- Southworth, M., & Ben-Joseph, E. (1995). Street standards and the shaping of suburbia. Journal of the American Planning Association, 61(1), 65–81. https://doi.org/10.1080/01944369508975620
- Southworth, M., & Owens, P. M. (1993). The evolving metropolis: Studies of community, neighborhood, and street form at the urban edge. Journal of the American Planning Association, 59(3), 271–287. https://doi.org/10.1080/01944369308975880
- Stangl, P. (2008). Evaluating the pedestrian realm: Instrumental rationality, communicative rationality and phenomenology. Transportation, 35(6), 759–775. https://doi.org/10.1007/s11116-008-9175-7
- Talavera-Garcia, R., & Soria-Lara, J. A. (2015). Q-PLOS, developing an alternative walking index. A method based on urban design quality. Cities, 45, 7–17. https://doi.org/10.1016/j.cities.2015.03.003
- VPSolutions. (2013). Visual PROMETHEE 1.4. Academic edition. http://www.promethee-gaia.net/vpa.html
- Vulevic, T., & Dragovic, N. (2017). Multi-criteria decision analysis for sub-watersheds ranking via the PROMETHEE method. International Soil and Water Conservation Research, 5(1), 50–55. https://doi.org/10.1016/j.iswcr.2017.01.003
- Walk Score. (2020). Walk score methodology. Retrieved April 3, 2020, from http://www.walkscore.com/methodology
- World Health Organization. (2017). Physical activity. www.document. Report. http://www.who.int/mediacentre/factsheets/fs385/en/