
ABSTRACT
The design of tourist maps of historical cities sometimes fails to balance functionality and artistry or does not fully reflect cities’ cultural connotations. In this paper, we select Xi'an, China, as a study case and design a tourist map through a spatial narrative to reflect its artistic characteristics in the layout design, color design and symbol design. A few operational suggestions are proposed for improving functionality and artistry in tourist mapping, including variable scales, topological optimization, hand-painted symbols and colors extracted from the architecture of the city.
1. Background and introduction
1.1. Background
Tourist maps are important cartographic products that provide destination information for tourists (CitationMülazimoğlu & Başaraner, 2019) and are effective tools that play an important role in attracting tourists and marketing destinations (CitationYan & Lee, 2015). As a special category of cartography products, tourist maps are regarded as a combination of science, art and technology (CitationField & Demaj, 2012). A tourist map of a historical city should also closely reflect the city’s characteristics and express the city’s culture (CitationSun & Shen, 2018). Unfortunately, there is a lack of sufficient work in this area, which can have a negative impact on tourists’ planning of tourism routes and understanding of urban culture through tourism maps. Therefore, it is important to improve tourist map design by fully considering functionality and artistry.
There are two trends in tourist map design: mass-produced traditional maps with similar symbols and personalized and artistic maps (especially hand-drawn maps). The former are designed to present information about landmarks and other points of interest so that tourists can easily navigate to the places in which they are interested (CitationGrabler et al., 2008). They are practical enough but fail to meet the esthetic needs of tourists and the needs for maps to be used as pieces of art. In recent years, the importance of innovation in map design has gradually been realized (CitationDemaj & Field, 2012); tourist maps should be both scientific and artistic because ‘art’ and ‘science’ can convey information in different ways in cartography (CitationKrygier, 1995). However, some of these maps are too practical and functional to be artistic.
Compared with the former, which are mostly functional tools for finding destinations, personalized and artistic maps have more esthetic and collection value. Correspondingly, some of these tourist maps have considerable deficiencies in map accuracy and navigation functions. For example, hand-drawn tourist maps are often designed by noncartographic experts, with hand-drawn routes and landmarks. They often present a good combination of readability, clarity and convenience, but the precise shape of roads is often misrepresented (CitationAgrawala & Stolte, 2000). Tourist maps should be geometrically accurate, complete in content and timely in information (CitationSong, 2016). However, some of them even fail to meet the most basic requirements for bringing tourists to the site and may not be navigable for tourists (CitationMcCleary, 2009) due to incorrect scales and spatial relationships.
In addition to functionality and artistry, culture should be presented in tourist map design because culture is becoming a significant part of the modern tourism industry and an important force for attracting domestic and foreign tourists (CitationPatuelli et al., 2013). In this situation, maps are made not only to build understanding but also sometimes to create an emotional response (CitationField & Demaj, 2012). Nevertheless, the tourist maps on the market are more process-oriented products and are not good enough for combining the characteristics of each city.
We use Xi’an as a study case to propose a tourist map mapping method that is suitable for historical cities. The challenge lies in the artistic innovation of map design while still ensuring the accuracy and functionality of tourist maps. In addition, presenting the characteristics of Xi’an in terms of content and artistic design will be another challenge.
This paper is structured as follows. First, the Xi’an tourist map is presented, and then the study area and data preprocessing are introduced. Second, tourist map mapping methods are proposed, including the map’s spatial narrative method, layout design, color design and symbol design. Finally, a conclusion is presented at the end of this paper.
1.2. Map introduction
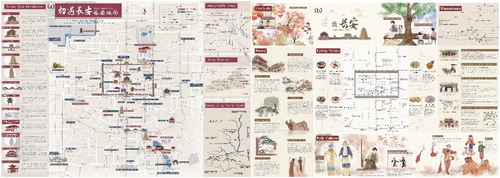
The map is on two pages, and the page size is A2 (420 mm×594 mm). Page 1 (, (a)) mainly shows the location and introduction of the scenic spots that enable tourists to find interesting things to see or information about places, events when traveling to a foreign city (CitationDe Carolis et al., 2005), and various information about the location of scenic spots to assist tourists in their trip, including the location of gas stations, subway stations, shopping malls, and hotels. Page 2 (, (b)) consists of five themes reflecting the characteristics of Xi’an, including festivals, mausoleums, poetry, folk culture and eating habits.
Figure 1. Xi'an tourist map. (a) The front of this map. (b) The back of this map.
2. Study area and data preprocessing
2.1. Study area
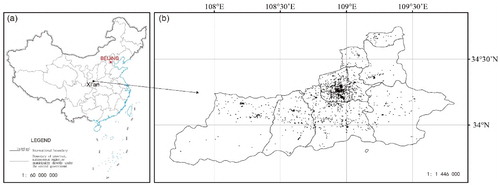
Xi’an (), located in the south-central part of Shaanxi Province, China (107°40’ ∼ 109°49’ E, 33°42’ ∼ 34°45’N), is an ancient city with an approximately 7,000-year history and a population of 9 million. By 2016, six heritage sites in Xi’an were listed on the World Heritage List: the Mausoleum of Emperor Qinshihuang, Dayan Pagoda, Xiaoyan Pagoda, Daming Palace, Weiyang Palace, and Xingjiao Temple. Benefiting from Xi’an’s natural beauty, long history and religious and cultural resources, tourism is becoming one of the fastest growing and most profitable industries of the Xi’an economy: in 2017, it received 18,093,400 tourists, and the total tourism revenue was 163.33 billion yuan (CitationJun et al., 2019).
Figure 2. The geographical setting of Xi'an. (a) The location of Xi'an. Xi'an's geographical setting and Chinese border data are mainly extracted from the 1:60 million map of China provided by the Ministry of Natural Resources of China (http://bzdt.ch.mnr.gov.cn/browse.html?picId=%224o28b0625501ad13015501ad2bfc0290%22); (b) Xi'an scenic spot distribution, each dot represents one tourist attraction: freely available in Baidu Map (https://map.baidu.com).
2.2. Data preprocessing
2.2.1. Variable scales
The Bell Tower was placed in the center of the map, with the map area of the map of TPOI ( tourists' point of interest) on page 1 extending 10 km from the tower. Because the size of the map of TPOI is 368 mm×420 mm, 1:5,000 was selected as the scale for the map of TPOI.
To determine the mapping area, the locations of scenic spots in Xi’an city were collected, and the curve () was generated through buffer zone analysis. The results showed that Xi’an’s tourist attractions are widely distributed but with relatively concentrated groups (CitationZhao et al., 2005), and more than 45% of the tourist attractions are within 10 km of Bell Tower.
Figure 3. The number of attractions varies with distance.
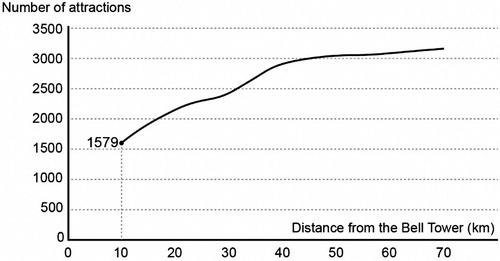
Tourist attractions are often concentrated in a small area, and using a constant scale will result in an uneven distribution of scenic spots. To facilitate tourists’ understanding of the peripherally related spatial information and topological relations and to avoid cognitive switching caused by map switching, variable scales were used beyond the 10 km distance from the Bell Tower. The scale of the center of the map of TPOI on page 1 is 1:5,000, and the scale around the map of TPOI is much smaller.
2.2.2. Feature selection
The information displayed on tourist maps should focus on the convenient selection of tourist attractions and planning (CitationMedynska-Gulij, 2003; CitationYan & Lee, 2015). The content of tourist maps should include attractions, transportation and accommodations to help tourists plan routes and meet their basic needs. In addition, the content of tourist maps should also meet tourists’ general information needs and help them find activities of interest.
To meet the basic needs of tourists, the features on page 1 include roads, attractions, hotels, shopping malls, and gas stations. The road network only includes main urban roads, and only high-level attractions with a large flow of people are provided. Hotels, shopping malls and gas stations close to the attractions were selected.
To meet the needs of tourists and facilitate tourists’ understanding of the history and culture of Xi’an, page 2 mainly includes five themes: ‘festivals’, ‘folk culture’, ‘eating habits’, ‘poetry’ and ‘mausoleums’. The structure and history of mausoleums and poetry-related architecture are introduced to tourists because tourists are often interested in magnificent architecture and its construction stories. ‘Folk culture’, ‘festivals’ and ‘eating habits’ are used to guide tourists in experiencing the local customs of people living in Xi’an because they have formed a unique way of life in terms of food and entertainment influenced by traditional imperial city culture in ancient China. The roads and the locations of buildings and restaurants are the main features presented on this page. shows the features selected for the map.
Table 1. Features selected. (The hierarchy importance decreases from 1 to 3).
2.2.3. Data processing
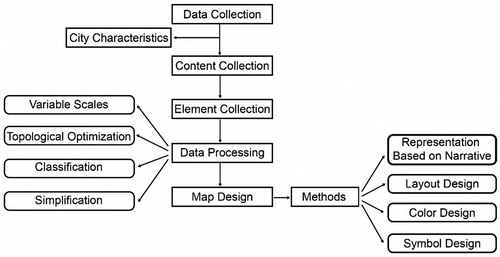
Topological optimization was used for the ‘surrounding tourist spots’ on page 1, the scale concept in this part was abandoned, and the shape details of the terrain and roads were simplified, as the map was transformed into a simple non-Euclidean linear topology map. In addition, classification was used to help tourists understand the content on page 1 and page 2. Elements with the same or similar characteristics were divided into groups, and similar elements are represented by the same symbol or color. Additionally, similar elements are labeled with the same font, and the font size indicates the level of prominence of the features. Moreover, the map scale determines the geometric accuracy of the map; the smaller the scale, the less content it can represent, so simplification was used to simplify the shapes of roads, rivers and other elements ().
Figure 4. The tourist map design flowchart.
3. Methods
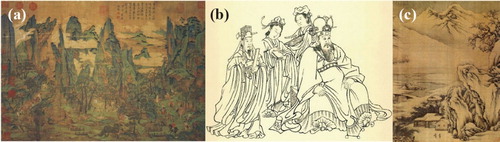
The representation of this map is based on narratives because maps with a local spatial narrative can help tourists establish a sense of place, and layout design is based on the city’s pattern of roads. In addition, the painting styles of the Han and Tang Dynasties were chosen as the style of color and symbol design because Xi’an was the capital of the Han and Tang Dynasties and the culture of the Han and Tang Dynasties reached a very high stage in architecture, painting, poetry and folk art. There are three main styles of painting in the Han and Tang Dynasties: (1) using fine pens to draw, then filling with strong colors (, (a)); (2) using pens freely and naturally (, (b)); and (3) using ink to draw freehand (, (c)) (CitationShaoqin, 2006). The Han and Tang painting styles are reflected in the color design and symbol design of this map.
Figure 5. Examples of the painting styles in the Han and Tang Dynasties. (a) ‘Ming Huang Xing Shu’, (b) ‘Born of Gautama Buddha’, (c) ‘Snowy landscape’ (CitationSong & Ouyang, 1900).
3.1. Representation based on narrative
Structural linguistics is the premise of narrative (CitationLéviStrauss & Jacobson, 1977). The narrative of tourism culture in this map also has a grammatical structure with ‘subject, predicate and object’ as the main body and ‘attribute and adverbial modifier’ as the supplementary modification. Humanity landscapes such as architecture are the carrier of urban culture and the ‘subject’ or ‘object’ in narratives, tourists’ activities become the ‘predicate’ in narratives because they connect humanity landscapes and play a crucial role in connecting the subject and object, and natural landscapes such as rivers and green space are the ‘attributive’ because they modify and complement humanity landscapes. In addition, space is the ‘adverbial’ because it describes the activities of tourists.
3.2. The map layout design
Since the Han and Tang Dynasties, all dynasties have adopted a system of city axes in Xi’an, presenting a checkerboard pattern for the city roads, which have also become distinctive city features in Xi’an. Based on the symmetry of Xi’an’s layout, a symmetrical design is widely used in map layout design.
The geographical setting and information of scenic spots on page 1 are introduced by using the jigsaw narrative method, which can be spliced through the spatial orientation clues. The layout on page 1 can be divided into two parts: the map space that describes the spatial orientation and the text space that introduces the scenic spots. The map space is in the middle and right side on page 1, and the map content includes the location of tourist attractions and traffic so that tourists can determine where to go and how to get there. Symbols and descriptions of important scenic spots on the left side of the map of TPOI form the text space to help tourists understand the stories behind these spots. (, (a)).
Figure 6. The layout of this map. (a) The layout on page 1; (b) The layout on page 2.
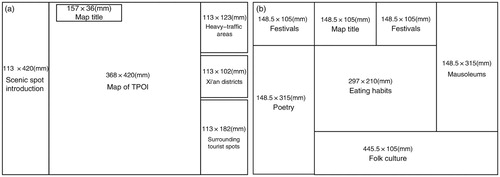
Similarly, page 2 contains a map space and a text space with relevant information, and the axial symmetrical layout was created to build a sense of stability. To effectively focus the reader’s attention on the center and create a sense of stability, same-sized sections are placed in the upper-right corner and the lower-left corner (, (b)).
3.3. The map color design
Both color and text have the function of narrative, and the narrative function of color in this map is to extract the actual color from Xi’an’s landscape buildings (). After removing the influence of the sky and plants, red, khaki and gray were found to be the most common colors of buildings in Xi’an.
Figure 7. The color cards of major scenic spots in Xi'an.
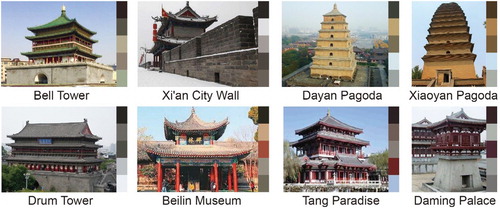
The color scheme of the Xi’an architecture is mainly gray, khaki and ochre. Among the numerous historical buildings in Xi’an, gray and khaki account for a large proportion (for example, the Bell Tower and the Xi’an City Wall both use gray as the main color, while Dayan Pagoda and Xiaoyan Pagoda use khaki as the main color). In addition, ochre is often used for architecture and painting in the Han and Tang Dynasties, and it forms the solemn, elegant and distinct color characteristics of such architecture and painting (CitationHe, 2004). Therefore, gray, khaki and ochre were chosen as the main colors for the map ( & ).
Table 2. Color design with the CMYK color system on page 1.
Table 3. Color design with the CMYK color system on page 2.
3.4. The symbol design
The symbols on the map are divided into three categories: functional symbols, hand-painted symbols and scene symbols. The design of the functional symbols is simple and easy to understand to facilitate tourists’ understanding of the tourist map (CitationCastaldini et al., 2005), while the hand-painted symbols and scene symbols strive to be realistic and vivid and thus improve the artistry and narrative of the tourist map because the uniformity of symbolization limits the representation of the narrative and subjectivity (CitationMocnik & Fairbairn, 2018).
3.4.1. Functional symbols
On page 1, in addition to the location of scenic spots, the location of gas stations, shopping malls, subway stations and hotels serving tourists’ basic needs were also marked on the map. After these symbols were designed, an icon base was formed ().
Table 4. Map icon base.
3.4.2. Hand-painted symbols
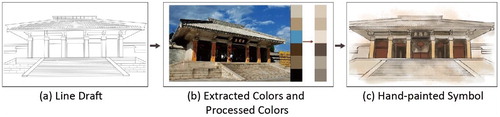
To show the real appearance of ancient buildings and traditional food in Xi’an, photos of these symbols were referenced, and manual methods were used to hand-draw these symbols. Taking Yellow Emperor Mausoleum as an example, first, some photos and related information were found, and a line draft was drawn with a fine pen based on such photos and information (, (a)). The real colors of the building were extracted from the photos, and artistic processing was carried out to coordinate the symbol with the overall color of the map (, (b)). Then, the corresponding colors, some of which are strong colors, were selected from the color card and used appropriately. Finally, the color was filled in on the line draft with shadows in some places (, (c)).
Figure 8. Key steps for creating hand-painted symbols.
Using similar processing methods, the following hand-drawn symbols were generated ().
Table 5. Map symbol base.
3.4.3. Scene symbols
The folk culture and festivals of Shaanxi Province are indispensable parts of Chinese culture; they are rich in content and variety, especially in the performance of traditional arts and customs that show colorful diversity. As a result, general symbol design does not express folk culture and festivals vividly enough, so the method of scene design was used to express them on this map.
First, Xi’an’s most famous folk arts and festivals were selected, such as the Qinqiang Opera, Painted Clay Figurines, the Spring Festival, and the Mid-autumn Festival. Then, more representative scenes in these folk arts and festivals were selected and reproduced through hand drawing, mainly using freehand brushwork to draw lines and then using ink to fill in the colors. Finally, the explanatory text was matched ().
Table 6. Scene design of folk culture and festivals.
4. Conclusions
In this study, first, the tourism information of Xi’an was collected, and the content representing the characteristics of Xi’an was selected. To make this map more functional, buffer zone analysis was used to determine the mapping area and scale size and to ensure the accuracy of the map of TPOI on page 1. Variable scales were used around the map of TPOI to provide a relevant background for the scenic spots in the center of the map, and topological optimization was used to help tourists quickly understand the spatial location relationships between scenic spots. To make this map more artistic and to reflect Xi’an’s characteristics in map design, the narrative was used to express the map design, including the layout design of the jigsaw narrative method, colors extracted from Xi’an’s landscape buildings, and hand-painted symbols formed by artistic processing based on the original appearance of the symbol. These methods can also be used in other historical tourist cities.
We hope that this map will be used as a tool to guide tourists to plan their travel routes and understand the characteristics of the city. We also hope that it will promote the design of tourist maps and the economic development of historical cities. Due to the limitations of layout and paper maps, we cannot express all the characteristics of Xi’an on a paper map, nor can we meet users’ real-time interaction needs. Fortunately, paper maps are still the choice of many tourists, and we will continue to explore design methods for paper tourist maps.
Software
ESRI ArcGIS 10.2 was used for statistical analysis. Adobe Illustrator CC 2018 was used for map design. Adobe Photoshop CC 2018 and Easy PaintTool SAI 2.0 were used for drawing hand-drawn symbols.
Disclosure statement
No potential conflict of interest was reported by the author(s).
References
- Agrawala, M., & Stolte, C. (2000, March). A design and implementation for effective computer-generated route maps. AAAI Symposium on Smart Graphics, March 2000, pp. 61–65. https://www.aaai.org/Papers/Symposia/Spring/2000/SS-00-04/SS00-04-010.pdf.
- Castaldini, D., Valdati, J., Ilies, D. C., & Chiriac, C. (2005). Geo-tourist map of the natural reserve of Salse di Nirano (Modena Apennines, northern Italy).
- De Carolis, B., Cozzolongo, G., & Pizzutilo, S. (2005, June). Generating personalized tourist map descriptions. International Conference on Industrial, Engineering and other Applications of Applied Intelligent Systems (pp. 259–268), Bari, Italy, June 22–24, 2005. Springer, Berlin, Heidelberg. https://doi.org/10.1007/11504894_37
- Demaj, D., & Field, K. (2012). Reasserting design relevance in cartography: Some examples. The Cartographic Journal, 49(1), 77–93. https://doi.org/10.1179/0008704112Z.00000000012
- Field, K., & Demaj, D. (2012). Reasserting design relevance in cartography: Some Concepts. Cartographic Journal, 49(1), 70–76. https://doi.org/10.1179/0008704112Z.00000000011
- Grabler, F., Agrawala, M., Sumner, R. W., & Pauly, M. (2008). Automatic generation of tourist maps. ACM Transactions on Graphics, 27(3), 100:1–100:11. https://doi.org/10.1145/1360612.1360699
- He, H. (2004). Highlighting Xi’an’s ancient capital culture and building modern city spirit-key thinking of Xi’an’s fourth round master plan revision. Planner, 2004(12), 13–15. https://doi.org/10.3969/j.issn.1006-0022.2004.12.003
- Jun, Y., Zi, H., & Shan, F. (2019, February). Research on tourism economic development from the perspective of ecological security: A case study of Xi’an. IOP conference series: Earth and environmental science (Vol. 237, No. 5, p. 052006), Chengdu, China, December 07-09, 2018. IOP Publishing.
- Krygier, J. B. (1995). Cartography as an art and a science? The Cartographic Journal, 32(1), 3–10. https://doi.org/10.1179/caj.1995.32.1.3
- LéviStrauss, C., & Jacobson, C. (1977). Structural anthropology. Anchor Books, Doubleday & Company, Inc.
- McCleary Jr, G. F. (2009, November). Confronting the tourist map: Divergent purposes and disparate users. Proceedings of the 24th International cartographic Conference (pp. 15–21). Santiago de Chile, Chile, November 15–21, 2009.
- Medynska-Gulij, B. (2003). The effect of cartographic content on tourist map users. Cartography, 32(2), 49–54. https://doi.org/10.1080/00690805.2003.9714252
- Mocnik, F.-B., & Fairbairn, D. (2018). Maps telling stories? The Cartographic Journal, 55(1), 36–57. https://doi.org/10.1080/00087041.2017.1304498
- Mülazimoğlu, E., & Başaraner, M. (2019). User-centred design and evaluation of multimodal tourist maps. International Journal of Engineering and Geosciences, 4(3), 115–128. https://doi.org/10.26833/ijeg.535630
- Patuelli, R., Mussoni, M., & Candela, G. (2013). The effects of world heritage sites on domestic tourism: A spatial interaction model for Italy. Journal of Geographical Systems, 15(3), 369–402. https://doi.org/10.1007/s10109-013-0184-5
- Shaoqin, L. V. (2006). On the style of the scenic painting in the Tang Dynasty. Hundred Schools in Arts, 2006(07), 56–58. https://doi.org/10.3969/j.issn.1003-9104.2006.z1.018
- Song, M., & Ouyang, Z. (1900). A Treasure of paintings: From ancient to present. Jiuzhou Press.
- Song, Z. (2016). Artistic and cultural reflection in tourism map design.
- Sun, L., & Shen, Z. (2018). Cultural research on tourism map creation and design. Think Tank Era, 168(52), 248–249. http://www.cnki.com.cn/Article/CJFDTotal-ZKSD201852158.htm
- Yan, L., & Lee, M. Y. (2015). Are tourists satisfied with the map at hand. Current Issues in Tourism, 18(11), 1048–1058. https://doi.org/10.1080/13683500.2014.959904
- Zhao, X., Wu, L., & Ma, Y. (2005). Study on the spatial structure of tourism resources in Xi’an city. Journal of Shaanxi Normal University (From Science Edition), 33(1), 115–119. https://doi.org/10.3321/j.issn:1672-4291.2005.01.032