
 ?Mathematical formulae have been encoded as MathML and are displayed in this HTML version using MathJax in order to improve their display. Uncheck the box to turn MathJax off. This feature requires Javascript. Click on a formula to zoom.
ABSTRACT
A physical model for soil erosion and runoff was created for Alimit River Sub-watershed, using PCRaster Software. Manning's equation was used to model surface runoff velocity and Rose’ and Freebairn’s Equation was used to compute for sediment concentration. Event-based rainfall, saturated hydraulic conductivity, land use map, and digital elevation model were used as input for the model. Close correspondence was observed between the measured and predicted values for both streamflow and mass of eroded sediments. It was observed that vegetation played a significant role in reducing eroded sediments and choosing the correct Manning's Roughness Coefficient for various land use/ land cover is of utmost importance. Furthermore, in the absence of soil data, land use/ land cover or NDVI (Normalized Difference Vegetation Index) can be used as basis for the hydraulic conductivity of the soil.
1. Introduction
Soil erosion is the wearing away of the land surface by rain or irrigation water, … or other natural or anthropogenic agents that abrade, detach and remove geologic parent material or soil from one point on the earth's surface and deposit it elsewhere (CitationSoil Science Society of America, 2019). In a tropical watershed, factors that enhance soil erosion are present: steep slopes and high rainfall erosivity, exacerbated by anthropogenic activities. A highly erosive rainfall occurs when raindrop impact is able to detach or erode soil. Super typhoons in the tropics produce highly erosive rainfalls that often results in significant soil erosion. The amount of soil loss from such events can only be accounted for accurately if high temporal rainfall data is used (per storm event) in models, instead of daily, monthly, or yearly averages of rainfall, which tends to average-out the extreme, highly erosive events. Determining soil loss at a watershed-scale poses an added challenge as watersheds normally have multiple land uses, which have various effects on the amount of soil loss. Tools to help in computing soil loss and in managing land uses are needed by decision makers to properly address the problem of soil erosion and minimize its irreversible effects. Examples of such tools are computer models.
Computer models to study soil erosion and runoff can be made using PCRaster Software. PCRaster is a collection of software that allows users to develop their own dynamic simulation models. The software is used in modelling environmental processes in hydrology, geography, and ecology. Various environmental models could be built through script-programming a batch file that runs the different PCRaster modules automatically. The running module fetches the data specified on the script program, performs the set operation, and outputs a map file, which can be used as input on another process. Researchers can create models for hypothesis testing and choose to add any process. According to CitationKaralis et al. (2014), the dynamic modelling and spatial representation by PCRaster is quite exceptional. In comparison to other GIS Software, PCRaster allows one to model not only in space, but also in time (CitationSchmitz et al., 2009). The extensibility of the different modules and the readability of the script program makes PCRaster a powerful, high-level programming environment that allows the researcher to focus more on the modelling aspect of the work.
Predicting Catchments Runoff and Erosion of Soils (PCARES) (CitationPaningbatan, 2001) is a physical model that simulate runoff and soil erosion of a catchment area during a rainfall event. The governing equations are Manning's Equation for velocity and discharge of surface runoff and Rose’ and Freebairn's Equation for the concentration of sediments. The Manning's n values utilized by Paningbatan was used as reference for the coefficients in this paper.
Catchment Runoff and Erosion Simulation Technology (CREST) model CitationLanuza and Paningbatan (2010) predicted soil erosion and runoff in Tanghaga Catchment, Manupali Watershed, Bukidnon, Philippines. Based on sensitivity testing, which included effects of Manning's roughness coefficient, flow width, per cent water infiltrated, and surface cover, Manning's roughness coefficient and surface cover were the parameters the model was found to be the most sensitive to. Selection of the most suitable Manning's roughness coefficient based on the type of vegetation is of utmost importance to the predicting capability of a model (CitationGholami & Khaleghi, 2013). Establishment of vegetation results to an increase in Manning's roughness coefficient, which in turn reduces water velocity. A rainfall-runoff assessment in the northern mountain regions of Vietnam was found to be sensitive to the amount of rainfall, land use, and crop cover change (CitationZöllmer et al., 2007). In creating the model for this paper, special attention was given to the fidelity of the land use map as this is the basis for assigning Manning's roughness coefficient and directly affects the concentration of sediments. Paningbatan, Lanuza, and Zöllmer utilized PCRaster as the modelling framework.
The objective of this paper is to develop a model for soil erosion and runoff that can compute the amount of soil loss per rainstorm event on a watershed with multiple land uses using PCRaster. Such a model is needed to help in developing ways to protect the watershed from soil erosion, ensure clean water for the coming years, and prevent or minimize flooding.
1.1. Comparison with other models
Both the USLE (Universal Soil Loss Equation) and the PCRaster soil erosion and runoff model utilizes rainfall data as input and as an independent variable. Both models also utilize the landscape's slope and land use/land cover (vegetation) as variables that influence soil erosion. One major difference between the USLE and the PCRaster soil erosion and runoff model is that the USLE is an empirical model (CitationAlewell et al., 2019) while the PCRaster model is a physical, process-based model, utilizing physics based equations like Manning's and Rose’ and Freebairn’s Equations.
The USLE also has several limitations (CitationRoose, 1996). USLE only applies to sheet erosion. In a watershed condition, with highly varying and a high range of slopes, erosion takes many forms from splash, sheet, rill, gully, and to streambank erosion. In a watershed condition USLE may not be applicable.
USLE has been tested and verified in peneplain and hilly country with 1-20% slopes, excluding mountains, especially slopes steeper that 40%. Thus, for a watershed condition with slopes exceeding 20%, USLE becomes inappropriate for use. The watershed that the PCRaster model was tested have various ranges of slopes, some slopes exceeding 100%.
USLE applies only to average data over twenty years and is not valid for individual storms. The PCRaster soil erosion and runoff model is designed to utilize single storm events, with extreme downpour. Such type of rainfall occurs once every 10 or 20 years.
Soil and Water Assessment Tool (SWAT) is semi-distributed, physical, continuous simulation model. This model utilizes MUSLE (Modified Universal Soil Loss Equation) for overland flow simulation and Bagnold's stream power concept for channel sediment, and the continuity equation for reservoir sediment. SWAT integrates the model using a GIS interface and can handle large datasets (CitationMerrit et al., 2003; CitationPandey et al., 2016).
Kinematic Runoff (KINEROS) model is a process-oriented, single storm event, physical, distributed simulation model. This model uses mass balance equation and sediment transport capacity as governing equations. KINEROS can be used for predicting runoff from ungauged watersheds (CitationMerrit et al., 2003; CitationPandey et al., 2016).
In contrast to SWAT and KINEROS, the soil erosion and runoff model developed using PCRaster is a dynamic, process-oriented, physical, single storm event, distributed simulation model by grid cells. This model utilizes Manning's equation for surface runoff computation and Rose’ and Freebairn’s Equation for sediment transport. Like SWAT, this model is also integrated through GIS and can handle large datasets.
1.2. Study area
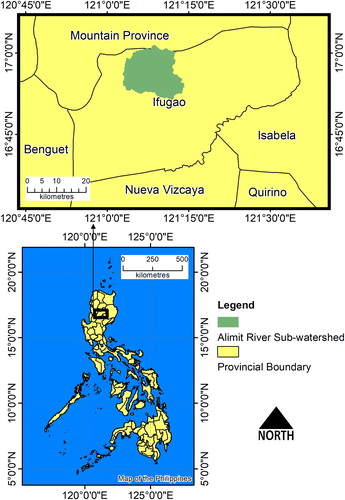
The study area is the Alimit River Sub-watershed. shows the location of the sub-watershed. Alimit River Sub-watershed site falls within the Municipal Boundaries of Lagawe, Hingyon, Banaue, and Mayoyao of Ifugao Province and the Municipality of Barlig, Mountain Province. The Sub-watershed has an approximate area of 25,478.3 hectares and is within the geographic coordinates of 121° 2’ 41.58” E – 121° 14’ 16.48” E longitude and 16° 51’ 1.56” N – 17 1’ 46.22” N latitude.
Figure 1. Location of the study site. Alimit River Sub-watershed is situated in the northern portion of the Island of Luzon, Ifugao Province, Philippines.
2. Methods
2.1. Theory
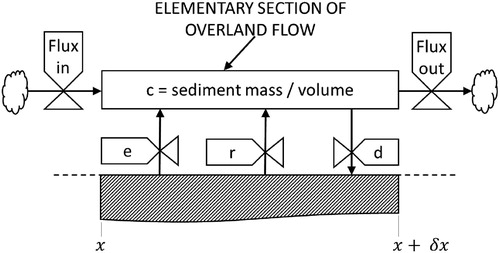
The mechanics of soil erosion involves detachment, entrainment, and deposition of soil particles. shows the mechanics of soil erosion as it relates to sediment concentration and fluxes (CitationRose & Freebairn, 1985). Fluxes in and out are sediment fluxes entering and leaving the section of flow between x and x+δx. The section of flow is represented by a pixel in a GIS, as a pixel has spatial dimension. Materials (sediment fluxes) are transferred from one pixel of higher elevation to a pixel of lower elevation in the landscape. From a watershed scale, the net flux is a measure of the amount of eroded sediments in the watershed.
Figure 2. Mechanics of soil erosion relating to sediment concentration and fluxes (CitationRose & Freebairn, 1985). The symbol e represents rate of rainfall detachment; d, rate of deposition; and r, rate of entrainment of sediment.
Based on Rose's and Freebairn's Equation (Citation1985), sediment concentration, c, (Equation (1)) is a function of the slope of the landscape, amount of vegetation cover, and efficiency of sediment entrainment. A slope map can be derived from a DEM (Digital elevation model) and vegetation cover data can be extracted from the most recent satellite data through image classification.
(1)
(1) where
is sediment concentration, kg/m3,
is slope angle,
is efficiency of sediment entrainment,
is fraction of soil uncovered by vegetation.
During an erosive rainfall event, soil material and water normally flows from an area of higher elevation to an area of lower elevation, moving along the soil surface as sheet erosion or through channels like rills and gullies. The velocity of surface runoff along these channels can be estimated using Manning's Equation (Equation (2)):
(2)
(2) where
is velocity, m/sec,
is the hydraulic radius, m,
is the slope,
is Manning's surface roughness index.
A uniform sloping surface in a landscape could be assumed as a very wide channel with negligible sides. In such a case, the hydraulic radius, r, becomes the height of flow of water (CitationHillel, 2004).
2.2. Rain gauge and water-level recorder
A tipping-bucket rain gauge was installed within the sub-watershed boundary in Barangay Alimit, Mayoyao Municipality. The location and geographic coordinates of the rain gauge is shown in . The tipping-bucket rain gauge is calibrated to 0.2 mm of rainfall per bucket tip. Each tip is recorded onto the data logger with a date and time stamp, providing high-temporal resolution rainfall data.
Figure 3. Location of tipping-bucket rain gauge and water-level recorder overlain on the DEM of Alimit River Sub-watershed.
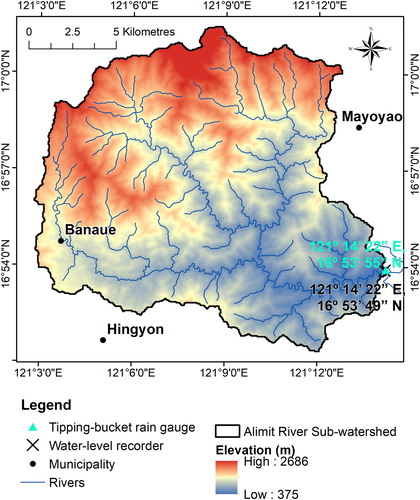
A capacitive water-level recorder was installed on a straight segment on the lower portion of the main tributary of Alimit River. Water level was recorded every ten-minutes, with date and time stamp. shows the location and coordinates of the water-level recorder.
2.3. Water and sediment sampling
Water sample and sediment samples were taken during erosive rainstorm events. Sampling was performed by collecting water from the centre of the river using a pail, attached to a rope. A 350-mL polyethylene bottle was filled with water sample from the pail. The date and time the samples were taken were written on each sample bottle. The water samples were brought to the laboratory for oven-drying of sediments.
2.4. Digital elevation model
The digital elevation model was downloaded from the ASTERGDEM (Advanced Spaceborne Thermal Emission and Reflection Radiometer Global Digital Elevation Model) website: https://asterweb.jpl.nasa.gov/gdem.asp. Processing the DEM required low-pass filtering to smoothen the rough edges of the DEM. The lddcreate option in PCRaster PCRCALC will create an LDD (local drainage direction map) network without discontinuity and with a common outlet. The local drainage direction map shows the flow direction of materials, in this case water and sediments, from a cell of higher elevation to a cell of lower elevation in the watershed. All pixels in a watershed are connected to the drainage network until they converge to a common outlet where the pit is located.
2.5. Landsat data
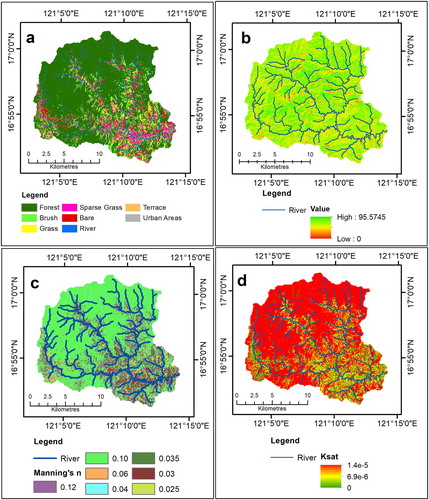
The land use map was derived by performing image classification on Landsat 8 data, dated May 14, 2014, path 116, row 048. Landsat data was downloaded from https://earthexplorer.usgs.gov/. Field validation of the land use map was performed to increase its accuracy. The land use map was supplemented by digitizing the location of rice terraces using Google Maps. The vector file of the rice terraces was rasterized and incorporated into the land use map ((a)) using map algebra.
Figure 4. Input maps required by the model: (a) land use/ land cover map, (b) NDVI map, (c) Manning's n map, and (d) saturated hydraulic conductivity (Ksat) map.
2.6. Manning's n and saturated hydraulic conductivity maps
A Manning's n value was assigned to each land use class to generate a Manning's n map ((c)). The Manning's n map is one of the required inputs of the soil erosion and runoff model. The value of Manning's n was based on CitationChow (1959). Values of Manning's n were adapted from CitationPaningbatan (2001). Previous studies have shown than Manning's n increases with vegetation density (CitationGholami & Khaleghi, 2013). During model calibration, slight adjustments on some of the Manning's n values were made to improve model performance. These slight adjustments on the Manning's n value for various land uses are still very close to the published Manning's n value by CitationChow (1959). shows the value of Manning's n assigned to each land use.
Table 1. Manning's n and saturated hydraulic conductivity value for various land uses.
Saturated hydraulic conductivity is a soil physical property that affects the rate of entry of water into the soil. Previous studies have shown that saturated hydraulic conductivity is very much dependent on vegetation. Vegetation … significantly increases the permeability of soils [hydraulic conductivity]. The average volume of large pores is the highest in the forest soils and lowest in the cultivated and grassland soils. The increase in large pores increases hydraulic conductivity (CitationChen et al., 2009). Areas with very dense vegetation, where organic matter is abundant and the soil has good structure, like forests and thick grasslands, have high values for saturated hydraulic conductivity. Hydraulic conductivity affects the amount of surface runoff generated during a rainstorm event. High hydraulic conductivity values mean the soil can infiltrate more rainwater and less surface runoff will be produced. The values for saturated hydraulic conductivity () of various land uses were taken from CitationBato (1996). The saturated hydraulic conductivity values were recoded into the land use map to produce the saturated hydraulic conductivity map ((d)).
2.7. Normalized difference vegetation index
The NDVI (Normalized Difference Vegetation Index) ((b)) is an index of vegetation ‘greenness’ and was computed from the Landsat 8 image. The NDVI map was used as a vegetation cover map in Rose’ and Freebairn's Equation portion of the model.
2.8. Assumptions of the model
First assumption, the model assumes that evapotranspiration is negligible. During rainstorm events, rainfall intensity is very high and evapotranspiration rate is very small, negligible, and insignificant as far as the soil erosion model is concerned. Disregarding evapotranspiration in the model will not affect the model's prediction capability. CitationOudin et al. (2005) found no systematic improvements in the rainfall-runoff model efficiencies when using [evapotranspiration and] conclude[d] that the insensitivity of rainfall-runoff models to detailed … evapotranspiration knowledge may bring into question the very concept of potential evapotranspiration. Furthermore, the mechanics of soil erosion as proposed by CitationRose and Freebairn (1985) () does not include evapotranspiration as a variable in modelling for soil.
Second assumption, the antecedent soil moisture is assumed to be approaching saturated hydraulic conductivity. Rainstorm events normally occur during the wet season. Erosive rainfall events are normally preceded by several episodes of rainfall that adds moisture to the soil to the point that soil moisture content is very close to saturated hydraulic conductivity. Utilizing the saturated hydraulic conductivity of the soil instead of the instantaneous infiltration value did not have a significant effect on the model's predictive function and has been tested through various runs of the model. Such an observation is supported by CitationZhang et al. (2011) where the authors found no threshold value for measured antecedent soil moisture controlling the absence or presence of runoff. Furthermore, there is no significant correlation between measured runoff ratio and antecedent soil moisture.
Third assumption, one rain gauge is sufficient to represent the spatial variability of rainfall occurring in a mountainous watershed. Optimal [rain gauge] densities are difficult to achieve in reality due to various practical constraints such as lack of funding and limited accessibility as well as the lack of knowledge on the local precipitation variability (CitationLopez et al., 2015). The WMO (World Meteorological Organization) however, recommends a maximum of 250 squared-kilometers (25,000 hectares) per rain gauge for mountainous regions of tropical zones (CitationLiang et al., 2012; CitationWMO, 2008). The estimated area of Alimit River Sub-watershed is 25,478.3 hectares and is therefore still very close to the recommended area of the WMO per rain gauge. Another study suggests 4–6 rain gauges per 2500 squared-kilometers (41,667 hectares per rain) gives reasonable accuracy in daily rainfall estimates (CitationMishra, 2013). The Alimit River Sub-watershed area is much less than the suggested area of 41,667 hectares.
Fourth assumption, the base flow of the river is a constant value added to the height of streamflow. Streamflow is divided into two components: storm flow and base flow. Storm flow contains the true surface runoff … while base flow contains groundwater flow and inter-flow (CitationBosch et al., 2017). Base flow is defined as the portion of the stream discharge that originates as ground water, and that enters the stream channel from the saturated zone via lateral or upward moving ground water flow (CitationTomer, 2005). Base flow is, therefore, not surface runoff and is not being modelled in this study. Furthermore, significant changes in the base flow of rivers occurs in periods spanning several years and not within the occurrence of a tropical rainstorm event that normally lasts is just less than a day (Citation2018).
2.9. Spatial characteristics of raster data
The spatial characteristics of all raster data used in the model are as shown in .
Table 2. Spatial characteristics of raster data used in modelling.
2.10. Software used
The following software were used in this research: PCRaster, GDAL (Geospatial Data Abstraction Library), ArcGIS, and IDRISI. PCRaster version 4.2.0 was used primarily for creating the soil erosion and runoff model. Geospatial Data Abstraction Library version 1.11.3 was used for the reprojection, resampling, and conversion of spatial data. ArcGIS version 10.2.2 was used in creating professional-looking map layouts. IDRISI Selva (version 17) was used for image classification and spatial data preparation. R Software was used for statistical analyses. MakeAVI Software was used to convert individual timestep images to AVI format video. OpenShot Video Editor Software was utilized in video overlay and conversion of final video format to MP4. All software ran on Microsoft Windows 10 64 bit.
3. Results and discussion
3.1. Land use
The land use map of Alimit River Sub-watershed is shown on (a). The area per land use category is in . Because of the large land area and the wide range of elevation in the Alimit-River Sub-watershed, different weather systems exist in the watershed, which results in a variety of land use.
Table 3. Land use categories and their area coverage for Alimit River Sub-watershed.
Overall, more than half of the total land area of Alimit River Sub-watershed is forest cover. The forested areas are mostly on lands above one-thousand meters in elevation. Forest vegetation in the watershed is dominated by evergreen trees. Below one-thousand meters is where the other land uses are mostly located. Adjacent to the tributaries of Alimit River are land uses that are result of anthropogenic activities: brush, grass, sparse grass cover, bare, and terraces. The extensive area of sparse grass can be found adjacent to the main tributary of Alimit River, within the one hundred to five-hundred meters in elevation. Areas with sparse grass and bare areas are prone to erosion in this watershed.
3.2. Surface runoff prediction
Three erosive rainstorm events () were considered for modelling, each having its own set of data points. Rainstorm event number three occurred during the onslaught of Super Typhoon Lando (International Name: Koppu) in the Philippines. This super typhoon brought extreme rainfall to the country from October 14–21, 2015 (CitationNASA, 2015; CitationNDRRMC, 2015).
Table 4. Rainstorm events utilized in the modelling of soil erosion and runoff.
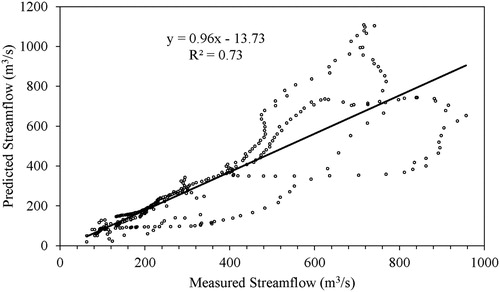
This portion of modelling process utilized rainfall and water-level as input, together with various maps, yielded the predicted streamflow. shows the correlation between the predicted and measured streamflow. The best-fit line has an R2 of 0.73, indicating a linearly positive correlation. The Welch Two Sample t-test has a t-value of 1.51 and a p-value of 0.13, with 682.84 degrees of freedom. The critical t value at 5% is 1.96. Because the p-value is greater than 0.05 and the t-value is less than the critical t value, there is no significant difference between the measured and predicted streamflow of Alimit River Sub-watershed.
Figure 5. Correlation analysis between the measured and predicted streamflow.
3.3. Sediment concentration
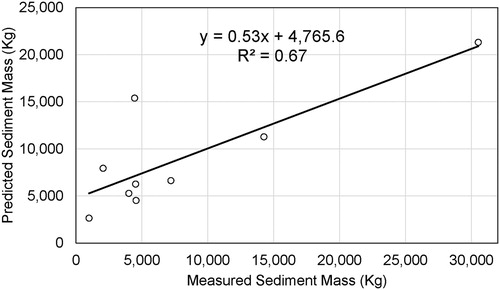
This portion of the modelling process utilized sediment concentration from water samples as additional input. shows the correlation between the measured and predicted sediment mass. The graph shows a positively linear correlation with an R2 of 0.67. The Welch Two Sample t-test has a t-value of −0.26 and a p-value of 0.80, with 13.70 degrees of freedom. The critical t value at 5% is 2.15. Because the p-value is greater than 0.05 and the t-value is less than the critical t, there is no significant difference between the measured and predicted sediment mass. The physical, dynamic model is, therefore, able to predict soil erosion in Alimit River Sub-watershed.
Figure 6. Correlation analysis of measured and predicted sediment mass.
Rainstorm event three is of significant interest because it coincided with occurrence of Super Typhoon Lando. The event had two rainstorm events in a series that exceeded a twenty-four-hour period. The peak streamflow discharge was around 1150 m3/s. The predicted total eroded sediments for rainstorm was 429,762,000 kg or 429,762 MT (metric tons). The estimated total surface runoff of is 3,037,000 m3. The service area of the gauging station is 25,478 ha. The rate of soil loss for Alimit River Sub-watershed was about 16.9 MT/ha for the said rainstorm event. shows the plot of sediment mass and predicted streamflow. shows the summary of rainfall and estimated runoff and eroded sediments for Alimit River Sub-watershed for all three rainstorm events.
Figure 7. Sediment mass and predicted streamflow of Alimit River, October 18–19, 2015, Barangay Alimit, Mayoyao Municipality.
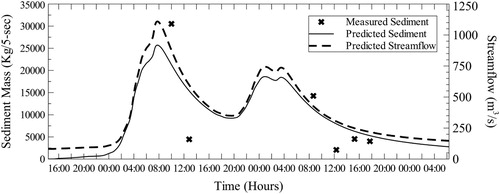
Table 5. Summary table of rainfall and estimated runoff and eroded sediments for Alimit River Sub-watershed.
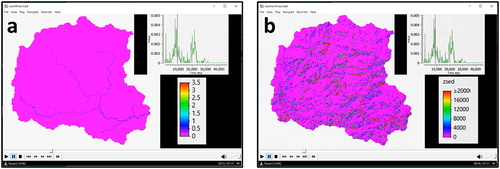
The soil erosion and runoff model outputs timeseries maps, which can be viewed as animation using PCRaster's Aguila module. The Main Map shows results of the soil erosion and runoff modelling at different times for Super Typhoon Koppu. The timeseries were exported as bitmaps and processed into a video for easier visualization. (a) is a screengrab of runoff timeseries video for rainstorm event three being played on a media player software. (b) is a screengrab of sediment mass timeseries video for rainstorm event three being played on a media player software.
Figure 8. Screengrab of timeseries videos being played on a media player software: (a) Runoff timeseries video for rainstorm event 3 and (b) Sediment mass timeseries video for rainstorm event 3.
3.4. Sensitivity analyses
Under reforestation of erosion prone areas, there is a 23% (−701,000 m3) and 38% (−162,762,000 kg) decrease in the volume of water and amount of eroded sediments going into the reservoir. Under low deforestation, there is an increase of 9% (+274,000 m3) in the volume of water and 18% (+76,238,000 kg) in the amount of sediments entering the reservoir. Under high deforestation conditions, there is a significant increase of 83% (+2,517,000 m3) in the volume of water and 145% (+624,238,000 kg) in the amount of sediments entering the reservoir.
4. Summary and conclusion
A physically-based model was created using PCRaster Software to predict soil erosion and runoff in Alimit River Sub-watershed, Ifugao Province, Philippines. Event rainfall data was gathered using a tipping-bucket rain gauge and water-level at the Alimit River was monitored using a water-level recorder. Rainfall, digital elevation model, and saturated hydraulic conductivity were used as input to the model. Sediment samples and water-level data were used to calibrate the model. Manning's Equation was used to model runoff velocity and Rose’ and Freebairn's Equation was used to compute for sediment concentration. Based on correlation analyses and statistical tests, the model was able to predict surface runoff and soil erosion without any significant difference between the measured and predicted. Timeseries videos of surface runoff and sediment mass accumulation provided a dynamic way to visualize these events as they advance through time. The Main Map shows the results of the soil erosion and runoff modelling at different times for Super Typhoon Koppu.
4.1. Limitations of the model
The model works using high-temporal resolution rainfall data. Input rainfall data should be at an interval of at most ten minutes. Daily cumulative rainfall data, which is normally available among the weather bureaus may not work for the model. To comply with the model's requirement of high-temporal resolution, tipping-bucket rain gauge should be utilized.
The model was tested on a single rainstorm event, but will also work for cumulative daily rainfall data, depending on the objective. The goal of this research is to predict or simulate soil erosion in a watershed for a super typhoon event and such goal was achieved using high-temporal resolution rainfall data from a tipping-bucket rain gauge. Cumulative daily or weekly rainfall data that do not reflect the dynamic and extremes of rainfall duration and intensity and are not suitable for erosion studies.
Due to the nature of the model's inputs, numerous raster data and high-temporal resolution rainfall data, the model is computationally intensive.
4.2. Applications of the model
Other countries with tropical conditions and similar landscapes can utilize the model developed in this research. Due to climate change, there is an increase in the frequency and magnitude of extreme rainstorm events. The soil erosion and runoff model developed in this research is designed for such extreme rainstorm events. Other soil erosion and runoff models that utilize rainfall averages rather than event-based rainfall data will inaccurately estimate the amount of soil erosion and volume of runoff.
The model can be used in watershed improvement, rehabilitation, and protection and in managing soil erosion in agricultural farmlands. Utilizing the model allows resource managers and scientists to quantitatively determine the amount of soil loss in a watershed. The model also allows the one to create land use and rainfall scenarios to determine which land use is suitable to various locations of the watershed while minimizing soil loss.
The model can be utilized in both small and large catchments. For large catchments, the use of numerous tipping-bucket rain gauges is recommended. With current advances in computing, sensor, and telecommunications technology, numerous rain gauges and water-level recorders could be deployed in the watershed and connected together through the Internet, transmits real-time data to servers that run the model and computes for soil erosion in real-time.
Software
PCRaster version 3.6 Software was used for the soil erosion and surface runoff modelling. ArcGIS 10 was used for cartographic mapping. GDAL Software utilities was used for data import, export, and pre-processing. Veusz Software was utilized for creating graphs.
VAB_soil_erosion_supplemental_maps_1_9.pdf
Download PDF (105.6 MB)Acknowledgements
I would like to acknowledge the now defunct Madecor Group of Companies for providing funds for the conduct of this work and its officers Dr. Eduardo Sison and Dr. Elpidio Rosario for allowing the author to publish this work.
Disclosure statement
No potential conflict of interest was reported by the author(s).
References
- Alewell, C. , Borelli, P. , Meusburger, K. , & Panagos, P. (2019). Using the USLE: Chances, challenges and limitations of soil erosion modelling. International Soil and Water Conservation Research , 7 (3), 203–225. https://doi.org/10.1016/j.iswcr.2019.05.004
- Bato, V. A. (1996). The relationship of earthworm population with some soil physical properties of Lipa soil series . University of the Philippines.
- Bosch, D. D. , Arnold, J. G. , Allen, P. G. , Lim, K. , & Park, Y. S. (2017). Temporal variation in baseflow for the Little River experimental watershed in South Georgia, USA. Journal of Hydrology: Regional Studies , 10 , 110–121. https://doi.org/10.1016/j.ejrh.2017.02.002
- Chen, X. , Zhang Z., C. , & & Shi, X. (2009). The impact of land use and land cover changes on soil moisture and hydraulic conductivity along the karst hillslopes of southwest China. Environmental Earth Sciences , 59 (4), 811–820. https://doi.org/10.1007/s12665-009-0077-6
- Chow, V. T. (1959). Open-channel hydraulics . McGraw-Hill.
- Gholami, V. , & Khaleghi, M. R. (2013). The impact of vegetation on the bank erosion (case study: The Haraz River). Soil & Water Research , 8 (4), 158–164. https://doi.org/10.17221/13/2012-SWR
- Hillel, D. (2004). Introduction to environmental soil physics . Elsevier Science.
- Karalis, S. , Katsios, I. , & Karymbalis, E. (2014). Development and testing of a Simple Soil Erosion Model. 1st International GEOMAPPLICA Conference, https://www.researchgate.net/publication/299741120_Development_and_testing_of_a_simple_soil_erosion_model
- Lanuza, R. , & Paningbatan, J. E. (2010). Validation and sensitivity analysis of catchment runoff and erosion simulation technology (CREST): A GIS-assisted soil erosion model at watershed level. https://scholarsarchive.byu.edu/cgi/viewcontent.cgi?article=2592&context=iemssconference
- Liang, S. , Li, X. , & Wang, J. (2012). Advanced remote sensing . Academic Press Elsevier.
- Lopez, M. G. , Wennerström, L. N. , & Seibert, J. (2015). Location and density of rain gauges for the estimation of spatial varying precipitation. Geografiska Annaler: Series A. Physical Geography , 97 (1), 167–179. https://doi.org/10.1111/geoa.12094
- Merrit, W. S. , Letcher, R. A. , & Jakeman, A. J. (2003). A review of erosion and sediment transport models. Environment Modelling & Software , 18 (8-9), 761–799. https://doi.org/10.1016/S1364-8152(03)00078-1
- Mishra, A. K. (2013). Effect of rain gauge density over the accuracy of rainfall: A case study over Bangalore, India. SpringerPlus , 2 (1), 311. https://doi.org/10.1186/2193-1801-2-311
- Mukherjee, A. , Bhanja, S. N. , & Wada, Y. (2018). Groundwater depletion causing reduction of baseflow triggering Ganges River summer drying. Scientific Reports , 8 , 12049. https://doi.org/10.1038/s41598-018-30246-7
- NASA . (2015). Koppu (NW Pacific). Retrieved January 10, 2020, from https://www.nasa.gov/feature/goddard/koppu-nw-pacific
- NDRRMC . (2015). SitRep No. 22 re preparedness measures and effects of typhoon “Lando” (I.N. KOPPU). Retrieved January 20, 2020, from http://www.ndrrmc.gov.ph/attachments/article/2607/SitRep%20No.22%20re%20Preparedness%20Measures%20and%20Effects%20of%20Typhoon%20LANDO%20(I.N.%20KOPPU).pdf
- Oudin, L. , Michel, C. , & Anctil, F. (2005). Which potential evapotranspiration input for a lumped rainfall-runoff model?: Part 1-Can rainfall-runoff models effectively handle detailed potential evapotranspiration inputs? Journal of Hydrology , 303 (1-4), 275–289. https://doi.org/10.1016/j.jhydrol.2004.08.025
- Pandey, A. , Himanshu, S. K. , Mishra, S. , & Vijay, S. P. (2016). Physically based soil erosion and sediment yield models revisited. Catena , 147 , 595–620. https://doi.org/10.1016/j.catena.2016.08.002
- Paningbatan, Jr., E. P. (2001). Geographic information system-assisted dynamic modelling of soil erosion and hydrologic processes at a watershed scale. The Philippine Agricultural Scientist , 84 , 388–393.
- Roose, E. (1996). Land husbandry – component and strategy (70 FAO Soils Bulletin). Food and Agriculture Oranization of the United Nations. http://www.fao.org/3/t1765e/t1765e00.htm#Contents
- Rose, C. W. , & Freebairn, D. M. (1985). A new mathematical model of soil erosion and deposition processes with applications to field data. In E. Swaify , S. A. Moldenhauer , & A. Lo (Eds.), Soil erosion and conservation (pp. 549–557). Iowa: Soil Conservation Society of America.
- Schmitz, O. , Karssenberg, D. , Van Deursen, W. P. , and Wesseling, A. , & G, C. (2009). Linking external components to a spatio-temporal modelling framework: Coupling MODFLOW and PCRaster. Environmental Modelling & Software , 24 (9), 1088–1099. https://doi.org/10.1016/j.envsoft.2009.02.018
- Soil Science Society of America . (2019). Retrieved May 31, 2019, from Glossary of Soil Science Terms: https://www.soils.org/publications/soils-glossary#
- Tomer, M. D. (2005). Watershed management. In H. Daniel (Ed.), Encyclopedia of soils in the environment (pp. 306–315). Elsevier Ltd.
- World Meterorological Organization . (2008). Guide to Hydrological Practices volume I WMO-No. 168.
- Zhang, Y. , Wei, H. , & Nearing, M. A. (2011). Effects of antecedent soil moisture on runoff modelling in small semiarid watersheds of southeastern Arizona. Hydrology and Earth System Sciences , 15 (10), 3171–3179. https://doi.org/10.5194/hess-15-3171-2011
- Zöllmer, C. , Lippe, M. , Vien, D. T. , Dung, N. V. , Hilger, T. H. , & Cadisch, G. (2007). Development of a simple PCRaster-based model for rainfall-runoff assessment in the Northern Mountainous Region of Vietnam. http://www.tropentag.de/2007/abstracts/posters/393.pdf