
ABSTRACT
Over the past decades, Bike-Sharing Systems have been implemented in hundreds of cities all around the world. During this time, numerous academic studies have been published with analyses from different perspectives. The aim of this study is to build upon this research by bringing together a spatial and a temporal analysis of the cycling flow of BiciMAD, the Madrid Bike-Sharing System. By combining over 21 million GPS records and various maps the study visually explores cycling mobility patterns across the city on three different temporal scales: over the course of the day, during working days or weekends and over the course of a whole year to provide a better understanding of the season-dependent demand. The study also reveals the most important flows between origin-destination pairs and uncovers the radically different spatio-temporal travel patterns of frequent users and occasional users.
1. Introduction
Since their introduction in Amsterdam (1965), Bike-Sharing Systems (BSS) have been rapidly growing around the world, to a reported number of 1,286 schemes with more than 3 million bicycles in over 50 countries and 500 cities (Pucher & Buehler, Citation2017). Several factors have helped, including changes in legislation, the implementation of policies and cycling infrastructure, and technological advances in batteries that allow cheap electric powered bicycles (e-bikes) that provide a broader range of movement and more comfortable usage in hot weather and changing topography (Weinert et al., Citation2007). With the spread of these BSSs, the scientific literature has also raised a wide variety of topics, such as the use of cycling infrastructure, safety issues, modelling frameworks, the analysis of demand and cycling flow, bicycle modal integration, public policy and cycling behaviour, preferences and travel patterns.
One of the most well-developed research lines has focused on the analysis of travel times and the length of cyclists’ routes in BSSs. Some findings have shown that cycling movements are not well balanced and different behaviours are associated with the length of trips (Moncayo-Martinez & Ramirez-Nafarrate, Citation2016). Shorter trips tend to be concentrated in the city centre and seem to better complement public transport, while longer trips are more focused on streets with cycle tracks, decreasing their complementarity effect with other modes (Levy et al., Citation2019).
Another research line has analysed the cycling flow generated by Bike-Sharing Systems, with different approaches. Some studies have examined the activity over time with the aim of identifying trends (Borgnat et al., Citation2013; O’Brien et al., Citation2014; Zaltz Austwick et al., Citation2013). A similar study carried out by CitationPurnama (Citation2018) analysed bicycle travel patterns in New York and London and observed that there were differences as well as similarities in temporal correlation level between the riding behaviour of BSS users and the hour of the day, day of the week, season, and local weather. Other research has analysed the imbalances produced by the different levels of attraction and generation of trips at the BSS stations (CitationGoodman & Cheshire, 2014), recommending additional redistribution approaches (Raviv et al., Citation2013; Shu et al., Citation2013).
Furthermore, a recently explored topic is studying the spatial dimension of cycling mobility, especially now that BSS have collected a great amount of time and location data, which enables the study of travel behaviour and mobility at an individual level (Beecham & Wood, Citation2014). The research carried out by CitationRomanillos and Zaltz Austwick (Citation2016) gathered, visualised and analysed volunteer cyclists’ routes and the distribution of cycling flow across Madrid’s urban street network. Another example is the research carried out by CitationRomanillos et al. (Citation2018), whose results revealed the different spatial cycling patterns of frequent and occasional users. Factors related to street network properties (such as slope, motor traffic speed or density of traffic lights and intersections), to the trip (such as the purpose of the journey) or the cyclist (such as gender or age) were shown to have great impact on cyclists’ speed, in a later study based on a detailed analysis of the GPS tracks (Romanillos & Gutiérrez, Citation2019). Even a comparative analysis of different transport modes was carried out, showing that cycling was the most competitive transport mode for small-medium distances (under 21 min in length for Madrid).
From all the summarised research lines related to BBS, our analysis is particularly focused on a spatial and a temporal analysis of the cycling flow of BiciMAD, the Madrid Bike-Sharing System. The study analyses cycling flow at three different temporal scales: over the course of the day (trips aggregated per hour), during working days or weekends, as well as over the course of a whole year, to provide a better understanding of the different demand according to the different seasons, which is relevant in a city like Madrid where the weather changes so much during the course of the year. Moreover, this research visualises the cycling flow between stations during working days and over the weekend, highlighting the most important flows between origin-destination pairs. Finally, all these analyses have been carried out considering two types of users: frequent users and occasional users. The study reveals the radically different spatio-temporal travel patterns of both groups. The ultimate goal of this paper is to increase the understanding of BSS travel behaviour and to provide information for planners and decision-making actors to respond efficiently to this growing cycling demand.
2. Case study, data and methodology
2.1. Case study
The analysis is focused on the cycling flow of BiciMAD, the Madrid Bike-Sharing System. BiciMAD started operating in June 2014, with 1,560 bikes and 123 docking stations. Although the system is currently growing, with a second expansion phase taking place in 2019, and will soon have 214 stations and 2,496 bicycles, during the period of time of our data sample (2018), the system was operating with 2,078 bikes and 172 stations, covering the inner-central area of Madrid, with nearly 850,000 inhabitants, and with approximately 10 million tourists in 2018. Due to the growing activity of BiciMAD over the past years, a third phase is meant to take place and the system will have over 4,000 bicycles and 350 bike stations (Lantiga, Citation2017).
This study particularly analyses the different spatio-temporal patterns of two groups of cyclists that correspond to the two types of BiciMAD users regarding subscription to the system: frequent users and occasional users. Frequent users buy an annual membership (25€ in 2018), and then pay 0.50 € for trips with a duration of less than half an hour. Cyclists are additionally charged when riding longer, but always getting lower rental prices than occasional users. Occasional users can obtain a free card for 1, 3 or 5 days, and only pay for the trips completed during these days.
Different characteristics of Madrid and its particular Bike-Sharing System have to be considered when analysing the results of this study and especially when comparing the results with other BSS travel patterns. In the city of Madrid, it is important to take into account that the weather varies quite dramatically throughout the year, with temperatures commonly over 30°C in summer and close to 0°C in winter. This could explain a potential seasonality in the use of the system. Another important factor that could affect cycling flows is the topography of the city, due to the presence of hilly streets close to the river and the constant north–south slope of the city. When it comes to the Madrid Bike-Sharing System, it is relevant to highlight that BiciMAD comprises almost all the features of a fourth-generation scheme, such as: travel card integrated with other public transportation modes (underground and bus), incentivizing user-based redistribution with a 20% trip cost reduction if returned to an empty station, bicycle tracking (GPS, RFID), state-of-the-art docking stations (solar power, touchscreen kiosks) and online apps offering information, such as online maps and the real-time availability of bikes at stations (Buehler & Pucher, Citation2011; Midgley, Citation2011; Munkácsy & Monzón, Citation2017; Shaheen et al., Citation2010). Finally and most importantly, it has to be taken into account that all BiciMAD bikes are electric power-assisted bicycles (with an electric pedal assistance up to 25 km per hour).
2.2. Data
BiciMAD’s data analysed in this research has been collected by the Municipal Transport Company (EMT), which is responsible for the management of the BSS. The datasets are publicly available at no cost, through the Municipality’s open data portal called ‘Catálogo de datos’. This website has a usage policy that allows any person to access data and use it for different studies. Each BiciMAD bicycle has a GPS tracker that records its location every 75 s on average. The data set was gathered for one year from September 2017 to September 2018. In this period, 21,460,814 GPS records were collected for a total of 3,737,173 routes, of which 308,695 routes were identified as redistribution tasks of bicycles by the system management. Each of these records contains information on both the origin and the destination stations and docks, type of users (frequent user, occasional user, employee and unknown user), age (in ranges, to anonymize the user’s information), the duration of the journey and the timestamp of the beginning of the journey (at one-hour intervals).
The location and description of the BSS stations, again provided by EMT open data, has also been incorporated to the analysis. From the total number of stations that make up the BSS (173 in the period of time studied), those having different IDs but a similar location (side-by-side) have been grouped together as one, then all the corresponding information has been added accordingly. Thus, a total of 163 stations are included in the analysis. Additionally, the Map includes a background composed of cadastral plots provided by the Spanish Cadastral Electronic Site and the Manzanares River layer from OpenStreetMap (OpenStreetMap contributors, 2020).
2.3. Methodology
The methodology included three phases: data recollection, process and analysis and lastly presenting results. Firstly, the JSON files were downloaded from the open data website of EMT (https://opendata.emtmadrid.es/Home). These files were processed with Python to disaggregate timestamp information into new attributes: year, month, week number, day of week and time of day, and then imported into MongoDB (a free and open non-relational database software). Once the BSS data for all the research period was stored in MongoDB, the information at node level (stations) was exported into multiple GEOJSON files to make the information manageable. Then, using the open GIS software QGIS, GEOJSON files were exported to PostgreSQL (a relational database) in order to apply location queries through the spatial database extender PostGIS.
Two different categories were set according to the weekday information provided in each record. The first category corresponds to the trips that take place on a working day, from Monday to Thursday, but excluding public holidays. The second category covers weekend trips and trips that take place on public holidays. As a particularity of Madrid, it is common that many industries, companies and sectors stop working relatively earlier on Fridays, showing a completely different temporal pattern. That is the reason why trips made on Fridays are excluded as they are considered days of transition whose spatio-temporal dynamics could distort the dynamics of the rest of the days. Additionally, we focus on the analysis of the two provided profiles, frequent users and occasional users.
Taken together, these two profiles and two categories allow us to analyse comparatively the spatial and temporal patterns of BSS users. To this aim, we first grouped BSS records by months to analyse the annual distribution of trips according to the different types of users and weekday categories. Secondly, BSS records were grouped by the time of day to show temporal distribution of trips over the course of the day. Finally, the records were grouped according to the origin and destination stations in order to obtain the spatial dynamics of the types of users and weekday categories. Then, to illustrate the existing spatial dynamic between origins and destinations on the Main Map, we created the flow lines using a SQL query that joins geographic information of BSS stations and the flow weights (average number of trips per day) based on the BSS station ID. In this case, to avoid zero-length lines, the flow line was only drawn when the station ID of origin and destination were different.
The flow maps, illustrated in the Main Map, allow us to see the most frequent trips according to type of users and weekday categories. In addition, we include the number of arrivals and departures for each station, which shows the relevance of each station over the whole BSS and, in consequence, a better understanding of the BiciMAD users’ travel patterns.
3. Results and main map
The results obtained show the different temporal and spatial dynamics in the use of BiciMAD according to the type of user (frequent or occasional) and weekday categories (working days and, weekend and holiday). shows remarkable differences in the average time of use of BSS between frequent users and occasional users.
Table 1. General statistics about trips per type of user and weekday categories.
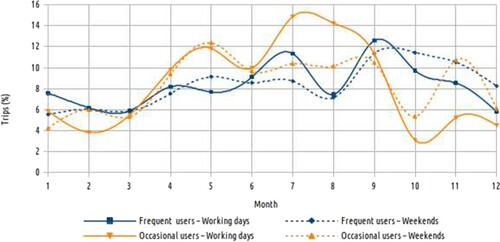
The distribution of trips for occasional users is irregular throughout the year (), taking its maximum values in summer months (July to September) whereas occasional user trips are less relevant in autumn and winter months. The use of the system by potential tourists during these months could be an explanation. When it comes to the trips of frequent users, we can identify a clear seasonality, with higher demand between April and October, during the warm seasons, and a decrease during autumn and winter. August is an outlier in this trend due to the fact that a large percentage of local residents leave the city to spend their holidays abroad.
Figure 1. Distribution of trips throughout the year.
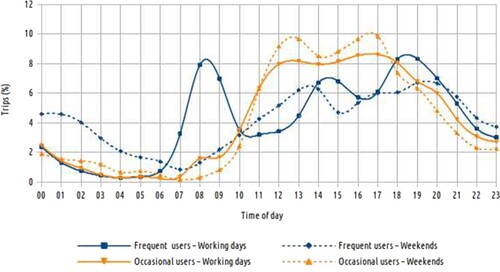
shows the distribution of trips in the course of a day. The figure reveals different patterns according to the type of users and type of day. Occasional users maintain a similar distribution of trips over the course of the day, with a peak in the noon and afternoon (11 am to 6 pm). Nevertheless, the distribution of trips for frequent users shows clear differences. In working days, there are three peaks with high percentage of trips; in the morning, in the afternoon and in the evening. These peaks correspond to commuting trips. On weekends and holidays, the distribution changes, showing no peak hour in the morning but with a remarkable increase of trips at midnight, probably associated to nightlife leisure activities and the fact that certain public transport services shut down at night, such as the underground.
Figure 2. Distribution of trips in the course of a day.
The Main Map illustrates the OD cycling trips from the activity of Madrid BSS, providing an overall view of the cycling footprint and its extension across the city. That allows us to analyse different aspects of the spatial use of the BSS.
One of these aspects to analyse was the potential impact of the topography of the city. The elevation of the city decreases from north to south, being the areas closest to the river the ones with the lowest elevation and the highest presence of hilly streets. This could affect cycling flow making it asymmetrical, with a higher number of users cycling downhill towards the south, an imbalance already detected in cities like Barcelona (Faghih-Imani et al., Citation2017). However, although the map shows some important flow lines with orientation north–south, the secondary maps show that cycling flow is mainly balanced when considering direction (Axis A in frequent users on working days, and axes A, B, C, D and E in frequent users on weekends, and the corresponding ones when considering occasional users). One of the factors that could explain this fact could be that all BiciMAD bikes are e-bikes, which means that cyclists do not need to make an extra effort when going uphill.
Another general question to analyse is the integration of the BSS with the global transportation network. A visual analysis of the map reveals the importance of the flow lines with origin and destination in some relevant transportation hubs such as Atocha train station or Moncloa bus station (Axes D, E and F, in frequent users, working days, and axis E in occasional users, over the weekend). However, the integration of BiciMAD with other transport modes such as underground or bus is difficult to unveil, since the network is more distributed across the city.
Other aspects to analyse are related to the different cycling flow generated by frequent and occasional users, on working days and on weekends. At a first glance, frequent users’ cycling flow is sprawled, covering more areas than that of occasional users who usually concentrate their trips in the more touristic zones (e.g. the city centre with the Royal Palace, Gran Vía, Puerta del Sol, Puerta de Alcalá and Retiro Park, and other surroundings). Another general difference is that on working days, bicycle trips are more equally distributed as people travel for different purposes (work, study, shopping, recreation, etc.) while on weekends, they tend to visit specific places (mostly recreational and leisure), which is why certain axes appear more clearly highlighted, like the north–south axis (Bravo Murillo and San Bernardo streets) or the east–west axis (Mayor and Alcalá streets). In the two weekday categories, the east–west axis is highlighted, showing its importance for cyclists, especially nowadays with the Madrid Central public policy, which is greatly promoting active modes in the city centre.
Regarding frequent users, it is noticed that cycling flow grows on working days around the north districts of Madrid, which are prominently work sites. Instead, on weekends they tend to travel more in the north–south axis, which connects northern residential zones with southern entertainment and touristic places (city centre). Another tendency shown is that frequent users on weekends mostly travel to mid-central Madrid, instead of the city centre, which is more attractive for tourists (occasional users). The mid-central zones are covered with specialised retail and restaurants are abundant. Most frequent users’ trips on working days are made in the late spring-beginning of summer season (July) and September, with a decreased number around the winter months. The time of the day with the highest number of cyclists are peak hours from 8–9 h and from 18–19 h. On weekends most trips are made in September and October (autumn season) with a downsized number of trips in August, which could be related to the summer period, when most Madrilenians go on vacations out of the city. When comparing the graphs of working days and weekends, there is an increase in the use of bicycles for the early hours (from 23–2 h) at weekends, which could be related to night life activities.
As regards occasional users, we can notice, at a first glance, that movements are concentrated in the city centre where the most visited places are located (e.g. the Royal Palace, Puerta del Sol, etc.). Additionally, bicycle trips on weekends cover a more extended area than on working days, with users travelling up to more northern zones (e.g. Santiago Bernabeu Stadium). Moreover, a strong connection between important green recreational spaces is observed between Casa Campo (northwest area) and Matadero Hub-Madrid Rio (southeast area) on both working days and weekends, which supports (Zhou, Citation2015), who also reported that people are willing to bike longer if the urban environment is safe and encouraging. Occasional users mostly travel on bicycles from July to September (as expected for the summer season). On working days, most trips are made from 12–18 h decreasing at night. May and summer season (warm periods) are the most attractive for occasional users, and time periods are similar to the working days, with peaks in the afternoon from 12–18 h. Unlike frequent users, occasional users do not tend to use bicycles as much in the early morning hours (nightlife) and this may be caused by the fact that they do not know the city well enough to take the risk of cycling at night.
4. Conclusions
This study explores the spatial and temporal travel behaviour of frequent and occasional cyclists in BiciMAD. Results show that attractive visiting spots and OD trip matrices drastically change according to the type of user and to the time, day or season, specifically. Frequent users have more sprawled travel patterns than occasional users, due to diverse travel purposes (frequent users mostly for study/work purposes and occasional users mostly for recreational ones). The use of the system by both frequent and occasional users reveals a clear seasonality, with a higher demand in the warmer months, between April and September. In the case of occasional users, seasonality is more dramatic probably because an important percentage of them are tourists. This changing and dynamic behaviour suggests the need to specifically consider every time period and location, when implementing new public policies. Limitations of this study include the fact that it focuses on the mere description of spatio-temporal patterns, although we think is the first step to comprehend urban cycling dynamics in Madrid. However, further research could include other perspectives as modelling this spatio-temporal patterns or including other modes of transportation to see if this dynamic travel behaviour stands or differs across different transport modes, especially those newly-arising forms of mobility (scooter-sharing and moto-sharing schemes).
Software
PostgreSQL 11 (a free and open-source relational database management system) and PostGIS (a free and open-source software that allows PostgreSQL to support geographic objects) were used to process and store JSON information, and to create OD matrix lines. The preliminary maps were created with QGIS 3.6 (a free and open-source cross-platform desktop geographic information system application). Inkscape (a free and open-source vector graphics editor) was used to produce the final map.
JOM_MapReview_r300.pdf
Download PDF (71.2 MB)Acknowledgements
The authors gratefully acknowledge funding from MCIU/ AEI/FEDER, UE (Project DynMobility -RTI2018-098402-B-I00). RTG thanks the Spanish Government for the ‘Juan de la Cierva’ scholarship (Ref FJCI-2017-31662). Map data copyrighted OpenStreetMap contributors and available from https://www.openstreetmap.org
Disclosure statement
No potential conflict of interest was reported by the author(s).
Additional information
Funding
References
- Beecham, R., & Wood, J. (2014). Exploring gendered cycling behaviours within a large-scale behavioural data-set. Transportation Planning and Technology, 37(1), 83–97. https://doi.org/10.1080/03081060.2013.844903
- Borgnat, P., Robardet, C., Abry, P., Flandrin, P., Rouquier, J. B., & Tremblay, N. (2013). A dynamical network view of Lyon’s Vélo’v shared bicycle system. In Modeling and Simulation in Science, Engineering and Technology (Vol. 55, pp. 267–284). https://doi.org/10.1007/978-1-4614-6729-8_13
- Buehler, R., & Pucher, J. (2011). Sustainable transport in Freiburg: Lessons from Germany’s environmental capital. International Journal of Sustainable Transportation, 5(1), 43–70. https://doi.org/10.1080/15568311003650531
- Faghih-Imani, A., Hampshire, R., Marla, L., & Eluru, N. (2017). An empirical analysis of bike sharing usage and rebalancing: Evidence from Barcelona and Seville. Transportation Research Part A: Policy and Practice, 97, 177–191. https://doi.org/10.1016/j.tra.2016.12.007
- Goodman, A., & Cheshire, J. (2014). Inequalities in the London bicycle sharing system revisited: Impacts of extending the scheme to poorer areas but then doubling prices. Journal of Transport Geography, 41, 272–279. https://doi.org/10.1016/j.jtrangeo.2014.04.004
- Lantiga, I. (2017). BiciMad sobrepasará la M-30 y llegará por primera vez a Ciudad Lineal y Vallecas. El Mundo.
- Levy, N., Golani, C., & Ben-Elia, E. (2019). An exploratory study of spatial patterns of cycling in Tel Aviv using passively generated bike-sharing data. Journal of Transport Geography, 76, 325–334. https://linkinghub.elsevier.com/retrieve/pii/S0966692317300492
- Midgley, P. (2011). Bicycle-sharing schemes: enhancing sustainable mobility in urban areas. Back ground Paper No. 8.
- Moncayo-Martinez, L. A., & Ramirez-Nafarrate, A. (2016). Visualization of the mobility patterns in the bike-sharing transport systems in Mexico City. 2016 IEEE International Conference on Industrial Engineering and Engineering Management (IEEM), 1851–1855. https://doi.org/10.1109/IEEM.2016.7798198
- Munkácsy, A., & Monzón, A. (2017). Impacts of smart configuration in Pedelec-sharing: Evidence from a panel survey in Madrid. Journal of Advanced Transportation, 2017, 1–11. https://doi.org/10.1155/2017/4720627
- O’Brien, O., Cheshire, J., & Batty, M. (2014). Mining bicycle sharing data for generating insights into sustainable transport systems. Journal of Transport Geography, 34, 262–273. https://doi.org/10.1016/j.jtrangeo.2013.06.007
- Pucher, J., & Buehler, R. (2017). Cycling towards a more sustainable transport future. Transport Reviews, 37(6), 689–694. https://doi.org/10.1080/01441647.2017.1340234
- Purnama, I. B. I. (2018). Spatiotemporal mining of BSS data for characterising seasonal urban mobility dynamics. International Journal on Advanced Science, Engineering and Information Technology, 8(4), 1270. https://doi.org/10.18517/ijaseit.8.4.6510
- Raviv, T., Tzur, M., & Forma, I. A. (2013). Static repositioning in a bike-sharing system: Models and solution approaches. EURO Journal on Transportation and Logistics, 2(3), 187–229. https://doi.org/10.1007/s13676-012-0017-6
- Romanillos, G., & Gutiérrez, J. (2019). Cyclists do better. Analyzing urban cycling operating speeds and accessibility. International Journal of Sustainable Transportation, 14, 448–464. https://doi.org/10.1080/15568318.2019.1575493
- Romanillos, G., Moya-Gómez, B., Zaltz-Austwick, M., & Lamíquiz-Daudén, P. J. (2018). The pulse of the cycling city: Visualising Madrid bike share system GPS routes and cycling flow. Journal of Maps, 14(1), 34–43. https://doi.org/10.1080/17445647.2018.1438932
- Romanillos, G., & Zaltz Austwick, M. (2016). Madrid cycle track: Visualizing the cyclable city. Journal of Maps, 12(5), 1218–1226. https://doi.org/10.1080/17445647.2015.1088901
- Shaheen, S. A., Guzman, S., & Zhang, H. (2010). Bikesharing in Europe, the Americas, and Asia. Transportation Research Record: Journal of the Transportation Research Board, 2143(1), 159–167. https://doi.org/10.3141/2143-20
- Shu, J., Chou, M. C., Liu, Q., Teo, C.-P., & Wang, I.-L. (2013). Models for effective deployment and redistribution of bicycles within public bicycle-Sharing Systems. Operations Research, 61(6), 1346–1359. https://doi.org/10.1287/opre.2013.1215
- Weinert, J. X., Ma, C., Yang, X., & Cherry, C. R. (2007). Electric Two-wheelers in China. Transportation Research Record: Journal of the Transportation Research Board, 2038(1), 62–68. https://doi.org/10.3141/2038-08
- Zaltz Austwick, M., O’Brien, O., Strano, E., & Viana, M. (2013). The structure of spatial networks and communities in bicycle sharing systems. PLoS ONE, 8(9), e74685. https://doi.org/10.1371/journal.pone.0074685
- Zhou, X. (2015). Understanding spatiotemporal patterns of biking behavior by analyzing massive bike sharing data in Chicago. PLoS ONE, 10(10), e0137922. https://doi.org/10.1371/journal.pone.0137922