
ABSTRACT
Using ALS LIDAR DEM and OpenStreetMap data we visualise in ArcGIS the geomorphic features of a large, lowland river which flows through the area impacted by urbanisation of a big city – the capital of Poland. We present on one map the main geomorphological surfaces and their exact boundaries: valley edge, terrace front and floodplain juxtaposed with buildings and the main transportation corridors. We identify convex aeolian and fluvial landforms: dunes, levees, sandy lobes including crevasse splays, ridges between swales, sandy bars, islands; and concave erosional landforms: floodplain channels, crevasse channels, oxbow lakes, palaeo-meanders, tributary channels, and chute channels. We draw implications for flood management, geo-archaeology geo-heritage conservation. We search for traces of extreme flood events in the Holocene, also on the higher terraces which the river developed by its deposition in the Pleistocene.
© 2021 Grzegorz Wierzbicki. Published by Informa UK Limited, trading as Taylor & Francis Group
1. Introduction
Warsaw has rapidly developed in recent decades, especially after the communism economic system collapsed in 1989 (CitationMantey & Sudra, Citation2019). A strong urbanisation stress has occurred in the city centre where many skyscrapers () and underground structures are being constructed. The city is located on the banks of the Vistula River (Main Map), where the inundation hazard on the floodplain is constant, as well as a risk of erosion and deposition that may come from overbank flow during flooding. Unfortunately, such geomorphological implications are often overlooked in the urban environment (CitationFalkowski, Bujakowski, et al., 2017; CitationKasprzak & Traczyk, Citation2014; CitationMansur et al., Citation2018; CitationMartins et al., Citation2019; CitationMiller et al., Citation2020; CitationŻmudzka et al., Citation2019). The Vistula River valley covers ca. 60% of the Warsaw metropolis.
Progress in GIS modelling using DEMs enables new ways of geomorphological landscape visualisation. In this research, we aim to: (1) present the geomorphological landscape of the Vistula River valley (riverscape) in Warsaw on the Main map; (2) illustrate the degree of an urbanisation on the Main Map; and (3) link the processes of inhabitation and development with respect to geomorphological characteristics.
We adapt the links between geomorphology and urbanisation from the concept of urban geomorphology defined by CitationAllen and Thornbush (Citation2018) (after CitationCoates, Citation1976; CitationCooke, Citation1976; CitationThornbush, Citation2005) as: ‘a pursuit of understanding the impacts that landforms can have on urban area, and vice versa’. Considering the above definition we formulate the following research challenges: (a) is it possible to map the fluvial landscape of the large lowland valley in the big city from a LIDAR DEM, if urban sprawl (cityscape) masks the natural terrain?; (b) which geomorphological features can we reference as evidence of the past geomorphological processes which do not act in todays environment, thus which landforms create a geo-heritage?; (c) which landforms are indicators of present-day and future geo-hazards?
2. Study area
The Vistula is one of the 5 largest rivers of Western and Central Europe (CitationKondracki & Richling, Citation1994; CitationSolon et al., Citation2018) in terms of its length (L = 1211 km measured together with Bug river tribuatry) and its discharge measured at the outlet (Q = 1026 m3 s−1 – CitationLisimenka & Kubicki, Citation2019).
The Vistula River valley in Warsaw covers an area of ca. 350 km2. It belongs to the middle section of the river. The river catchment area computed upstream of Warsaw reaches almost 85,000 km2. The maximum difference between water stages exceeds 7 m. The maximal discharge measured during 2010 flood event was Q = 5.990 m3 s−1 (CitationMagnuszewski et al., Citation2012). The river slope is 0.00027 (0.027%).
Warsaw, according to the Köppen-Geiger classification of the Earth's climate, has a cold climate without a dry season, with a warm summer (type Dfb) (CitationBeck et al., Citation2018; CitationPeel et al., Citation2007). Mean annual temperatures vary from −1.2 up to −0.6°C in the winter and from 18.1 up to 19.1°C in the summer season. Mean annual precipitation sum is 530–580 mm (CitationŻmudzka et al., Citation2019). The Vistula River in Warsaw cuts through a morainic plateau. The plateau form is a flat surface at an average height of 90–100 m a.s.l. The plateau consists of old glacial and fluvioglacial sediments deposited from the Scandinavian Ice Sheet during the Saalian glaciation in the Pleistocene (CitationFalkowski, Bujakowski, et al., 2017; CitationFalkowski, Ostrowski, et al., 2017).
3. Material and methods
3.1. LIDAR DEM
The Digital Elevation Model (DEM / DTM without buildings and trees) was derived from Airborne Laser Scanning (ALS) and used as the cartographical base. The data come from the ISOK project (CitationKurczyński & Bakuła, Citation2013) which addresses the delimitation of flood-prone areas in river valleys in Poland. The acquisition took place after the 2010 flood event, which mostly affected the Vistula River valley (CitationWierzbicki et al., Citation2013, Citation2018, Citation2020). The data were ASCII (XYZ) files with a vertical error of 0.1 m, and spatial resolution of 1, 38 m of elevation difference.
3.2. Software – GIS processing of DEM
Using ArcScene 10.5 (ArcGIS®, Esri) software the ASCII (XYZ) files were transformed into a set of data points as a space (a shapefile point cloud). The shapefiles were converted into raster files. The raster files were mosaiced.
We displayed the DEM in a specific stretch of elevation values corresponding to specific colours extending along a ramp: blue, yellowish white, orange and deep red (compare CitationWierzbicki et al., Citation2013 and Citation2018; CitationOstrowski & Falkowski, Citation2020). We recalibrated the elevation reference level (0 m) so that it corresponded with the mean water stage in the Vistula river channel.
3.3. Geovisualisation of the fluvial landscape and geomorphological mapping
The aim was to map landforms in the valley floor, thus we used an elevation stretch maximum which was lower than the height of landforms located beyond the river valley edge. Landforms located on upper terraces and the morainic plateau were therefore omitted. We displayed the elevations that correspond to the valley edge, the high plains of morainic plateau and upper terraces in a deep red colour. For the river channel, which covers the lowest part of the study area, a blue colour was assigned. The floodplain and lower terraces landforms were displayed using warm colours from yellowish red to orange. Concave landforms on the surface of floodplain were presented using a blue colour, similar to the river channel. Convex landforms on the floodplain, and especially on the lower terraces, are shown in a deep red colour similar to the morainic plateau.
We followed the methods of CitationMossa et al. (Citation2019) on the Lower Mississippi River and CitationJones et al. (Citation2007) on the Dee, the Dyfi and the Teifi Rivers in Wales.
The DEM presents the geomorphological landscape and the following main landforms boundaries were delineated: floodplain, lower terraces, upper terrace and morainic plateau. We additionally, delineated the boundaries of convex and concave landforms that have smaller dimensions, namely: dunes deposited on the surface of river terraces, erosional edges of crevasse channels and other fluvial landforms, such as overbank flow caused by erosion on the surface of floodplain and lower terraces. Verification of dunes was determined from topographical maps (published at a scale of 1:10,000) and geological maps [published at a scale of 1:50,000 – SMGP sheets: 487 Legionowo (CitationNowak, Citation1974), 488 Radzymin (CitationBruj, Citation2009; CitationWłodek, Citation2015), 523 Warszawa Zachód (CitationMorawski, Citation2009), 524 Warszawa Wschód (Sarnacka, Citation1979), 560 Piaseczno (CitationSarnacka, Citation1974)]. We used WMS (Web Map Service) of Head Office of Geodesy and Cartography (www.geoportal.gov.pl) to visualise the topographic map.
3.4. Final map editing and urbanisation mapping
A scale of 1:50,000 and A1 paper size was an appropriate scale for a presenting the Main Map. The Vistula River through Warsaw flows from SSE to NNW, thus we oriented the Main Map vertically.
We presented the boundaries of the main landforms using polylines and we distinguished the valley edge and the terrace fronts using different symbology. Similarly, we presented the edges of crevasse channels (red polylines) and erosional edges of other fluvial landforms (dark blue polylines). For the dunes we assigned polygons filled with black hatching. Additional objects not related to geomorphology were also added: buildings, main roads, railways (derived from OpenStreetMap) and river kilometre markers. We did this in order to include urbanisation, allow the reader to easily find the river and provide an accurate extent of the urban area. We set the urban objects to transparent in order to reduce the masking effect by the cityscape on the geomorphological composition. The masking is particularly apparent in the city centre ().
4. Results
4.1. Geomorphology – floodplain and lower terraces
The floodplain within the study area (Main Map) presents a completely different pattern in three different reaches: (i) upstream from the city centre where the floodplain is wide, (ii) its width in the city centre rapidly decreases and the floodplain disappears, (iii) downstream from the city centre the floodplain widens again. The lower terraces change at the same knickpoints where the floodplain changes. These knickpoints are located by river kilometre markers: km 513 and km 525 ().
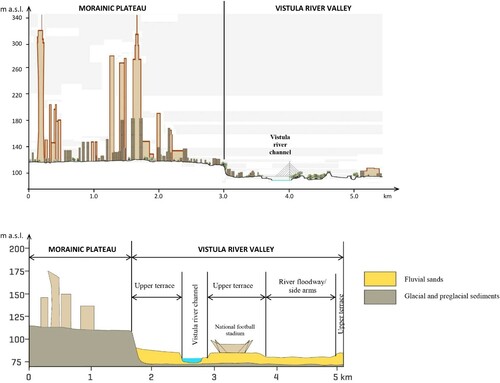
Figure 1. Geomorphological map of the study area (on the left) and geomorphological cross sections (on the right).
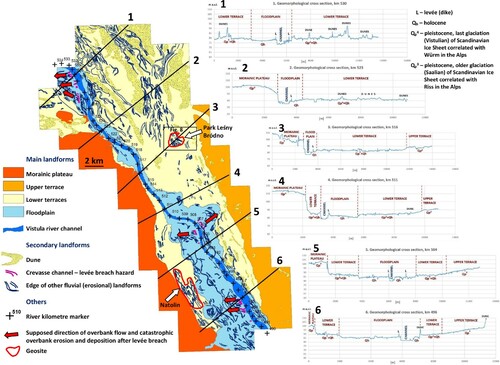
The reach upstream from km 513 (, cross-sections 4–6) presents the following features: lower terraces (width of ca. 2–3 km each) on both sides of the river; clear edge of the morainic plateau on the western side of the river; less visible margin of the valley (upper terrace front) on eastern side; the (lower) terrace front clearly arising from the floodplain on both sides of the river; an asymmetric shape to the floodplain – the western side has the width of 2–4 km and the eastern is reduced to several dozens metres only apart from at km 500 and downstream, where the river turns closer to the NW and the eastern floodplain next to km 507, which reaches almost 3 km in width.
The reach between km 513–525 (, cross sections 2 and 3; also ) shows no floodplain or only a narrow, remnant floodplain; a river channel pushed onto the western valley edge; a high valley edge on the west and a diffuse valley margin on the east; a wide (6–7 km) eastern lower terrace, and a lack of a western lower terrace or a narrow remnant.
The reach downstream from km 525 (, cross section 1) contains a wide floodplain (up to 4 km); clear lower terrace fronts and very diffuse valley edges on both sides of the river; two levels of the lower terraces on the eastern side; and an abrupt increase of the width of lower terraces up to 10–15 km each.
4.2. Convex landforms
The Main Map enables the identification of many convex landforms on flat surfaces of the floodplain and lower terraces. However, man-made structures are the easiest objects to identify. The embankments seem to be the clearest features on the DEM (Main Map) because they assume a linear shape and they dominate the landscape of flat and low-lying land in the floor of the river valley. We obscured the road and the railway embankments by the use of transparent vectors. The embankments, which remain, usually serve as artificial levees (dikes), if they run along the channels. Some other artificial structures also visible on the Main Map are: buildings (despite the fact the DEM was not a DSM), fortifications, national football stadium (next to km 512) and two spoil piles. The spoil piles are accompanied by CHP (Combined Heat and Power stations), and are a byproducts of coal combustion. They arise directly on the river banks and have relatively high elevation in comparison to the adjacent floodplain, thus they appear on the map in a deep red colour next to km 498–500 and next to km 521–522.
Dunes are the most significant natural convex landforms visible on the Main Map. In the southern part of the study area only a few dunes occur, mostly on the eastern side of the river on the terrace front next to km 495–500. The dunes probably mask the eastern valley edge which appears on the Main Map in a diffuse manner. It stays as a diffuse feature along almost all the study area. The dunes look the most spectacular in the northern part of the study area, namely in the reach downstream from the km 522. They appear on the Main Map as orange and red zones, which strikingly contrasts with the yellowish white and bright blue surface of the lower terraces. The dunes dominate in some areas of the lower terraces and can be divided into different types i.e.: sets of linear dunes (seifs) and sets of parabolic (hairpin) dunes. The parabolic ones are higher and larger than seifs. They create longer and wider fields than longitudinal dunes. The edge of the dune fields in many places is straight and sharp, in what looks like an overbank flow erosion effect.
Among the subtle convex geomorphological features visible on the Main Mp we can distinguish many fluvial landforms developed on the floodplain surface: levees (not to be confused with artificial levees), sandy lobes including crevasse splays, ridges between swales or between floodplain channels. Some of the above landforms we can identify also on the lower terraces. Sandy bars and islands occur also in the river channel in the first and third reaches, however, the river channel is beyond the main interest in the present study.
4.3. Concave landforms
The floodplain channels are the most wide-spread concave landforms on the floodplain surface. They occur even on the lower terraces, which was unexpected. Oxbow lakes and palaeo-meanders belong to the next group of landforms which are easily identifiable on the floodplain. The tributary channels of the Vistula River and former side arms of the Vistula river complement a full spectrum of the concave landforms visible on the floodplain. The tributaries usually assume a meandering pattern if they flow through the floodplain. Erosional gullies cut into the surface of riverine islands in the main channel of the Vistula River, and can be identified on the Main Map as well.
We assign a particular significance to crevasse channels, especially in cases where the landform crosses an artificial levee. We marked all the crevasse channels in such locations by a red symbol.
4.4. Urbanisation
The urban area of Warsaw creates a mosaic pattern. Separate zones of dense urbanisation are divided by green surroundings. The city centre creates a core of the urban area. In the past the centre was located just above the western valley edge – a steep and 30 m high escarpment in the morainic plateau cut by the river – compare cross-sections 4 and 5 in Figures 1 and 7. After WW2 the centre moved ca. 2 km to the west from the valley edge to the flat surface of morainic plateau. According to some opinions it will move in the future even further away from the river – into the west, along the 2nd line of the metro (underground railway).
However many other zones of dense urbanisation also exist in the Vistula River valley, mostly on the lower terraces, but some of them on reclaimed land on the floodplain. These urban zones on the floodplain are usually surrounded by erosional landforms, thus they create a pattern of an isolated island from a geomorphological point of view. Presence of undeveloped areas around these urban islands enables interpretation of the fluvial landscape on the DEM (Main Map).
5. Discussion
5.1. Geomorphological implications
The second reach of the Vistula river in the centre of Warsaw tends to be traditionally called a corset (old-fashioned garment worn to hold and train the torso in a slim, desired shape), because it is significantly narrower than the first and third reaches. From a geomorphological standpoint this narrow reach resembles a fluvial landform of a water gap (a narrow passage between wide basins which forms a gorge – CitationFalkowski, Ostrowski, et al., 2017). From the perspective of physico-geographical units of Poland this gorge separates two large regions: the Middle Vistula Valley and the Warsaw Basin (CitationKondracki & Richling, Citation1994; CitationSolon et al., Citation2018). These two regions form an axis deeply cut into the surface of old moraine plateaus which extends between the Upland to the south and the Lakeland on the north of the country (locator map on the Main Map).
These specific geomorphological features: narrowing of the floodplain and the channel, high escarpment of the morainic plateau which arise almost directly from the channel and possibly a ford (shallow place in the river channel created by bedrock protrusion – compare CitationFalkowski, Ostrowski, et al., 2017) had forced people to inhabitat such a location in the Middle Ages.
The results of our study should be compared to similar research which aimed at presenting the geomorphological features of the study area. Although, the Vistula River for Poles appears to be an iconic watercourse (CitationAngiel & Angiel, Citation2015) and the capital city has a very unique location along the Middle Vistula River valley, we have found only five studies which focus on a geomorphological presentation of this particular site (CitationBiernacki, Citation1971; CitationFalkowski, Citation1982; CitationMojski, Citation1980; Sarnacka, Citation1980; CitationWałdykowski & Adamczyk, Citation2018) ().
Figure 2. Geomorphological map of Warsaw at a scale of 1:100,000 (Sarnacka, Citation1980).
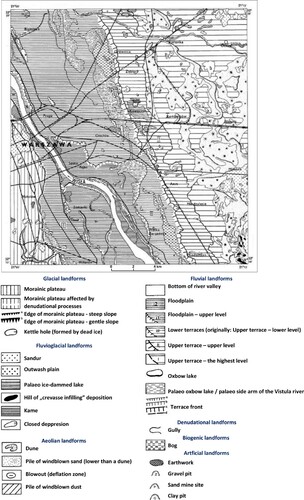
Figure 3. Geomorphological sketch of the Vistula River Valley in Warsaw by CitationFalkowski (Citation1982).
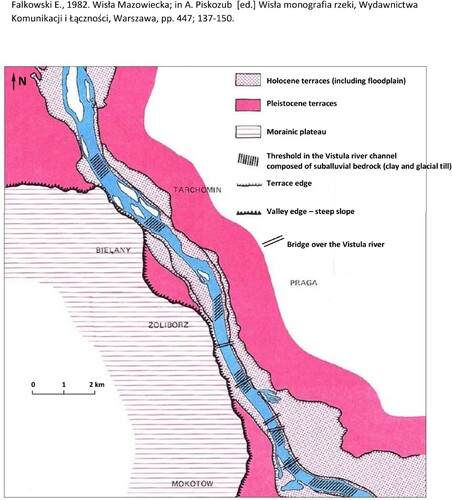
Figure 4. Geomorphological Map of Poland at a scale of 1:500,000 (CitationMojski, Citation1980; CitationRoszko, Citation1980; CitationStarkel, Citation1980).
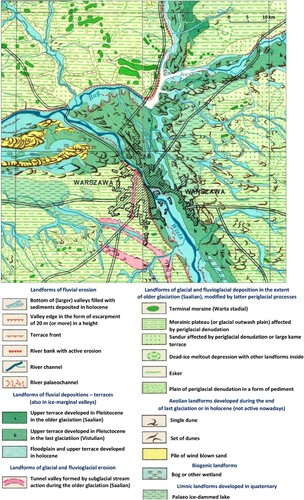
Figure 5. Geomorphological map of the Vistula River Valley in Warsaw at a scale of 1:70,000 (CitationBiernacki, Citation1971). http://architektura.um.warszawa.pl/sites/default/files/Mapa_Geomorfologia_nw.pdf
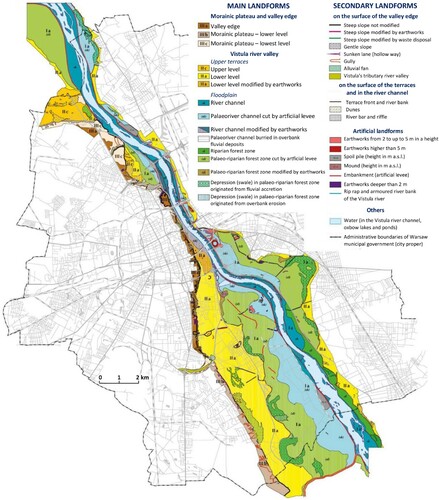
Figure 6. Geomorphological map of Warsaw at a scale of 1:20,000 (CitationWałdykowski & Adamczyk, 2008, Warsaw Ecophysiographical Atlas).

Figure 7. Geomorphological cross sections of the Vistula river valley in Warsaw (CitationWałdykowski & Wasilewski, Citation2018, Warsaw Ecophysiographical Atlas, CitationWałdykowski & Wierzbicki, Citation2012).
We consider geomorphological maps – a supplementary dataset complementing geological maps (SMGP; CitationBer [2005]), as the most reliable material in Polish Lowland for basic research on landforms. Unfortunately, the published maps were not at a scale accurate enough for a comparison (1:100.000). Every sheet has a different legend and usually the cartographic presentation is of poor quality, which significantly limits the possibility of geomorphological analysis of a larger area or comparison between adjacent sheets. Sheet 524 – Warsaw East (Sarnacka, Citation1980) covers the largest part of the study area – .
CitationFalkowski (Citation1982) published a sketch which presents five main geomorphological features of the study area (floodplain, terraces, steep valley edge cut into the morainic plateau, front terraces) combined with the locations of sub-alluvial bedrock protrusions in the river channel, names of Warsaw's districts and five bridges which existed at that time ().
The Geomorphological Map of Poland at a scale 1:500,000 (CitationStarkel, Citation1980) covers the study area by two sheets (Gdańsk, CitationRoszko [1980]; Warsaw, CitationMojski [1980]). Unfortunately, the small scale of the map limits its usefulness for comparison, but it does enable some geomorphological implications at a regional scale () to be identified.
CitationBiernacki (Citation1971) published a geomorphological map of the Vistula River Valley in Warsaw at a scale 1:35,000, however, the access to this map is limited. It was transformed into vector a dataset in 2000, and published on-line at a scale 1:70,000 (). The map includes 3 river terraces, 7 levels of floodplain and 9 types of landforms on the floodplain. The large number of distinguished features and odd names assigned by Biernacki to these features make this presentation very difficult to understand.
CitationWałdykowski and Adamczyk (Citation2018) published a geomorphological map of Warsaw at a 1:20,000 scale. It seems to be the most detailed presentation of the study area until today ().
CitationBiernacki (Citation1971) limited coverage of his presentation to the eastern side of the river, only tens metres behind the front of terraces, similar to CitationFalkowski (Citation1982). We assume they did so, because they considered only the floodplain shaped by the river in the Holocene. The river does not flow on terraces during the Holocene, beacause the terraces remain at a level higher than the maximal possible water stage of the present-day river. The terraces were modelled in the Pleistocene.
We suppose, in contrast to what CitationBiernacki (Citation1971) and CitationFalkowski (Citation1982) believed, that overbank flow eroded the surface of the lower terraces in the Holocene. The terraces undoubtedly have a Pleistocene age. We based our assumptions on two facts: (i) a number of erosional landforms of fluvial origin are located on the lower terraces, they look too fresh to be modelled in the Pleistocene; (ii) dunes on the lower terraces have sharp edges created by erosional action of overbank flow from the river. Wind developed the dunes on terraces in the very late Pleistocene (older and younger dryas) according to CitationDylikowa (Citation1969). If it is the case that overbank flow has eroded them, then it had to occur in the Holocene.
The results of hydrological modelling, as well as the extent of historical flood events confirm our assumptions (CitationGutry-Korycka & Golebiowska, Citation2015; CitationMagnuszewski & Gutry Korycka, Citation2009).
In the third reach, our map presents two large arms of a floodway wich has conveyed enormous volumes of water during Holocene floods from the Vistula River to the Bug and the Narew Rivers. CitationMojski (Citation1980) marked these floodway channels on his geomorphological map. We suppose that these floodways have been active especially during the flood events induced by ice-jams (CitationPawłowski, Citation2016). They worked similarly to the Atchafalaya floodway, just above the outlet of the Mississippi River to the Atlantic Ocean (CitationMossa et al., Citation2019).
5.2. Implications for flood management
A clear view of the floodplain extent and artificial levees enables support for potential flood event management, especially when a levee breach scenario is considered (CitationWierzbicki et al., Citation2020). Using the riverscape presentation technique it allows the identification of hazardous zones in the floodplain. Such zones are exposed to the risk of levee breach due to the groundwater flow through the buried crevasse channels under the artificial levee (CitationBujakowski & Falkowski, Citation2019; CitationWierzbicki et al., Citation2018, Citation2020).
We predict that an extreme flood event can result in levee breach and associated catastrophic erosion and deposition of overbank flow in the following locations of the floodplain on the western bank next to km: 494–496, 505–506, 528,5–529; 530–531; and on the eastern bank – km 505,5–507 (red arrows, and Main Map).
5.3. Implications for geo-heritage conservation
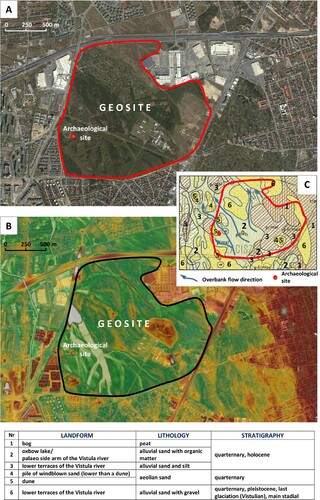
We consider a riverscape of the study area as representing a geo-heritage of Warsaw city (CitationMikhailenko & Ruban, Citation2019; CitationZwoliński et al., Citation2017). A set of floodplain channels cut into the surface of eastern lower terrace in the second reach next to km 517 (, ) is undoubtedly the most valuable place (Park Leśny Bródno / Las Bródnowski), because it appears as the only one which remains. In addition, it is evidence of a linkage between the Vistula River and the floodway heading to the Narew and the Bug Rivers. It is also an example of an archaeological site, where a gord (medieval fortified wooden settlement) was built on the dune surrounded by wetlands ().
Figure 8. Park Leśny Bródno / Las Bródnowski geosite on different maps: (A) orthoimage derived from www.geoportal.gov.pl, (B) LIDAR DEM and orthophoto derived from www.geoportal.gov.pl, (C) geological map (Sarnacka, Citation1979).
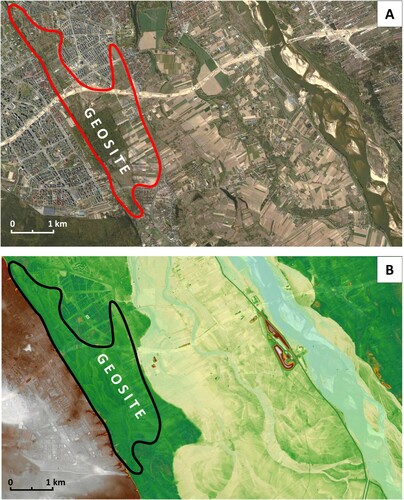
Similar landforms (a type of floodplain channel) occur also in another district of Warsaw, in Wilanów,, where the development of the urban area in recent decades has rapidly masked erosional channels cut into the western lower terrace. The landforms, which have not been covered by newly constructed buildings yet (), remain in Natolin next to km 500 ( between cross sections 6 and 5).
Figure 9. Natolin geosite on different maps: (A) orthoimage derived from www.geoportal.gov.pl, (B) LIDAR DEM and orthophoto derived from www.geoportal.gov.pl
6. Conclusions
The LIDAR DEM geovisualisation of the riverscape enables fast and easy identification of the main geomorphological surfaces and their exact boundaries: river valley edge, front of terraces and floodplain extent.
A geomorphologist can also identify more subtle landforms developed on the floor of the river valley using raw DEM information. However, this would only be the case if the landform shapes are sufficiently convex or concave to be seen on the model.
The possible convex landforms that were identified are: dunes, a type of dune, levees, sandy lobes including crevasse splays, ridges between swales or between floodplain channels, sandy bars, and islands.
The possible concave landforms that were identified are: floodplain channels, oxbow lakes, palaeo-meanders, tributary channels and their pattern, chute channels and crevasse channels.
We indicated five locations of crevasse channels crossed with artificial levees. We interpret these locations as a zone especially exposed for the hazard of levee breach and associated erosion and deposition of overbank flow. The following settlements are especially endangered by catastrophic effects of flood: Obórki, Kępa Oborska, Kępa Okrzeska, Siekierki, Las (near Praga Południe), Łomianki Dolne and Kępa Kiełpińska.
A large and fast developing city masks the natural fluvial landscape. Geovisualisation of a riverscape in the urban area enables omitting the limitations that come from urbanisation.
Geovisualisation of the riverscape (that is covered in urban areas by the cityscape) has many implications for geomorphology, flood management, geo-heritage conservation and geo-archaeology.
We postulate the foundation of new geosites in Warsaw city: (1) Las Bródnowski (Park Leśny Bródno) and (2) in Natolin () due to the significant value of the floodplain channels at these locations. Although these landforms remain on the Pleistocene lower terrace (an area that used to be considered as a not flood-prone zone), they prove the existence of the traces of Holocene flood activity on these terraces. The (1) Park Leśny Bródno geosite () is valuable as: (i) evidence of the floodway which had conveyed flood water from the Vistula River into the Bug and the Narew Rivers along Zegrzyński channel, (ii) an area for further geo-archaeological study (CitationWelc et al., Citation2018; CitationZawadzka-Pawlewska & Tsermegas, Citation2017).
Software
Using ArcScene 10.5 (ArcGIS®, Esri) software installed on GIS workstation computer with Intel® Xeon® CPU E5-1650 v4 @ 3.60 GHz processor we transformed the ASCI (XYZ) files (LIDAR DEM) into a set of data points in a space (a point cloud). We saved the data as a SHAPE file, namely many files. Each SHAPE file consists of 1 up to 13 sheets of the original ASCI (XYZ) map at a scale of 1:5.000. Afterwards, we transformed each of the SHAPE files into a raster file. Next, we unified a symbology (we merge attributes) of all the raster files by a creation of a mosaic. Next, we transformed the mosaic into a final raster data setand we saved it in the form of one SHAPE file. We additionaly built pyramides on the SHAPE file. The pyramides facilitate drawing cross-sections and reading an elevation from the SHAPE file.
Using ArcMap 10.5 (ArcGIS®, Esri) we displayed the final SHAPE file in a specific stretch of elevation valuescorresponding to specific colours extending along a ramp: blue, yellowishwhite,orange and deep red (compare Wierzbicki et al. Citation2018).
Supplemental Material
Download PDF (67.9 MB)Acknowledgement
The idea to take up a challenge of drawing the Main Map which we published in this paper appeared in the mind of the corresponding author as a result of receiving a Special Issue call addressed to the members of Polish Association of Geomorphologist (SGP) and sent on January 15th, 2019. The corresponding author thanks to SGP authorities for the efficient communication.
We thank Piotr Wałdykowski who allowed us to publish his unpublished Geomorphological Map of Warsaw (Wałdykowski & Adamczyk, Citation2018).
The authors acknowledge ca. 100 comments, suggestions and remarks received on May 6th, 2020 from 6 Reviewers: (1) Paweł Molewski representing Nicolaus Copernicus University in Toruń (Poland); (2) Enrico Miccadei representing Università ‘G. d’Annunzio’ di Chieti Pescara (Italy), (3) Ewa Smolska representing University of Warsaw (Poland), (4) Heike Apps representing Geoscience Australia, (5) Giedrė Beconytė representing Vilnius University (Lithuania) and (6) Cecilia Furlan represeneting Delft University of Technology (the Netherlands) & KU Leuven (Belgium). The order of Reviewers above is assigned by the Editor.
Last but not least, we thank Tim Brewer representing Cranfield University (England) for proof-reading of the revised version of the MS and worthwhile commentaries.
Disclosure statement
No potential conflict of interest was reported by the author(s).
Additional information
Funding
References
- Allen, C. D., & Thornbush, M. J. (2018). Chapter 1 – Introduction. In C. D. Allen & M. J. Thornbush (Eds.), Urban geomorphology (pp. 1–6). Elsevier. https://doi.org/10.1016/B978-0-12-811951-8.00001-1
- Angiel, J., & Angiel, P. (2015). Perception of river value in education for sustainable development (The Vistula River, Poland). Sustainable Development, 23(3), 188–201. https://onlinelibrary.wiley.com/doi/full/10.1002/sd.1586 https://doi.org/10.1002/sd.1586
- Beck, H. E., Zimmermann, N. E., McVicar, T. R., Vergopolan, N., Berg, A., & Wood, E. F. (2018). Present and future Köppen-Geiger climate classification maps at 1-km resolution. Scientific Data, 5. https://doi.org/10.1038/sdata.2018.214
- Ber, A. (2005). The detailed Geological Map of Poland 1:50,000: The history, present and future. Polish Geological Review, 53(10/2), 903–906. https://www.pgi.gov.pl/images/stories/przeglad/pdf/pg_2005_10_2_07.pdf
- Biernacki, Z. (1971). Holocene and late Pleistocene alluvial deposits of the Vistula river in Warsaw. Proceedings from the conference Holocene palaeogeography of river valleys in Vistula river basin. Quartenary Research Committee of PAN. Warszawa (in Polish).
- Bruj, M. (2009). Szczegółowa Mapa Geologiczna Polski. Arkusz 488 Radzymin. (autor zdjęcia geologicznego w l.2003-2005). PIG-PIB. Warszawa (in Polish). http://bazadata.pgi.gov.pl/data/smgp/arkusze_skany/smgp0488.jpg
- Bujakowski, F., & Falkowski, T. (2019). Hydrogeological analysis supported by remote sensing methods as a tool for assessing the safety of embankments (case study from Vistula River Valley, Poland). Water, 11(2), 266. https://www.mdpi.com/2073-4441/11/2/266 https://doi.org/10.3390/w11020266
- Coates, D. R. (1976). Introduction. In D. R. Coates (Ed.), Urban geomorphology (pp. 1–5). The Geol. Soc. of America, Inc.
- Cooke, R. U. (1976). Urban geomorphology. The Geographical Journal, 142(1), 59–65. https://www.jstor.org/stable/1796025 https://doi.org/10.2307/1796025
- Dylikowa, A. (1969). Problematyka wydm śródlądowych w Polsce w świetle badań strukturalnych. Journal of Geographical Studies, 75, 39–74. (in Polish with English and Russian summary). http://www.rcin.org.pl/Content/14284/WA51_21926_r1969_nr75_Prace-Geogr.pdf p.:75-79/405 of the PDF file
- Falkowski, E. (1982). Wisła Mazowiecka. In A. Piskozub (Ed.), Wisła monografia rzeki (pp. 137–150/447). Wydawnictwa Komunikacji i Łączności. (in Polish).
- Falkowski, T., Bujakowski, F., Wierzbicki, G., & Ostrowski, P. (2017). Involving a lithogenetic analysis to the model of groundwater flow dynamics in the marigin of large river valley. Scientific Review – Engineering and Environmental Sciences, 26/4, 514–527. (in Polish with English summary). https://doi.org/10.22630/PNIKS.2017.26.4.49
- Falkowski, T., Ostrowski, P., Siwicki, P., & Brach, M. (2017). Channel morphology changes and their relationship to valley bottom geology and human interventions; a case study from the Vistula Valley in Warsaw, Poland. Geomorphology, 297, 100–111. https://doi.org/10.1016/j.geomorph.2017.09.011
- Gutry-Korycka, M., & Golebiowska, I. (2015). Hydrological alteration of an ice-marginal valley and its influence on the extent of historical floods. Hydrological Sciences Journal, 60(3), 482–497. https://doi.org/10.1080/02626667.2014.885652
- Jones, A. F., Brewer, P. A., Johnstone, E., & Macklin, M. G. (2007). High-resolution interpretative geomorphological mapping of river valley environments using airborne LiDAR data. Earth Surface Processes and Landforms, 32(10), 1574–1592. https://onlinelibrary.wiley.com/doi/pdf/10.1002/esp.1505 https://doi.org/10.1002/esp.1505
- Kasprzak, M., & Traczyk, A. (2014). LiDAR and 2D electrical resistivity tomography as a supplement of geomorphological investigations in urban areas: A case study from the City of Wrocław (SW Poland). Pure and Applied Geophysics, 171(6), 835–855. https://doi.org/10.1007/s00024-013-0693-7
- Kondracki, J., & Richling, A. (1994). Regiony ficzycznogeograficzne. Atlas Rzeczypospolitej Polskiej [Physico-geographical regions. Atlas of the Republic of Poland], GGK, Warsaw, Poland, Map sheet 53.3 (in Polish with English translation).
- Kurczyński, Z., & Bakuła, K. (2013). Generation of countrywide reference digital terraine model from airborne laser scanning in ISOK project. Archiwum Fotogrametrii, Kartografii i Teledetekcji, 2013, 59–68. (in Polish). http://ptfit.sgp.geodezja.org.pl/wydawnictwa/monografia/09-Kurczynski.pdf. ISBN: 978-83-61576-26-7.
- Lisimenka, A., & Kubicki, A. (2019). Bedload transport in the Vistula River mouth derived from dune migration rates, southern Baltic Sea. Oceanologia, 61(3), 384–394. https://doi.org/10.1016/j.oceano.2019.02.003
- Magnuszewski, A., & Gutry Korycka, M. (2009). Reconstruction of the Vistula River extreme floods passage through the City of Warsaw in natural river conditions. Studies in Geography, 43, 141–151. (in Polish with English summary). http://wgsr.uw.edu.pl/wgsr/wp-content/uploads/2018/11/Magnuszewski.pdf
- Magnuszewski, A., Gutry-Korycka, M., & Mikulski, Z. (2012). Historyczne i współczesne warunki przepływu wód wielkich w Warszawie. Gospodarka Wodna, 1/2012, 9–18. (in Polish).
- Mansur, A. V., Brondizio, E. S., Roy, S., Soarres, P. P. D. A., & Newton, A. (2018). Adapting to urban challenges in the Amazon: Flood risk and infrastructure deficiencies in Belém, Brazil. Regional Environmental Change, 18(5), 1411–1426. https://doi.org/10.1007/s10113-017-1269-3
- Mantey, D., & Sudra, P. (2019). Types of suburbs in post-socialist Poland and their potential for creating public spaces. Cities, 88, 209–221. https://doi.org/10.1016/j.cities.2018.11.001
- Martins, M. M. C., Gomes, A. A. T., & Santos, P. P. (2019). Delimitation of flood-prone areas in the urban center of Amarante, north of Portugal, using the Iber software. Revista Brasileira de Geomorfologia, 20, 185–200. https://doi.org/10.20502/rbg.v20i1.1407
- Mikhailenko, A. V., & Ruban, D. A. (2019). Geoheritage in deltaic environments: Classification notes, case example, and Geopark implication. Environments, 6/2(2), 18. https://www.mdpi.com/2076-3298/6/2/18 https://doi.org/10.3390/environments6020018
- Miller, J. D., Stewart, E., Hess, T., & Brewer, T. (2020). Evaluating landscape metrics for characterising hydrological response to storm events in urbanised catchments. Urban Water Journal, 17(3), 247–258. https://doi.org/10.1080/1573062X.2020.1760320
- Mojski, J. E. (1980). Przeglądowa Mapa Geomorfologiczna Polski 1:500 000; arkusz Warszawa. IGiPZ PAN, Warszawa (in Polish).
- Morawski, W. (2009). Szczegółowa Mapa Geologiczna Polski. Arkusz 523 Warszawa zachód. Inst.Geol. Warszawa (in Polish). http://bazadata.pgi.gov.pl/data/smgp/arkusze_skany/smgp0523.jpg
- Mossa, J., Chen, Y. H., & Wu, C. Y. (2019). Geovisualization geoscience of large river floodplains. Journal of Maps, 15(3), 75–91. https://doi.org/10.1080/17445647.2019.1584129
- Nowak, J. (1974). Szczegółowa Mapa Geologiczna Polski. Arkusz 487 Legionowo. Inst.Geol. Warszawa. (in Polish). http://bazadata.pgi.gov.pl/data/smgp/arkusze_skany/smgp0487.jpg
- Ostrowski, P., & Falkowski, T. (2020). Application of remote sensing methods to study the relief of Lowland River valleys with a complex geological structure-a case study of the Bug River. Water, 12(2), 487. https://doi.org/10.3390/w12020487
- Pawłowski, B. (2016). Internal structure and sources of selected ice jams on the lower Vistula River. Hydrological Processes, 30(24), 4543–4555. https://kopernio.com/viewer?doi=10.1002/hyp.10951&route=6 https://doi.org/10.1002/hyp.10951
- Peel, M. C., Finlayson, B. L., & McMahon, T. A. (2007). Updated world map of the Koppen-Geiger climate classification. Hydrology and Earth System Sciences, 11(5), 1633–1644. https://www.hydrol-earth-syst-sci.net/11/1633/2007/hess-11-1633-2007.pdf https://doi.org/10.5194/hess-11-1633-2007
- Roszko, L. (1980). Przeglądowa Mapa Geomorfologiczna Polski 1:500 000; arkusz Gdańsk. IGiPZ PAN, Warszawa (in Polish).
- Sarnacka, Z. (1974). Szczegółowa Mapa Geologiczna Polski 1:50 000. Arkusz Piaseczno (560), Inst.Geol, Warszawa (in Polish). http://bazadata.pgi.gov.pl/data/smgp/arkusze_skany/smgp0560.jpg
- Sarnacka, Z. (1979). Szczegółowa Mapa Geologiczna Polski 1:50 000. Arkusz Warszawa Wschód (524), Wydawnictwa Geologiczne, Warszawa (in Polish). http://bazadata.pgi.gov.pl/data/smgp/arkusze_skany/smgp0524.jpg
- Sarnacka, Z. (1980). Objaśnienia do Szczegółowej Mapy Geologicznej Polski 1:50 000. Arkusz Warszawa Wschód (524), Wydawnictwa Geologiczne, Warszawa (in Polish). http://bazadata.pgi.gov.pl/data/smgp/arkusze_txt/smgp0524.pdf (geomorphological sketch at scale 1:100 000 is available in p.94/100 of the PDF file)
- Solon, J., Borzyszkowski, J., Bidłasik, M., Richling, A., Badora, K., Balon, J., Brzezińska-Wójcik, T., Chabudziński, Ł, Dobrowolski, R., Grzegorczyk, I., Jodłowski, M., Kistowski, M., Kot, R., Krąż, P., Lechnio, J., Macias, A., Majchrowska, A., Malinowska, E., Migoń, P., … Ziaja, W. (2018). Physico-geographical mesoregions of Poland: Verification and adjustment of boundaries on the basis of contemporary spatial data. Geographia Polonica, 91(2), 143–170. https://doi.org/10.7163/GPol.0115
- Starkel, L. (Ed.). (1980). Przeglądowa Mapa Geomorfologiczna Polski 1:500 000. IGiPZ PAN. (in Polish).
- Thornbush, M. (2005). Geography, urban geomorphology and sustainability. Area, 47(4), 350–353. https://doi.org/10.1111/area.12218
- Wałdykowski, P., & Adamczyk, J. (2018). Formy rzeźby terenu. Załącznik 1. In: Szulczewska B., Cieszewska A., Giedych R. Wałdykowski P., Adamczyk J., Maksymiuk G., Dudek-Klimiuk J., Suchocka M., Wasilewski M., Winiarska A., Fogel P., Łaska M., Majchrzak A., Cichocki M., Kiczyńska A., Weigle A., Sikorski P., Strużyński W., Węgrzynowicz A., Horbacz A., Fic M.,Kręgiel J., Grądziel I., Lewiński S., Aleksandrowicz S. Atlas ekofizjograficzny miasta stołecznego Warszawy. Katedra Architektury Krajobrazu Szkoły Głównej Gospodarstwa Wiejskiego w Warszawie & Krajowy Instytut Polityki Przestrzennej i Mieszkalnictwa. Warszawa. (in Polish).
- Wałdykowski, P., & Wasilewski, M. (2018). Przekrój przez poziomy geomorfologiczne w układzie Śródmieście – Praga-Północ. Fig. 9 In: Szulczewska B., Cieszewska A., Giedych R. Wałdykowski P., Adamczyk J., Maksymiuk G., Dudek-Klimiuk J., Suchocka M., Wasilewski M., Winiarska A., Fogel P., Łaska M., Majchrzak A., Cichocki M., Kiczyńska A., Weigle A.,Sikorski P., Strużyński W., Węgrzynowicz A., Horbacz A., Fic M.,Kręgiel J., Grądziel I., Lewiński S., Aleksandrowicz S. Atlas ekofizjograficzny miasta stołecznego Warszawy. Katedra Architektury Krajobrazu Szkoły Głównej Gospodarstwa Wiejskiego w Warszawie & Krajowy Instytut Polityki Przestrzennej i Mieszkalnictwa. Warszawa. (in Polish). https://architektura.um.warszawa.pl/sites/default/files/files/atlas_ekofizjograficzny.pdf
- Wałdykowski, P., & Wierzbicki, G. (2012). Wisła Warszawska – rzeka ubrana w gorset. Zarys Geomorfologii. Projekt pt.: Ochrona siedlisk kluczowych gatunków ptaków Doliny Środkowej Wisły w warunkach intensywnej presji aglomeracji warszawskiej. (in Polish). http://wislawarszawska.pl/wp-content/uploads/2015/12/geomorfologia-print.pdf
- Welc, F., Nitychoruk, J., Solecki, R., Rabiega, K., & Wysocki, J. (2018). Results of integrated geoarchaeological prospection of unique iron age hillfort located on Radomno Lake island in north-eastern Poland. Studia Quaternaria, 35(1), 55–71. http://archive.sciendo.com/SQUA/squa.2018.35.issue-1/squa-2018-0004/squa-2018-0004.pdf https://doi.org/10.2478/squa-2018-0004
- Wierzbicki, G., Ostrowski, P., & Falkowski, T. (2020). Floodplain geomorphology and flood management in the Lower Vistula River upstream from Plock (Poland). Open Geoscience, 12(1), 1003–1016. https://doi.org/10.1515/geo-2020-0102
- Wierzbicki, G., Ostrowski, P., Falkowski, T., & Mazgajski, M. (2018). Geological setting control of flood dynamics in lowland rivers (Poland). Science of the Total Environment, 636, 367–382. https://doi.org/10.1016/j.scitotenv.2018.04.250
- Wierzbicki, G., Ostrowski, P., Mazgajski, M., & Bujakowski, F. (2013). Using VHR multispectral remote sensing and LIDAR data to determine the geomorphological effects of overbank flow on a floodplain (the Vistula River, Poland). Geomorphology, 183, 73–81. https://doi.org/10.1016/j.geomorph.2012.06.020
- Włodek, M. (2015). Szczegółowa Mapa Geologiczna Polski. Arkusz 488 Radzymin. (redaktor arkusza). PIG-PIB. Warszawa (in Polish). http://bazadata.pgi.gov.pl/data/smgp/arkusze_skany/smgp0488.jpg
- Zawadzka-Pawlewska, U., & Tsermegas, I. (2017). Olęder settlement impact on morphology of the Vistula river floodplain. Kępa Kiełpińska case study. Landform Analysis, 33, 49–56 (in Polish with English summary). http://geoinfo.amu.edu.pl/sgp/LA/LA33/landfana-033-006.pdf https://doi.org/10.12657/landfana-033-006
- Żmudzka, E., Kulesza, K., Lenartowicz, M., Leziak, K., & Magnuszewski, A. (2019). Assessment of modern hydro-meteorological hazard in a big city – identification for Warsaw. Meteorological Applications, 26, 500–510. https://doi.org/10.1002/met.1779
- Zwoliński, Z., Hildebrandt-Radke, I., Mazurek, M., & Makohonienko, M. (2017). Existing and proposed urban geosites values resulting from geodiversity of Poznań city. Questions Geographicae, 36(3), 125–149. https://www.degruyter.com/downloadpdf/j/quageo.2017.36.issue-3/quageo-2017-0031/quageo-2017-0031.xml https://doi.org/10.1515/quageo-2017-0031
Web references
- Geoportal of Head Office of Geodesy and Cartography. www.geoportal.gov.pl
- Warsaw Ecophysiographical Atlas (in Polish). http://architektura.um.warszawa.pl/atlas-ekofizjograficzny