
ABSTRACT
The knowledge of flood-induced ground effects and flood-water dynamics is a crucial issue for hydro-geomorphic hazards assessment and mapping, and thus for river management and land use planning. This paper and the related 1:15,000 map illustrate the lower Orba River (NW Italy) and its adjacent floodplain geomorphic response to the 21–22 October 2019 extreme flood. This was estimated to be a 500-years flood and caused severe damage to cultivated fields, structures, and infrastructures. The research is based on extensive post-flood field surveys, ante- and post-flood GNSS surveys, and aerial photographs interpretation. Intense in-channel sediment mobilization, bank retreats, and channelization structures collapses were surveyed. Furthermore, alluvial gullies, overbank deposits, crevasse splays, and surficial-erosion evidences were mapped over the floodplain, along with the flooded area (17.65 km2) and the flood-water features. A specific legend developed for flood-related and anthropogenic elements mapping in a typical lowland agricultural landscape with regulated rivers is proposed.
1. Introduction
River-related floods occur frequently in large areas of the world (CitationBathrellos et al., 2018), and are the most prevalent natural hazard and among the most damaging events in Europe (CitationEEA, 2010, Citation2016; CitationGaume et al., 2009; CitationKundzewicz et al., 2013, Citation2018; CitationLlasat et al., 2010). Long lists of past inundations and relative damage testify the relevant flood-proneness of Italy (CitationBrandolini et al., 2020; CitationFaccini et al., 2015, Citation2016; CitationLuino et al., 2002; CitationMandarino et al., 2019a, Citation2020a; Pavese et al., Citation1992; CitationRoccati et al., 2020; CitationSalvati et al., 2012; CitationZani, 2000), where there were 581 deaths and 171,764 evacuated and homeless due to floods in the 50-years period 1969–2018 (CitationCNR-Polaris, 2019), and about thirty floods and a hundred victims from 2010 to 2019 (CitationPaliaga et al., 2020).
Floods are natural and common phenomena associated with river dynamics, which become ‘natural disasters’ when impact on humans and their activities (CitationBenito & Hudson, 2010; CitationTalbot et al., 2018). Man’s use of catchments and anthropogenic interventions along fluvial stems have impacted worldwide upon the severity and consequences of floods (CitationCasale et al., 1998; CitationGregory, 2006), often increasing river-related risks against a generalized riverine-area occupation and riverbed channelization (CitationCencetti et al., 2017; CitationLuino, 1999; CitationLuino et al., 2012; Mandarino et al., Citation2019b; CitationSerrano-Notivoli et al., 2017; CitationWyzga, 1996). Floods can cause loss of lives and severe damage to structures, infrastructures, and human activities, and may result in catastrophic social, economic, and environmental consequences (CitationMerz et al., 2010, CitationEEA, 2010). The knowledge of floods in terms of flood-induced ground effects (FIGEs), i.e. riverbed and floodplain geomorphic response and anthropogenic-elements damage, and flood-water dynamics (FWDs), such as inundated area, flood-flow direction, and flood-water levels, is a crucial issue for hydro-geomorphic hazards assessment and mapping, and thus for the implementation of measures for river-related hazards and risks reduction (CitationHooke, 2015).
Numerous researches focusing on flooded area mapping, generally based on models or remotely-sensed data (CitationDe Musso et al., 2018; CitationGuerriero et al., 2018, Citation2020; CitationRomanescu et al., 2017; CitationSegura-Beltrán et al., 2016), and on riverbed geomorphic response analysis and mapping (CitationFuller, 2008; CitationHeritage et al., 2004; CitationHooke, 2016; CitationMorche et al., 2007; CitationRinaldi et al., 2016; CitationThompson & Croke, 2013; CitationYousefi et al., 2018), were conducted worldwide to investigate high-magnitude floods dynamics. Furthermore, several studies analyzed ground effects triggered by intense rainfalls and floods specifically in mountain and hilly areas (CitationBartelletti et al., 2017; CitationBorrelli et al., 2015; CitationCevasco et al., 2012, Citation2015, Citation2017; CitationPepe et al., 2019a, Citation2019b; CitationRago et al., 2017; CitationSanto et al., 2017; CitationTessitore et al., 2011). In contrast, relatively little research was carried out focusing on detailed field-based flood-induced geomorphic effects mapping in lowland areas (CitationMagilligan et al., 2015).
In this frame, this paper and the related map illustrate the lower Orba River (LOR) (NW Italy) and its adjacent floodplain geomorphic response to the 21–22 October 2019 extreme flood. This was estimated to be a 500-years flood and originated from very intense rainfall that hit large portions of the Orba River catchment. This research is based on extensive post-flood geomorphological field surveys, GNSS surveys and aerial photographs interpretation. Specific legend entries related to floods and anthropogenic elements are proposed, and this case study represents a significant example of what can be mapped after a high-magnitude flood in lowland mainly-agricultural landscapes of European/Mediterranean catchments presenting regulated rivers. In this paper the FIGEs and the FWDs are overall referred to as flood-related elements (FREs).
2. Study area
The Orba River origins West of Genova (NW Italy), at the closest part of the Ligurian-Po divide to the Ligurian Coast (i.e. only 5 km of distance), and flows Northward from the Ligurian Alps to the Bormida River, south of Alessandria ((a)).
Figure 1. (a) Location of the study reach. See the main map for data information. (b) Representative stretches of the Orba River floodplain reach planform features. The gray dotted lines represent artificial levees. In (b1) the artificial-levee-delimited flood corridor (LFC), that is the floodplain comprised between the bank and the artificial levee, is indicated. The left LFC (1), the active channel (2), and the right LFC (3) are shown along the AA’ segment.
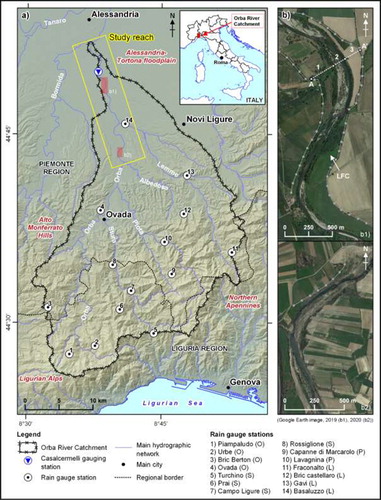
The main fluvial stem is about 73 km long and its catchment spreads over 797 km2. The catchment elevation ranges from 1287 to 88 m a.s.l., at the Mt. Beigua and the outlet, respectively. The all major tributaries are from the right slope of the catchment and are, in order of their occurrence, the Stura, Piota, Albedosa, and Lemme streams. The Orba River has a mean daily discharge of about 15 m3/s, at the Casalcermelli gauging station ((a)) (Regione CitationPiemonte, 2007).
In the southern part of the catchment the main outcropping lithotypes are serpentinites, metagabbros, metabasites, metasediments and mantle peridotites belonging to the Voltri Massif and the Sestri-Voltaggio Zone (CitationAllasinaz et al., 1971; CitationCapponi et al., 2009a; CitationFerraris et al., 2012; Molli et al., Citation2010). The middle part presents conglomerates, sandstones and marls of the Eocene-upper Miocene sedimentary succession of the episutural Tertiary Piermont Basin (CitationCapponi et al., 2009b; CitationFesta et al., 2015). Moreover, a narrow belt of Pliocene silty and clayey marls is situated between reliefs and the Quaternary terraced floodplain (CitationBoni & Casnedi, 1970; CitationPiana et al., 2017). This latter is located in the northern sector of the catchment and is part of the wider Alessandria-Tortona floodplain (CitationCortemiglia, 1998). The Orba River floodplain is mainly composed of coarse sediments (Arpa CitationIrace et al., 2009; CitationPiemonte, 2019a), and presents a wide series of fluvial terraces partly covered by aeolian deposits (CitationBiancotti & Cortemiglia, 1981) and delimited by scarps up to a few tens of meters high.
Concerning land use, most of the upper part of the Orba River catchment is covered by forest, while the hilly and floodplain sectors present mainly agricultural areas.
The climate is generally characterized by hot and dry summers and cold and wet winters, with rainfalls mainly concentrating in autumn (CitationMandarino, 2018). The catchment mean annual rainfall is about 950 mm (CitationADBPo, 2001) and ranges approximately from 600 mm to over 1700mm, at the Bormida River confluence and close to the main Ligurian-Po divide, respectively (CitationMandarino, 2018).
Over the upper part of the catchment, the closeness to the sea and the relief topographic effect result in high annual rainfall values and frequent intense rainfall events associated with an atmospheric circulation prevailing over the Ligurian Sea that conveys moist air masses from the sea to the reliefs around Genova (CitationAcquaotta et al., 2018; CitationSacchini et al., 2012, Citation2016). This makes the Orba River catchment prone to severe floods.
During the twentieth century several Orba River high-magnitude floods were documented (CitationMandarino, 2018 and references therein). The most severe events occurred in 1935, caused by a secondary-dam collapse (CitationBonaria, 2013), and 1977 (CitationGovi, 1978; CitationTropeano, 1989). Consecutive high-magnitude floods even associated with very intense rainfalls recently occurred (), resulting in severe geomorphic effects, large flooding, and relevant damage (ARPA CitationPiemonte, 2002, Citation2011, Citation2014a, Citation2014b, Citation2014c; CitationLuino & Turconi, 2017).
Table 1. Maximum water level and related discharge measured and estimated, respectively, at the Casalcermelli gauging station for the most recent high-magnitude floods (see for location).
This paper focuses on the LOR, that is the Orba River floodplain reach, from Pratalborato to the Bormida River confluence and its adjacent floodplain ((a)). The LOR is 23.8 km long, unconfined, and presents a quite sinuous, single-thread channel deeply entrenched into the floodplain ((b)). The riverbed is on average 80–125 m width, generally shows riffles and pools, and its predominant sediments consist of cobbles, pebbles, fine gravels and sands. Banks are overall high, steep, non-cohesive or composite (CitationRinaldi et al., 2015), and largely stabilized through anthropogenic structures. Nonetheless, a widespread and growing bank instability has been documented over the last 20 years particularly in the lower part of the study reach (CitationMandarino, 2018). The floodplain adjacent to the active channel can be generally classified as recent terrace and only narrow strips of modern floodplain can be noticed (CitationRinaldi et al., 2015). Artificial levees border the riverbed along most of the study reach. Over the last century, and particularly after the 1950s, the LOR experienced severe in-channel alterations mainly consisting of sediment extraction and channelization (CitationMandarino, 2018). Cultivated fields occupy most of the floodplain adjacent to the riverbed and they generally spread up to the bank edge (BE).
3. The 21–22 October 2019 hydro-meteorological event
From 18 to 24 October 2019 intense and prolonged rainfalls affected large parts of the north-western Italy. The Orba River catchment was mainly hit from 18 to 21 October (ARPA CitationLiguria, 2019; ARPA CitationPiemonte, 2019b), when significant rainfall episodes repetitively affected both the uplands and the lowland areas. The Orba floodplain was largely flooded by the minor hydrographic network in the night and early morning of 21 October. However, the most critical phase of the event occurred in the afternoon and evening of the same day, and it was associated with a thunderstorm cell formed on the Ligurian Sea and then extended northward particularly on the southern part of Piemonte, where it remained stationary for some 12 h (ARPA CitationPiemonte, 2019b). This dynamic resulted in exceptional rainfalls in terms of both cumulative values and intensity (, (a)).
Figure 2. (a) 21 October rainfall values measured by the Rossiglione and Gavi rain gauges (time is referred to CEST). They are the rain gauges that registered the maximum daily rainfall during the event (). (b) Hydrometric level recorded by the Casalcermelli gauging station (see for location; time is referred to CEST).
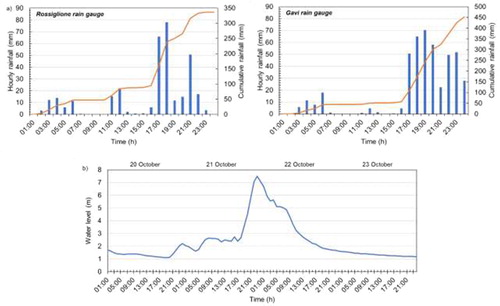
Table 2. Rainfall values measured within the Orba River catchment from 18 to 23 October 2019.
As a response, the Orba River experienced a very high-magnitude flood. At the Casalcermelli gauging station its water level rose up to 7.5 m during the evening of 21 October, underlining a lag time of the order of a few hours ((b)). This value was estimated to correspond to a peak discharge of 2700–2800 m3/s, that is approximately a 500-year flood according to the Flood Risk Management Plan (ARPA CitationPiemonte, 2019b). However, it could be underestimated due to the flood-water overflowing the artificial-levee-delimited flood corridor (LFC) (), upstream of the measurement cross-section. The event magnitude is higher than the most recent floods anyway (). Considering the rain gauge measurements, a substantial discharge contribute derived from the Orba River main tributaries (). The most affected catchment areas were the Lemme, Albedosa, Piota, and Stura valleys.
At the catchment scale, this extreme hydrological event resulted in widespread slope-instability and river-related geomorphic processes, along with lowland areas flooding (CitationMandarino et al., 2020b). All of this caused one casualty and severe damage to agricultural activities, structures, and infrastructures.
4. Materials and methods
An extensive field survey campaign was undertaken along the LOR immediately after the 21–22 October 2019 flood. In this phase the FREs and the local geomorphic features were mapped in a GIS environment by using Qfield (Qfield CitationDevelopment Team, 2019) installed on a tablet along with its GNSS device. The survey focused particularly on the identification of flood-induced erosional and depositional landforms, damage to anthropogenic structures, flooded areas, maximum water levels, and main flood-water direction. By using QGIS (QGIS CitationDevelopment Team, 2019), field data were combined with a 15-cm-resolution orthophotograph taken a few days after the flood (CitationADBDPo, 2019), and a detailed mapping of FREs was performed.
The ante-flood active-channel polygon (CitationCencetti et al., 2017; CitationMandarino et al., 2019a; CitationWinterbottom, 2000), was digitized using the 2019 Google Earth image visualized at 1:1,000–2,500 scale as a base. This data-source was also used to assess the ante-flood geomorphological features of the study area and to map its land-use and land-cover (LULC), in order to distinguish between newly-formed and reactivated landforms and to investigate the LULC classes that were mainly affected by the flood, respectively. Specific LULC categories were defined to describe the local setting. The general geological and geomorphological features of the LOR were mapped considering field surveys, previous researches, technical reports, and official river management plans (e.g. CitationMandarino, 2018 and references therein; CitationAIPO, 2011; CitationPiana et al., 2017).
The all aforementioned elements were manually-digitized with a few decades of centimeters to a few meters spatial accuracy. The study area is constituted of the floodplain area that was flooded as consequence of the Orba River overflowing, plus a 150 m buffer.
As a result, the 1:15,000 scale Main Map showing the FREs, the geomorphological features and the LULC of the LOR was realized. The FREs and the fluvial and anthropogenic elements were classified and mapped according to (i) literature (CitationArnaud-Fassetta et al., 2009; CitationCarey et al., 2015; CitationRamasco & Rossanigo, 1988; CitationShellberg & Brooks, 2012), (ii) the classification scheme developed in the frame of the Reform Project (CitationRinaldi et al., 2015), and (iii) the Italian Institute for Environmental Protection and Research guidelines (CitationCampobasso et al., 2018). However, a number of legend entries were specially developed to represent the FREs and the local geomorphological features. The all mapped elements converged in a large database organized in four main distinct categories: (i) FREs, differentiated into ‘Landforms and deposits’, ‘Effects on anthropogenic elements’, that are overall the FIGEs, and FWDs; (ii) ‘Fluvial landforms and deposits’; (iii) ‘Anthropogenic landforms and deposits’; (iv) LULC. These were furtherly classified considering whether or not they existed before the flood or according to their activity. The identified FREs were quantitatively analyzed through the computation of basic statistics in a GIS environment. The active channel corresponds to the ‘Fluvial deposits of the active channel’ and ‘Water course’ legend entries.
The LOR presents four GNSS monitoring sites where the BE and major features have been periodically mapped over the last years through a GNSS antenna in RTK mode. This allowed the ante- (survey on 13 and 15 September 2019) and post-flood (survey on 31 October and 2 November 2019) BE and alluvial-gully headcut position to be compared to assess the impact of the investigated event. Planform displacements lower than 0.5 m were mapped as no migration.
5. Flood-induced ground effects and flood-water dynamics
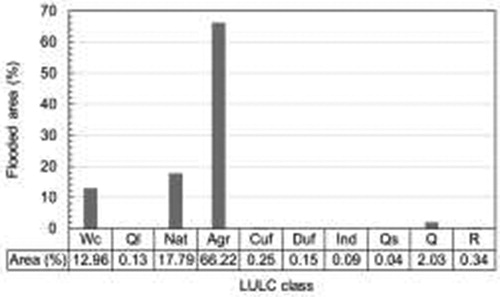
A total area of approximately 17.65 km2 was flooded along the LOR because of the Orba River overflowing. Furtherly, large floodplain areas were simultaneously flooded by tributaries, irrigation channels, ditches, and human-modified small creeks draining the fluvial terraces. This aspect, together with the absence of representative flood markers, made the flooded-area limit pinpointing uncertain at some points. Substantially, the entire floodplain located between the main terrace scarps was flooded from Pratalborato to the Lemme Stream confluence. Downstream, on the left bank, the terrace scarp and the levee contained the flood water up to Portanova and from Portanova to the Barco area, respectively. In contrast, on the right bank, the flood was not completely contained by the almost-continuous levee system and, as a result, large areas were flooded. The LFC was almost completely flooded, and maximum water levels up to approximately 2–3 m above the main ground level were documented. illustrates the percentage area of LULC classes affected by the Orba River flood. The flood spread over 95% of the 200-year flood flow area (the so-called ‘A belt’ according to the river management regulation), 34.4% of the 200-year flooded area (‘B belt’), and 4% of the >200-year flooded area (‘C belt’). Furthermore, 70.9% of the overall flooded area corresponds to the A belt, 20.3% to the B, and 8.8% to the C.
Figure 3. Percentage area of distinct LULC classes affected by the Orba River flood. Wc: water course, Ql: quarry lake, Nat: natural and semi-natural area, Agr: agricultural area, Cuf: continuous urban fabric, Duf: discontinuous urban fabric, Ind: industrial area, Qs: quarried sediment processing site, Q: quarry, R: road infrastructure
The flood triggered erosional and depositional processes that affected both the riverbed and the floodplain. Within the active channel a generalized intense sediment mobilization was noticed, vegetated bars became largely bare, but no channel pattern changes occurred ((a)). The active channel area increased by 6.9%, from 223 ha to 238.5 ha. This newly-formed active channel area belonged to agricultural and natural/semi-natural areas by 1.3% and 98.7%, respectively. A generalized slight channel widening involved the modern floodplain strips, generally included within the river corridor defined by ancient (approximately dated back to the twentieth century, before the 1980s) and recent (after the 1980s) bank protections, in terms of both BE retreat and overbank deposition ((b)). Furthermore, intense bank erosion processes locally affected the recent terrace downstream of the downstream-most abstraction weir, mostly fostering processes that were already ongoing before the flood under discussion (CitationMandarino, 2018) ((c)).
Figure 4. The Orba River active channel after the 21–22 October 2019 flood. (a) Bar affected by intense sediment mobilization and vegetation cover reduction. (b) Bank retreat process involving the modern floodplain. (c) Bank retreat process involving the recent terrace that was already ongoing before the flood. The white line represents a real height of 1.8 m. (d) Collapsed bank protection; most of these structures were already partly or totally collapsed before the flood.
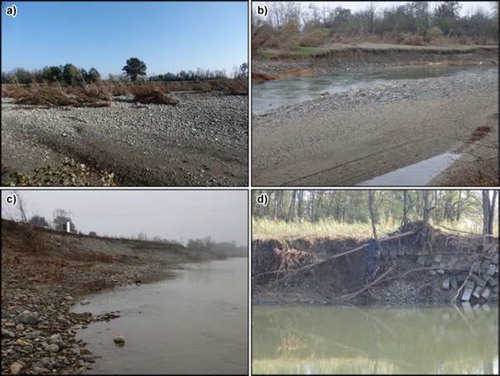
At the present day, 21.7% of banks is affected by retreating process. Moreover, bank protection structures cover 45.5% of banks, of which 12.3% are partly or totally collapsed ((d)). These percentages changes into 62.3% and 10.9%, respectively, considering the total channelization, that is the overall structures within the river corridor. Most of bank instability processes were already ongoing before the flood.
The rarely-possible comparison of GNSS data related to the before- and after-flood BE location (CitationHooke, 2016) revealed that the four monitored sites experienced different dynamics. The first and the third sites show the major retreats with a mean value of 7.5 and 5.4 m, and an eroded area of 2369 and 1341 m2, respectively. In the second the BE was substantially stable, whereas in the fourth it resulted stable and retreating in the upstream and downstream parts, respectively, with a total eroded area of 921 m2.
The flood reactivated two flood channels shaped by previous floods () in close proximity of the active channel. The former, at the downstream-most abstraction weir, is progressively becoming part of the riverbed, whereas the latter, downstream of Retorto, increased the amount of sediment that has progressively deposited inside the ancient quarry it flowed into.
Overbank deposition was notably documented in the interior part of a number of river bends, in particular at Passalacqua, Grava, downstream of Retorto and of Casalcermelli. Moreover, floodplain areas covered by sediment coming from the floodplain itself were registered. This sediment often derived from the damage or collapse of road embankments of both main and dirty roads, as the cases of Capriata, close to the bridge on both banks, Panatiani, Garzaia and the Bormida confluence ((a)). On the whole, 3.8% of flooded areas was covered by coarse sediment from sands to boulders up to approximately 0.5–0.7 m thick. Silty sediment was deposited mainly in depressed areas or upstream of some road embankments.
Figure 5. Effects of erosion and deposition processes over the floodplain. (a) Dusty road removed by the flood (white dotted line) and sediment lobes formed downstream. (b) Evidences (worked-soil removal and elongated scour hole formation) of intense superficial erosion that affected agricultural areas within the LFC. (c) Damage to the 179 Provincial Road embankment. (d) Damage to the road between Capriata and Bruno/Ospedale and elongated scour hole downstream of the road itself. These linear infrastructures (c, d) were overtopped and eroded. Downstream intense erosion and deposition processes occurred. It is noteworthy the draining-pipes-induced erosion downstream of the embankment (d). The white arrows (c, d) indicate the same point on the post-flood orthophotograph (PFO) (CitationADBDPO, 2019) and the field photograph (Pc, Pd); the yellow dot represents the location of photographs (Pc) and (Pd). The blue arrows indicate the main flood-water direction.
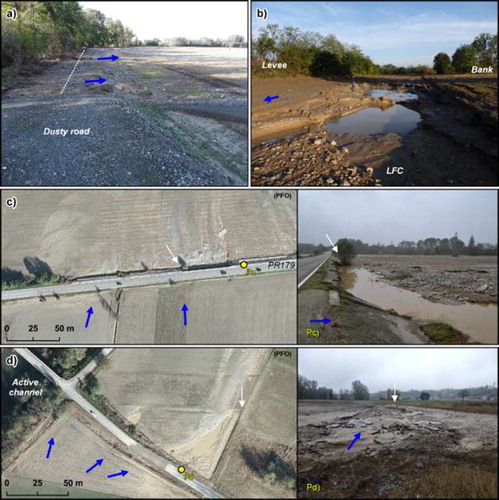
In contrast, 3.3% of inundated floodplain was affected by intense surficial erosion that caused the partial or total soil loss, up to the formation of localized 1–2 m depth elongated scour holes ((b)). This process, as documented after previous floods (ARPA CitationPiemonte, 2011, Citation2014a, Citation2014b, Citation2014c; CitationMandarino, 2018), was particularly intense downstream of Bruno, upstream of the Bormida confluence, and downstream of the two main road crossing the flooded areas perpendicularly to the flood-water flow, that is between Capriata and Ospedale, and along the PR179. In these last cases, the road embankment overtopping together with the flood-water passage into drainage pipes resulted in severe surficial erosion downstream of the infrastructure and in its damage and partial collapse ((c,d)).
Sediment deposition occurred in both agricultural and natural/semi-natural areas. On the contrary, surficial erosion was noticed only in agricultural areas, especially in recently-sown fields. These last were affected by rill erosion in two sites, where a certain slope characterizes the ground level.
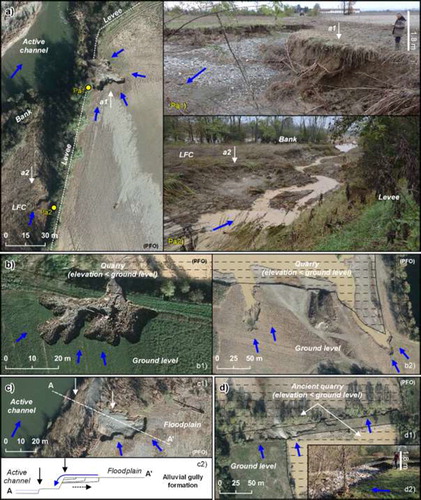
A number of alluvial gullies (AGs) (CitationBrooks et al., 2009) reactivated or originated along steep scarps and eroded into the adjacent floodplain, where a concentrated runoff from floodplain entered the active channel ((a)) or depressed areas due to quarrying activity ((b)), following the CitationCarey et al. (Citation2015) development scheme ((c)). The AGs mapped as punctual elements generally presented roundish depletion zone delimited by a jagged, semi-circular or bracket-like headcut ((a–c)). Linear and continuous scarp front AGs (CitationShellberg & Brooks, 2012) were also mapped ((a,d)). Some AGs developed or reactivated at the GNSS bank monitoring sites. In the site 1 a new AG formed and in the site 3 the existing one substantially remained stable. In the site 2 increases of 49.3% (from 630 to 941 m2) and 19.3% (from 305 to 364 m2) of the AG area were measured for the AGs included and not-included within the LFC, respectively.
Figure 6. AGs formed or reactivated over the flooded area. (a) Example of AGs reactivated during the 21–22 October 2019 flood downstream of Garzaia, located outside (Pa1) and within (Pa2) the LFC. The white arrows a1 and a2 indicate the same point on the PFO (CitationADBDPO, 2019) and the field photograph (Pa1) and (Pa2), taken at the yellow dot. (b) AGs developed along steep anthropogenic scarps shaped by quarrying activity at Orbetta-Pitocca (b1) and Bruno (b2). (c) AG formation scheme. Newly-formed AG upstream of Garzaia (c1). The schematic not-to-scale cross section AA’ (c2), dashed line in (c1), highlights the AG (c1) formation scheme: the concentrated flood-water from floodplain entering the active channel (blue arrow) triggered a scarp regressive erosion process (dashed arrow) that resulted in the AG formation and enlargement by the AG headcut progressive retreat (series of dotted lines). Vertical arrows in (c1) and (c2) indicate the same scarps, respectively. (d) Continuous scarp front AG developed along a quarry scarp downstream of Pennaceto. In (d1) the eroded scarp is between two ancient quarries; the eroded scarp in (d2) is upstream of the (d1) site. The black dashed pattern indicates the anthropogenic depression (b, d); the blue arrows indicate the main flood-water direction.
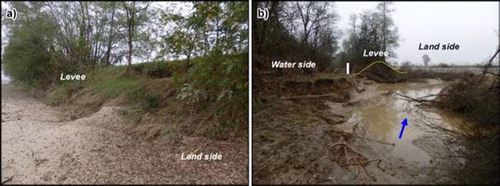
At some places the flood overflowed the LFC because of levee overtopping, newly-formed or reactivated breaches, burrows, and unmanaged pipes. These dynamics resulted in serious damage to the levee system ((a,b)). Most of breaches present a scour hole a few meters deep ((b)). Furthermore, levee breaches shaped large crevasse splays principally involving agricultural areas. Something like the levee failure consequences was registered upstream of Garzaia where the flood-water reactivated a scour hole resulting from the dusty-road embankment overtopping by the most recent extreme floods, triggering severe erosion and deposition processes downstream.
Figure 7. Damage to the levee system at Garzaia. (a) Structural damage to the levee embankment. (b) Levee breach and scour hole; the dotted line represents the levee cross section and the blue arrow indicate the main flood-water direction. The vertical white line represents a real height of 2.2 m.
Considerable volumes of floated large woody debris were trapped by riparian vegetation, single obstacles such as trellises, and woody areas located within the LFC.
Noteworthy is the critical issue of waste fill areas close to the active channel. The flood involved these areas and severely fostered the already-ongoing bank retreat at the Bormida confluence where a thick layer of buried wastes that composes the bank itself has been progressively eroding.
According to available information (ARPA CitationMandarino, 2018; CitationPiemonte, 2019b), the Orba River high-magnitude floods occurred over the last decade were characterized by similar dynamics and resulted in similar, but less intense, geomorphic effects and damage, with respect to the 21–22 October 2019 flood.
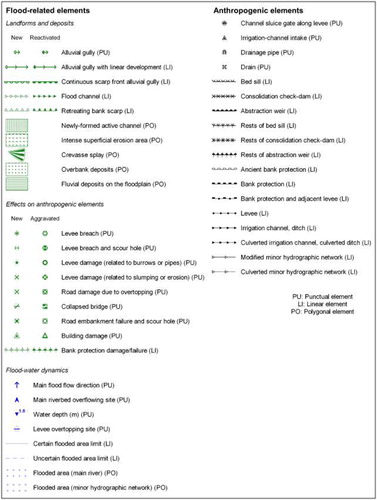
In order to map both the geomorphic effects related to the flood and the geomorphic features of the study area, a specific legend derived from the combination of consolidated and original legend entries was developed. The original legend entries include anthropogenic elements and FREs, and are not site-specific (). The former are substantially river-related man-made structures and lowland anthropogenic elements. Symbols were realized within a systematic framework, that is with common geometries and styles referring to distinct groups of elements, to make easier their comprehension. This aspect allowed for the definition of some entries and related symbols beyond the needs of this research, that anyway could be used or furtherly developed in future researches.
Figure 8. The newly-developed legend entries and related symbols aiming to map in detail the FREs after a high-magnitude flood and a number of anthropogenic elements, in a typical lowland agricultural landscape with regulated rivers.
6. Final remarks
The synergic use of extensive field surveys, GNSS surveys and aerial photographs interpretation allowed for a detailed and quantitative characterization and mapping of FIGEs and FWDs referred to the 21–22 October 2019 extreme flood that affected the LOR.
As a result, a 1:15,000 scale flood-related geomorphological map was realized in a GIS environment.
In general, an intense in-channel sediment mobilization, a widespread reactivation of bank protection scouring, and a locally-relevant channel widening were documented. However, in contrast with other cases (CitationCencetti et al., 2017; CitationClerici et al., 2015; CitationMandarino et al., 2020c; CitationNardi & Rinaldi, 2015; CitationPellegrini et al., 2008), the active channel did not experience severe planform changes despite the very high magnitude of the event. This aspect is most probably related to the progressive incision and channelization occurred along the LOR over the twentieth century (CitationMandarino, 2018), that restricted the natural dynamics of the river.
Large lowland areas were flooded, also outside the LFC, and erosional and depositional processes widely shaped newly-formed and existing landforms and deposits. These dynamics resulted in severe damages to cultivated fields, transport infrastructures, and buildings. The FIGEs and the flood markers indicated that the flood water overall flowed rather quickly over the lowland areas reaching notable water level, in particular within the LFC. Furthermore, the FIGEs spatial distribution and the main flood-flow directions over the floodplain highlighted the anthropogenic linear structures (roads and levees) interference on flood propagation and thus on triggering erosional and depositional processes, as already documented both here, after previous floods, and elsewhere (Bellardone et al., Citation1998; CitationHoracio et al., 2019; CitationMandarino et al., 2020a). The flooding of areas outside the LFC caused not only by unrepaired breaches, water-loss due to unmanaged pipes or burrows, and levee failures, whose causes could not be identified, but also by levee overtopping, should arise serious issues concerning the LFC suitability. Furthermore, this event represents a further case demonstrating the abandoned channels to be flood-water flow favorite locations over the floodplain, with all the consequences this implies in terms of hydro-geomorphic hazards, and the essential need not to urbanize the flood-prone areas, considering that some construction projects along the LOR were recently-proposed (CitationBoggian, 2019; CitationCarbone, 2011).
This work highlighted the importance of using combined approaches for geomorphological mapping and the need of extensive post-flood field surveys to depict in detail the flood scenario and to validate remote-sensing data.
The legend entries specially developed in this research contribute to increase the wide spectrum of available geomorphological mapping resources. The anthropogenic elements could enhance the most commonly used legends (CitationCampobasso et al., 2018), while the FREs could represent a new reference for detailed flood mapping.
The realized map represents a fundamental tool for hydro-geomorphic hazards assessment and zonation. Moreover, the outcomes constitute a fundamental basis (i) for sustainable and effective land use planning and river management measures definition, aiming to mitigate the river-related risks and restore the fluvial environment in the frame of the European Water Framework Directive and the European Flood Directive (European CitationCommission, 2000, Citation2007), and (ii) for further research activities on geomorphic effectiveness of high-magnitude floods implementation.
Software
The all data processing and the entire map sheet design was performed by using the free and open source software QGIS.
jom_map_orba_flood_201209.pdf
Download PDF (22.2 MB)Acknowledgements
The present study is an unexpected expansion of a wider research, within which the long-term GNSS monitoring sites are included, on the Orba River floodplain reach geomorphological evolution over the last two centuries, recently conducted by Andrea Mandarino (A.M.). The map was realized by A.M.; photographs by A.M. and Piero Mandarino (P.M., Aree Protette del Po Vercellese-Alessandrino). The authors thank all people who provided historical data and flood-related information, in particular Daniele Cermelli, Mauro Nizzo, and Claudio Monferino. Furthermore, they thank Gianfranca Bellardone (Regione Piemonte), Luca Lanteri (ARPA Piemonte), and Claudia Giampani (ARPA Piemonte) for sharing information and materials, and the Po River Basin District Authority for providing the post-flood orthophotograph. They are sincerely grateful to Luigi Moisio (Provincia di Alessandria), Gian Franco Giacobbe (Provincia di Alessandria), and, overall, P.M., for their support during field surveys. Finally, the authors wish to thank the reviewers Heike Apps, Diego Di Martire, and Dorina Camelia Ilies, and the Editors Chiara Cappadonia and Alessandro Chelli, for their observations and positive comments.
Disclosure statement
No potential conflict of interest was reported by the author(s).
References
- AIPO, 2011. Caratterizzazione dell’assetto geomorfologico dei corsi d’acqua e delle loro tendenze evolutive, Studio di fattibilità per la definizione dell’assetto di progetto – interventi di gestione sedimenti, recupero morfologico e sistemazione idraulica – del fiume Bormida e del torrente Orba (E-SPEC-858). Agenzia Interregionale per il Fiume Po [in Italian].
- Acquaotta, F., Faccini, F., Fratianni, S., Paliaga, G., & Sacchini, A. (2018). Rainfall intensity in the Genoa Metropolitan area (Northern Mediterranean): Secular variations and consequences. Weather, 73(11), 356–362. https://doi.org/10.1002/wea.3208
- ADBDPo. (2019). Alluvione fiume Orba, 24 ottobre 2019. Post-flood orthophotograph, Autorità di Bacino Distrettuale del Fiume Po.
- ADBPo. (2001). Linee generali di assetto idrogeologico e quadro degli interventi - Bacino del Tanaro. Piano Stralcio per l’Assetto Idrogeologico (PAI). Autorità di Bacino del Fiume Po, Parma [in Italian].
- Allasinaz, A., Gelati, R., Gnaccolini, M., Martinis, B., Orombelli, G., Pasquarè, G., & Rossi, P. M. (1971). Note illustrative della Carta Geologica d’Italia alla scala 1:100.000 - foglio 82 Genova. Servizio Geologico d’Italia, Roma [in Italian].
- Arnaud-Fassetta, G., Astrade, L., Bardou, E., Corbonnois, J., Delahaye, D., Fort, M., … Penven, M. J. (2009). Fluvial geomorphology and flood-risk management. Géomorphologie: Relief, Processus, Environnement, 15(2), 109–128. https://doi.org/10.4000/geomorphologie.7554
- ARPA Liguria. (2019). Rapporto speditivo dell’evento meteo-idrologico del 19-22/10/2019. Agenzia Regionale per la Protezione dell’Ambiente Ligure, Centro Funzionale Meteo-Idrologico di Protezione Civile della Regione Liguria [in Italian].
- ARPA Piemonte. (2002). Evento alluvionale del 14-18 e del 23-26 novembre 2002 - Effetti al suolo. Agenzia Regionale per la Protezione Ambientale - Regione Piemonte [in Italian].
- ARPA Piemonte. (2011). Evento meteoidrologico del 4-8 novembre 2011 – Attività del centro funzionale: analisi meteorologica, pluviometrica ed idrometrica. Agenzia Regionale per la Protezione Ambientale - Regione Piemonte. Torino [in Italian].
- ARPA Piemonte (2014a). Evento meteoidrologico del 24-26 dicembre 2013 – Analisi meteorologica, pluviometrica, idrometrica ed attività del centro funzionale regionale. Agenzia Regionale per la Protezione Ambientale – Regione Piemonte. Torino [in Italian].
- ARPA Piemonte (2014b). Analisi evento 9-13 ottobre 2014. Rapporto evento. Agenzia Regionale per la Protezione Ambientale – Regione Piemonte. Torino [in Italian].
- ARPA Piemonte. (2014c). Eventi idrometeorologici dal 9 al 17 novembre 2014. Rapporto evento. Agenzia Regionale per la Protezione Ambientale - Regione Piemonte. Torino [in Italian].
- ARPA Piemonte. (2019a). Idrogeologia del Piemonte. Agenzia Regionale per la Protezione dell’Ambiente – Regione Piemonte, Torino [in Italian]. https://www.arpa.piemonte.it/approfondimenti/temi-ambientali/acqua/acque-sotterranee/IdrogeologiadelPiemonte.pdf
- ARPA Piemonte. (2019b). Eventi idrometeorologici dal 19 al 24 ottobre 2019. Rapporto evento. Agenzia Regionale per la Protezione Ambientale - Regione Piemonte. Torino [in Italian].
- Bartelletti, C., Giannecchini, R., D’Amato Avanzi, G., Galanti, Y., Mazzali, A., 2017. The influence of geological–morphological and land use settings on shallow landslides in the Pogliaschina T. basin (northern Apennines, Italy). Journal of Maps, 13(2), 142–152. https://doi.org/10.1080/17445647.2017.1279082
- Bathrellos, G.D., Skilodimou, H.D., Soukis, K., Koskeridou, E., 2018. Temporal and spatial analysis of flood Occurrences in the drainage Basin of Pinios River (Thessaly, Central Greece). Land, 7(3), 106. https://doi.org/10.3390/land7030106
- Bellardone, G., Colombo, I., Forlati, F., Giampani, C., Oberti, R., Piccini, C., Ramasco, M., & Susella, G. (1998). Cronistoria del processo di piena. In G. Susella (Ed.), Eventi alluvionali in Piemonte 2-6 novembre 1994, 8 luglio 1996, 7-10 ottobre 1996 (pp. 135–171). Regione Piemonte.
- Benito, G., & Hudson, P. (2010). Flood hazards: The context of fluvial geomorphology. In I. Alcántara-Ayala & A. Goudie (Eds.), Geomorphological hazards and disaster prevention (pp. 111–128). Cambridge, Cambridge University Press. https://doi.org/10.1017/CBO9780511807527.010
- Biancotti, A., & Cortemiglia, G. C. (1981). Ritrovamento di loess sul fluviale medio della Scrivia presso Novi Ligure (Piemonte-Italia). Quaderni dell’Istituto di Geologia della Università di Genova, year 2 [in Italian].
- Boggian, G. (2019). Frugarolo “L’area è soggetta ad alluvioni, il progetto (ritirato) non ne teneva conto”. Il Piccolo, Alessandria, 03/12/2019 [in Italian].
- Bonaria, V. (2013). Storia della Diga di Molare: il Vajont dimenticato. Erga [in Italian].
- Boni, A., & Casnedi, R. (1970). Note illustrative della Carta Geologica d’Italia alla scala 1:100.000 - fogli 69 e 70 Asti – Alessandria. Servizio Geologico d’Italia [in Italian].
- Borrelli, L., Cofone, G., Coscarelli, R., & Gullà, G. (2015). Shallow landslides triggered by consecutive rainfall events at Catanzaro strait (Calabria–Southern Italy). Journal of Maps, 11(5), 730–744. https://doi.org/10.1080/17445647.2014.943814
- Brandolini, P., Mandarino, A., Paliaga, G., Faccini, F. (2020). Anthropogenic landforms in an urbanized alluvial-coastal plain (Rapallo city, Italy). Journal of Maps, 1–12. doi: 10.1080/17445647.2020.1793818
- Brooks, A. P., Shellberg, J. G., Knight, J., & Spencer, J. (2009). Alluvial gully erosion: An example from the Mitchell fluvial megafan, Queensland, Australia. Earth Surface Processes and Landforms, 34(14), 1951–1969. https://doi.org/10.1002/esp.1883
- Campobasso, C., Carton, A., Chelli, A., D’Orefice, M., Dramis, F., Graciotti, R., Guida, D., Pambianchi, G., Peduto, F., & Pellegrini, L. (2018). Aggiornamento ed integrazioni delle linee guida della Carta geomorfologica d’Italia alla scala 1:50.000. Servizio Geologico d’Italia - ISPRA [in Italian].
- Capponi, G., Crispini, L., Federico, L., Piazza, M., Fabbri, B. (2009b). Late Alpine tectonics in the Ligurian Alps: Constraints from the Tertiary Piedmont Basin conglomerates. Geology Journal. 44(2), 211–224. https://doi.org/10.1002/gj.1140
- Capponi, G., Crispini, L., Scambelluri, M. (2009a). Comment on “Subduction polarity reversal at the junction between the Western Alps and the Northern Apennines, Italy”, by G. Vignaroli, C. Faccenna, L. Jolivet, C. Piromallo, F. Rossetti. Tectonophysics, 465(1–4), 221–226. https://doi.org/10.1016/j.tecto.2008.10.019
- Carbone, G. (2011). L’impianto a biogas viene bocciato dalla Provincia. La Stampa, Alessandria, 28/04/2011 [in Italian].
- Carey, B., Stone, B., Norman, P., & Shilton, P. (2015). Land management on flood plains – Chapter 10. In: Soil Conservation Guidelines for Queensland. Department of Science, Information Technology and Innovation, Brisbane.
- Casale, R., Pedroli, G. B., & Samuels, P. (1998). Ribamod – River basin modelling, management and flood mitigation – Concerted action. Proceedings of the first workshop Current policy and practice on flood mitigation. European Commission, Directorate-General for Science, Research and Development. Office for Official Publications of the European Communities.
- Cencetti, C., De Rosa, P., & Fredduzzi, A. (2017). Geoinformatics in morphological study of River Paglia, Tiber River Basin. Environmental Earth Sciences, 76(3), 128. https://doi.org/10.1007/s12665-017-6448-5
- Cevasco, A., Pepe, G., & Brandolini, P. (2012). Shallow landslides induced by heavy rainfall on terraced slopes: The case study of the October 25th, 2011 event in the Vernazza catchment (Cinque Terre, NW Italy). Rendiconti Online Della Società Geologica Italiana, 21, 384–386. ISSN 2035-8008.
- Cevasco, A.; Pepe, G.; D’Amato Avanzi, G.; & Giannecchini, R. (2015). A study on the 10 November 2014 intense rainfall and the related landslides in the lower Lavagna valley (eastern Liguria). Rendiconti Online Della Società Geologica Italiana, 35, 66–69. https://doi.org/10.3301/ROL.2015.65
- Cevasco, A., Pepe, G., D’Amato Avanzi, G., & Giannecchini, R. (2017). Preliminary analysis of the November 10, 2014 rainstorm and related landslides in the lower Lavagna Valley (Eastern Liguria). Italian Journal of Engineering Geology and Environment, 1, 5–15. https://doi.org/10.4408/IJEGE.2017-01.S-01
- Clerici, A., Perego, S., Chelli, A., & Tellini, C. (2015). Morphological changes of the floodplain reach of the Taro River (Northern Italy) in the last two centuries. Journal of Hydrology, 527, 1106–1122. https://doi.org/10.1016/j.jhydrol.2015.05.063
- CNR-Polaris. (2019). Rapporto Periodico sul Rischio posto alla Popolazione Italiana da Frane e da Inondazioni - Anno 2019. Consiglio Nazionale delle Ricerche, Istituto di Ricerca per la Protezione Idrogeologica. http://polaris.irpi.cnr.it/report/
- Cortemiglia, G. C. (1998). Genesi ed evoluzione geologica del territorio Tortonese-Alessandrino. Biblioteca della Società di storia arte e archeologia per le Province di Alessandria e Asti, 30, 31–48. in Italian].
- De Musso, N.M., Capolongo, D., Refice, A., Lovergine, F.P., D’Addabbo, A., Pennetta, L., 2018. Spatial evolution of the December 2013 Metaponto plain (Basilicata, Italy) flood event using multi-source and high-resolution remotely sensed data. Journal of Maps, 14(2), 219–229. https://doi.org/10.1080/17445647.2018.1454349
- European Commission. (2000). Directive 2000/60/EC of the European Parliament and of the Council of 23 October 2000 Establishing a Framework for Community Action in the Field of Water Policy, Official Journal L 327, 22/12/2000, Brussels, Belgium.
- European Commission. (2007). Directive 2007/60/EC of the European Parliament and of the Council of 23 October 2007 on the assessment and management of flood risks, Official Journal L 288, 6/11/2007, Brussels, Belgium.
- European Environment Agency (EEA). (2010). Mapping the Impacts of Natural Hazards and Technological Accidents in Europe: An Overview of the Last Decade. EEA Technical report No 13/2010. Office for Official Publications of the European Communities: Luxembourg; European Environment Agency (EEA): Copenhagen, Denmark.
- European Environment Agency (EEA). (2016). Flood risks and environmental vulnerability, Exploring the synergies between floodplain restoration, water policies and thematic policies. EEA Report No 1/2016. Office for Official Publications of the European Communities: Luxembourg; European Environment Agency (EEA): Copenhagen, Denmark.
- Faccini, F., Luino, F., Sacchini, A., & Turconi, L. (2015). Flash flood events and urban development in Genoa (Italy): Lost in translation. In G. Lollino, A. Manconi, F. Guzzetti, M. Culshaw, P. Bobrowsky, & F. Luino (Eds.), Engineering Geology for Society and Territory – Vol. 5 (pp. 797–801). Springer International Publishing.
- Faccini, F., Paliaga, G., Piana, P., Sacchini, A., & Watkins, C. (2016). The Bisagno stream catchment (Genoa, Italy) and its major floods: Geomorphic and land use variations in the last three centuries. Geomorphology, 273, 14–27. https://doi.org/10.1016/j.geomorph.2016.07.037
- Ferraris, F., Firpo, M., Pazzaglia, F.J. (2012). DEM analyses and morphotectonic interpretation: The Plio-Quaternary evolution of the eastern Ligurian Alps, Italy. Geomorphology, 149–150, 27–40. https://doi.org/10.1016/j.geomorph.2012.01.009
- Festa, A., Fioraso, G., Bissacca, E., Petrizzo, M.R. (2015). Geology of the Villalvernia – Varzi line between Scrivia and Curone valleys (NW Italy). Journal of Maps, 11(1), 39–55. https://doi.org/10.1080/17445647.2014.959569
- Fuller, I. C. (2008). Geomorphic impacts of a 100-year flood: Kiwitea Stream, Manawatu catchment, New Zealand. Geomorphology, The geomorphological and Palaeohydrological response of fluvial systems to climatic. Human and Tectonic Controls, 98, 84–95. https://doi.org/10.1016/j.geomorph.2007.02.026
- Gaume, E., Bain, V., Bernardara, P., Newinger, O., Barbuc, M., Bateman, A., … Daliakopoulos, I. (2009). A compilation of data on European flash floods. Journal of Hydrology, 367(1-2), 70–78. https://doi.org/10.1016/j.jhydrol.2008.12.028
- Govi, M. (1978). Gli eventi alluvionali del 1977 in Piemonte: problemi di protezione idrogeologica, in: Atti Del Convegno “Pianificazione Territoriale e Geologia”. 14/04/1978. Torino, pp. 37–45. [in Italian].
- Gregory, K. J. (2006). The human role in changing river channels. Geomorphology, 79(3-4), 172–191. https://doi.org/10.1016/j.geomorph.2006.06.018
- Guerriero, L., Focareta, M., Fusco, G., Rabuano, R., Guadagno, F.M., & Revellino, P. (2018). Flood hazard of major river segments, Benevento Province, Southern Italy. Journal of Maps, 14(2), 597–606. https://doi.org/10.1080/17445647.2018.1526718
- Guerriero, L., Ruzza, R., Guadagno, F.M., & Revellino, P. (2020). Flood hazard mapping incorporating multiple probability models. Journal of Hydrology, 587, 125020. https://doi.org/10.1016/j.jhydrol.2020.125020
- Heritage, G.L., Large, A.R.G., Moon, B.P., & Jewitt, G. (2004). Channel hydraulics and geomorphic effects of an extreme flood event on the Sabie River, South Africa. CATENA, 58(2), 151–181. https://doi.org/10.1016/j.catena.2004.03.004
- Hooke, J. M. (2016). Geomorphological impacts of an extreme flood in SE Spain. Geomorphology, 263, 19–38. https://doi.org/10.1016/j.geomorph.2016.03.021
- Hooke, J.M. (2015). Variations in flood magnitude–effect relations and the implications for flood risk assessment and river management. Geomorphology. Emerging Geomorphic Approaches to Guide River Management Practices, 251, 91–107. https://doi.org/10.1016/j.geomorph.2015.05.014
- Horacio, J., Ollero, A., Noguera, I., & Fernández-Pasquier, V. (2019). Flooding, channel dynamics and transverse infrastructure: A challenge for Middle Ebro river management. Journal of Maps, 15(2), 310–319. https://doi.org/10.1080/17445647.2019.1592719
- Irace, A., Clemente, P., Natalicchio, M., Ossella, L., Trenkwalder, S., De Luca, D., … & Violanti, D. (2009). Geologia e idrostratigrafia profonda della Pianura Padana occidentale (Regione Piemonte). Regione Piemonte, CNR Istituto di Geoscienze e Georisorse, Università degli Studi di Torino. [in Italian].
- Kundzewicz, Z.W., Pińskwar, I., Brakenridge, G.R. (2013). Large floods in Europe, 1985–2009. Hydrological Sciences Journal, 58(1), 1–7. https://doi.org/10.1080/02626667.2012.745082
- Kundzewicz, Z.W., Pińskwar, I., Brakenridge, G.R. (2018). Changes in river flood hazard in Europe: A review. Hydrology Research, 49(2), 294–302. https://doi.org/10.2166/nh.2017.016
- Llasat, M. C., Llasat-Botija, M., Prat, M. A., Porcú, F., Price, C., Mugnai, A., Lagouvardos, K., Kotroni, V., Katsanos, D., Michaelides, S., Yair, Y., Savvidou, K., & Nicolaides, K. (2010). High-impact floods and flash floods in Mediterranean countries: the FLASH preliminary database, in: Advances in Geosciences. Presented at the 10th EGU Plinius Conference on Mediterranean Storms (2008) – 10th Plinius Conference on Mediterranean Storms, Nicosia, Cyprus, 22–24 September 2008, Copernicus GmbH, pp. 47–55. https://doi.org/10.5194/adgeo-23-47-2010
- Luino, F. (1999). The flood and landslide event of November 4-6, 1994 in Piedmont Region (North-West Italy): causes and related effects in Tanaro Valley”. XXII General Assembly of the European Geophysical Society, Vienna (Austria). 21–25 April 1997. Ed. Elsevier Science Ltd, Vol. 24, N. 2, 123-129.
- Luino, F., Belloni, A., Padovan, N. in collaboration with Bassi M., Bossuto P. & Fassi P. (2002). Historical and geomorphological analysis as a research tool for the identification of flood-prone zones and its role in the revision of town planning: the Oglio basin (Valcamonica - Northern Italy). 9th Congress of the IAEG, Durban (South Africa), 16-20 September 2002, p. 191-200.
- Luino, F., Turconi, L. (Eds.), (2017). Eventi di piena e frana in Italia settentrionale nel periodo 2005-2016. Torino: Società Meteorologica Subalpina. [in Italian].
- Luino, F., Turconi, L., Petrea, C., Nigrelli G. (2012). Uncorrected land-use planning highlighted by flooding: The Alba case study (Piedmont, Italy). Natural Hazards Earth System Science, 12(7), 2329–2346, https://doi.org/10.5194/nhess-12-2329-2012
- Magilligan, F.J., Buraas, E.M., Renshaw, C.E. (2015). The efficacy of stream power and flow duration on geomorphic responses to catastrophic flooding. Geomorphology, 228, 175–188. https://doi.org/10.1016/j.geomorph.2014.08.016
- Mandarino, A. (2018). Channel morphological evolution of the Orba and Scrivia River floodplain reaches (NW Italy) since 1878 based on FOSS GIS analysis, topographical surveys and field observations. PhD thesis, Scuola di Dottorato in Scienze e Tecnologie per l’Ambiente e il Territorio, University of Genova, Genova.
- Mandarino, A., Luino, F., & Faccini, F. (2020b). Ground effects triggered by the 19-21 October 2019 extreme rainfall in the middle-lower Lemme River catchment (NW Italy). EGU2020-9833, EGU General Assembly 2020. https://doi.org/10.5194/egusphere-egu2020-9833
- Mandarino, A., Luino, F., Turconi, L., & Faccini, F. (2020a). Urban geomorphology of a historical city straddling the Tanaro River (Alessandria, NW Italy). Journal of Maps, 1–13. https://doi.org/10.1080/17445647.2020.1746420
- Mandarino, A., Maerker, M., & Firpo, M. (2019a). Channel planform changes along the Scrivia River floodplain reach in northwest Italy from 1878 to 2016. Quaternary Research, 91(2), 620–637. https://doi.org/10.1017/qua.2018.67
- Mandarino, A., Maerker, M., & Firpo, M. (2019b). ‘The stolen space': A history of channelization, reduction of riverine areas and related management issues. The lower Scrivia river case study (NW Italy). International Journal of Sustainable Development and Planning, 14 (22), 118–129. https://doi.org/10.2495/SDP-V14-N2-118-129
- Mandarino, A., Pepe, G., Maerker, M., Cevasco, A., & Brandolini, P. (2020c). Short-term GIS analysis for the assessment of the recent active-channel planform adjustments in a widening, highly altered river: The Scrivia River, Italy. Water, 12(2), 514. https://doi.org/10.3390/w12020514
- Merz, B., Kreibich, H., Schwarze, R., & Thieken, A. (2010). Assessment of economic flood damage. Natural Hazards of Earth System Science, 10(8), 1679–1724. https://doi.org/10.5194/nhess-10-1679-2010
- Molli, G., Crispini, L., Malusà, M., Mosca, P., Piana, F., & Federico, L. (2010). Geology of the Northern Apennine-Western Alps junction area: A regional review, in: Beltrando, M., Peccerillo, A., Mattei, M., Conticelli, S., Doglioni, C. (Eds.), The Geology of Italy: Tectonics and Life along Plate Margins. Journal of the Virtual Explorer, 36. https://doi.org/10.3809/jvirtex.2010.00215
- Morche, D., Schmidt, K.-H., Heckmann, T., & Haas, F. (2007). Hydrology and geomorphic effects of a high-magnitude flood in an Alpine River. Geografiska Annaler: Series A. Physical Geography, 89, 5–19. https://doi.org/10.1111/j.1468-0459.2007.00304.x
- Nardi, L., & Rinaldi, M. (2015). Spatio-temporal patterns of channel changes in response to a major flood event: The case of the Magra River (central–northern Italy). Earth Surface Processes and Landforms, 40(3), 326–339. https://doi.org/10.1002/esp.3636
- Paliaga, G., Luino, F., Turconi, L., Marincioni, F., & Faccini, F. (2020). Exposure to Geo-hydrological hazards of the Metropolitan area of Genoa, Italy: A Multi-Temporal analysis of the Bisagno Stream. Sustainability, 12(3), 1114. https://doi.org/10.3390/su12031114
- Pavese, M. P., Banzon, V., Colacino, M., Gregori, G. P., & Pasqua, M. (1992). Three historical data series on floods and anomalous climatic events in Italy. In R. S. Bradley & P. D. Jones (Eds.), Climate since AD 1500 (pp. 155–170). Routledge.
- Pellegrini, L., Maraga, F., Turitto, O., Audisio, C., Duci, G., Pavia, U., & Ferrata, V. (2008). Evoluzione morfologica di alvei fluviali mobili nel settore occidentale del bacino padano. Il Quaternario, 21(1B), 251–266. in Italian].
- Pepe, G., Mandarino, A., Raso, E., Cevasco, A., Firpo, M., & Casagli, N. (2019a). Extreme flood and landslides triggered in the Arroscia Valley (Liguria Region, Northwestern Italy) during the November 2016 rainfall event. In Shakoor, A. & Kato, K. (Eds.) Slope stability: case histories, landslide mapping, emerging technologies, Proceedings of the IAEG/AEG Annual Meeting Proceedings, San Francisco, CA, USA, 17–21 September 2018, (Vol. 1, pp. 171–175). Cham: Springer International Publishing.
- Pepe, G., Mandarino, A., Raso, E., Scarpellini, P., Brandolini, P., & Cevasco, A. (2019b). Investigation on farmland abandonment of terraced slopes using multitemporal data sources comparison and its implication on hydro-geomorphological processes. Water, 11(8), 1552. https://doi.org/10.3390/w11081552
- Piana, F., Fioraso, G., Irace, A., Mosca, P., d’Atri, A., Barale, L., Falletti, P., Monegato, G., Morelli, M., Tallone, S., & Vigna, G. B. (2017). Geology of Piemonte region (NW Italy, Alps–Apennines interference zone). Journal of Maps, 13(2), 395–405. https://doi.org/10.1080/17445647.2017.1316218
- QField Development Team. (2019). Qfield software. Opengis.ch. https://qfield.org/docs/index.html
- QGIS Development Team. (2019). QGIS Geographic Information System. Open Source Geospatial Foundation Project. https://www.osgeo.org/projects/qgis/
- Rago, V., Chiaravalloti, F., Chiodo, G., Gabriele, S., Lupiano, V., Nicastro, R., Pellegrino, A.D., Procopio, A., Siviglia, S., Terranova, O.G., Iovine, G.G.R. (2017). Geomorphic effects caused by heavy rainfall in southern Calabria (Italy) on 30 October–1 November 2015. Journal of Maps, 13(2), 836–843. https://doi.org/10.1080/17445647.2017.1390499
- Ramasco, M., & Rossanigo, P. (1988). Evoluzione morfologica dell’alveo del T. Cervo nel tratto di pianura e studio fotointerpretativo dell’inondazione verificatasi il 2-3 novembre 1968. Provincia di Vercelli, Settore Assetto Ambientale, and Regione Piemonte, Servizio Geologico [in Italian].
- Regione Piemonte. (2007). Piano di Tutela delle Acque. Monografie. AL28 - Orba. [in Italian].
- Rinaldi, M., Amponsah, W., Benvenuti, M., Borga, M., Comiti, F., Lucía, A., … Surian, N. (2016). An integrated approach for investigating geomorphic response to extreme events: Methodological framework and application to the October 2011 flood in the Magra River catchment, Italy. Earth Surface Processes and Landforms, 41(6), 835–846. https://doi.org/10.1002/esp.3902
- Rinaldi, M., Belletti, B., Comiti, F., Nardi, L., Bussettini, M., Mao, L., & Gurnell, A. M. (2015). The Geomorphic Units survey and classification System (GUS). Deliverable 6.2, Part 4, of REFORM (REstoring rivers FOR effective catchment Management), a Collaborative project (large-scale integrating project) funded by the European Commission within the 7th Framework Programme under Grant Agreement 282656.
- Roccati, A., Mandarino, A., Perasso, L., Robbiano, A., Luino, F., Faccini, F. (2020). Large-scale geomorphology of the Entella River floodplain (Italy) for coastal urban areas management. Journal of Maps, 0, 1–15. https://doi.org/10.1080/17445647.2020.1738281
- Romanescu, G., Cimpianu, C.I., Mihu-Pintilie, A., Stoleriu, C.C. (2017). Historic flood events in NE Romania (post-1990). Journal of Maps, 13(2), 787–798. https://doi.org/10.1080/17445647.2017.1383944
- Sacchini, A., Faccini, F., & Luino, F. (2016). Deep seated gravitational slope deformations in a Ligurian Apennines Catchment (Italy): evidences, characterizations and consequences. Disaster Advances, 9, 1–14.
- Sacchini, A., Ferraris, F., Faccini, F., Firpo, M. (2012). Environmental climatic maps of Liguria (Italy). Journal of Maps, 8(3), 199–207. https://doi.org/10.1080/17445647.2012.703901
- Salvati, P., Bianchi, C., Rossi, M. & Guzzetti, F. (2012). Floods in Italy. In: Changes in flood risk in Europe (Kundzewicz, Z. W., ed.). Special Publication No. 10, IAHS Press, Wallingford, Ch. 14, pp. 277–292.
- Santo, A., Santangelo, N., Forte, G., Falco, M.D. (2017). Post flash flood survey: The 14th and 15th October 2015 event in the Paupisi-Solopaca area (Southern Italy). Journal of Maps, 13(2), 19–25. https://doi.org/10.1080/17445647.2016.1249034
- Segura-Beltrán, F., Sanchis-Ibor, C., Morales-Hernández, M., González-Sanchis, M., Bussi, G., & Ortiz, E. (2016). Using post-flood surveys and geomorphologic mapping to evaluate hydrological and hydraulic models: The flash flood of the Girona River (Spain) in 2007. Journal of Hydrology, Flash Floods, Hydro-Geomorphic Response and Risk Management, 541, 310–329. https://doi.org/10.1016/j.jhydrol.2016.04.039
- Serrano-Notivoli, R., Mora, D., Ollero, A., Sánchez-Fabre, M., Sanz, P., & Saz, MÁ. (2017). Floodplain occupation and flooding in the Central Pyrenees. Cuadernos de Investigación Geográfica, 43(1), 309–328. https://doi.org/10.18172/cig.3057
- Shellberg, J. G., & Brooks, A. (2012). Alluvial gully erosion: A Dominant erosion process Across Tropical Northern Australia. Australian Rivers Institute, Griffith University, TRaCK. Charles Darwin University.
- Talbot, C.J., Bennett, E.M., Cassell, K., Hanes, D.M., Minor, E.C., Paerl, H., Raymond, P.A., Vargas, R., Vidon, P.G., Wollheim, W., & Xenopoulos, M.A. (2018). The impact of flooding on aquatic ecosystem services. Biogeochemistry, 141(3), 439–461. https://doi.org/10.1007/s10533-018-0449-7
- Tessitore, S., Di Martire, D., Martino, R., & Calcaterra, D. (2011). Comparison of 2d models for the simulation of the october 1954 debris flow and flood event at maiori (Campania region, Italy). 5th International Conference on Debris-Flow Hazard Mitigation: Mechanics, Prediction and Assessment, University of Padua, Italy, 14–17 June 2011. Italian Journal of Engineering Geology and Environment. doi: 10.4408/IJEGE.2011-03.B-057.
- Thompson, C., & Croke, J. (2013). Geomorphic effects, flood power, and channel competence of a catastrophic flood in confined and unconfined reaches of the upper Lockyer valley, southeast Queensland, Australia. Geomorphology, 197, 156–169. https://doi.org/10.1016/j.geomorph.2013.05.006
- Tropeano, D. (1989). Eventi alluvionali e frane nel bacino della Bormida. Studio retrospettivo. Quaderni di studi e di documentazione, Suppl. al Bollettino della Associazione Mineraria Subalpina n. 4 anno 26 10 [in Italian].
- Winterbottom, S. J. (2000). Medium and short-term channel planform changes on the Rivers Tay and Tummel, Scotland. Geomorphology, 34(3-4), 195–208. https://doi.org/10.1016/S0169-555X(00)00007-6
- Wyzga, B. (1996). Changes in the magnitude and transformation of flood Waves Subsequent to the channelization of the Raba River, Polish Carpathians. Earth Surface Processes and Landforms, 21(8), 749–763. https://doi.org/10.1002/(SICI)1096-9837(199608)21:8<749::AID-ESP675>3.0.CO;2-5
- Yousefi, S., Mirzaee, S., Keesstra, S., Surian, N., Pourghasemi, H.R., Zakizadeh, H.R., Tabibian, S. (2018). Effects of an extreme flood on river morphology (case study: Karoon River, Iran). Geomorphology, 304, 30–39. https://doi.org/10.1016/j.geomorph.2017.12.034
- Zani, A. (2000). Descrizione dei principali eventi alluvionali che hanno interessato la regione Piemonte, Liguria e nella Spagna Nord Orientale. Interreg IIc Assetto del Territorio e prevenzione delle Inondazioni, 205 pp [in Italian].