
ABSTRACT
The aim of the present map is to illustrate a detailed pre-earthquake hydrogeological conceptual model of the Sibillini Mts. This area was struck by a prolonged seismic sequence of up to Mw 6.5 in 2016. Geological, tectonic, and hydrogeological data were collected from the literature before 2016, subsequently standardized and re-interpretated with the aim of presenting a hydrogeological map (1:50,000 scale) of the Sibillini Mts. carbonate system (Central Italy). The map is supported by 11 hydrogeological both cross and longitudinal sections, which show the underground spatial relationship between aquifers, aquicludes, and tectonic elements. This Map provides a model of comparison for the new hydrogeological conditions emerging from the post-seismic research.
1. Introduction
Maps are some of the main products of the hydrogeology studies supporting reliable hydrogeological conceptualizations both in professional practices (groundwater planning and management) and in scientific research (Teixeira et al., Citation2013; Chaminé et al., Citation2015). Hydrogeological maps are essential tools for groundwater resources evaluation, identification of the aquifers recharge areas, definition of the springs location and main groundwater discharge directions determination (Zaltsberg, Citation1986; Schürch et al., Citation2007; McDonald et al. Citation2012 ; Al-Jiburi & Al-Basrawi, Citation2015; La Vigna et al., Citation2016; Manca et al., Citation2017; Brkić & Briški, Citation2018; Giacopetti et al., Citation2019a; Lucianetti et al., Citation2019; Lancia et al., Citation2020).
Since the 1980s, the large carbonate aquifers of Central Italy have been the subject of many hydrogeological studies supported by copious cartographic production. One of the first maps was the Hydrogeological Scheme of Central Italy (Boni et al., Citation1986), where a complete definition of the hydrogeological setting at regional scale (Scale 1:500,000) of Central Italy was proposed. The hydrogeological knowledge of the Apennines fractured aquifers has progressively increased since then. Specifically, the hydrogeological research in the Umbria-Marche sector of the Apennines has progressively improved achieving findings consistent with the regional hydrogeological framework, thanks to a gradual upscaling approach (Boni et al., Citation2005; Mastrorillo et al., Citation2009; Boni et al., Citation2010; Mastrorillo et al., Citation2012; Mastrorillo & Petitta, Citation2014).
The recent studies of the Umbria-Marche Apennines aquifers were carried out after the 2016 central Italy seismic events (Cheloni et al., Citation2019 and references therein), that produced persistent and anomalous hydrogeological changes in groundwater flow, especially in the Sibillini Mts. area. Many works were published, although suffering the lack of updated local hydrogeological framework before the 2016 (Checcucci et al., Citation2017; Petitta et al., Citation2018; Rosen et al., Citation2018; Giacopetti et al., Citation2019b; Valigi et al., 2019; Di Matteo et al., Citation2020; Fronzi et al., Citation2020; Mastrorillo et al., Citation2020; Valigi et al., Citation2020).
The aim of this work is the realization of a detailed pre-earthquake hydrogeological map at 1:50,000 scale of the area affected by hydrogeological changes attributable to the 2016 seismic sequence. The comparison between the new hydrological setting induced by the latest earthquake crisis and the pre-earthquake condition showed in the map, can provide a support for the studies aimed at understanding of the hydrogeological changes triggered by the seismic sequence. For this purpose, all data and information used in the realization of the Main Map are referred to the literature published before 2016.
2 Study area
2.1. Geological setting
The study area is located in the Central Apennines of Italy and extends over 1000 square kilometers between Umbria and Marche regions (). The area is characterized by a hilly to mountainous landscape with a maximum elevation of 2476 m a.s.l. (Vettore Mt.).
Figure 1. Geological scheme of the study area. The cross sections are reported in and .
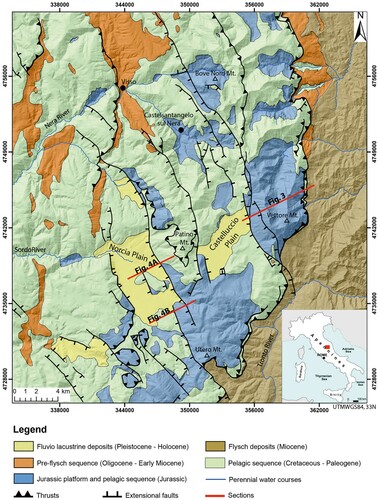
The Central Apennines are an East-verging arcuate fold-and-thrust belt formed in the middle-late Miocene and later dissected by SW-NE extensional tectonics which started affecting the study area since the early Pleistocene and is still considered active, with moderate seismicity (Chiaraluce et al., Citation2017).
The stratigraphy involved in the Central Apennine fold-and-thrust belt was formed in a passive continental margin environment related to the southern Tethys Ocean opening. This early extensional phase generated a series of horsts and grabens overlaid by either syn-rift pelagic or condensed units (Galuzzo & Santantonio, Citation2002). The end of rifting is marked by an overall continuous pelagic sedimentation started at the end of the early Cretaceous. As a result, the stratigraphy is composed of an over 2 km thick Meso-Cenozoic calcareous multilayer sequence (Cresta et al., Citation1989) consisting from bottom to top by: (1) carbonate platform unit about 600–700 m thick (Calcare Massiccio, early Jurassic) overlying a Triassic dolomite and evaporite sequence; (2) graben pelagic sequence with a thickness up to 1000 m (Corniola, Rosso Ammonitico, Marne a Posidonia, Diaspri, early–late Jurassic) made of limestones, clayey and cherty units, and a horst condensed sequence, made mostly of marl-limestone layers with thicknesses not exceeding 50 m (Bugarone, early–late Jurassic); (3) graben Cretaceous-Paleogene pelagic sequence (Maiolica, Marne a Fucoidi, Scaglia Bianca, Scaglia Rossa and Scaglia Variegata). The thickness of this sequence varies from 400 m up to between 2000 m, depending on the local sedimentary conditions; (4) Oligocene-early Miocene pre-flysch sequence, 100–300 m thick (Scaglia Cinerea, Bisciaro and Schlier heteropic with Marne a Cerrogna), closing the Umbria-Marche sequence. During Miocene-Pleistocene, hemipelagic, turbiditic and evaporitic sediments were deposited above the calcareous sequence (Flysch della Laga), with thickness between 50 and 2000 m () (Pierantoni et al., Citation2013; Teseo et al., Citation2013 and references therein)
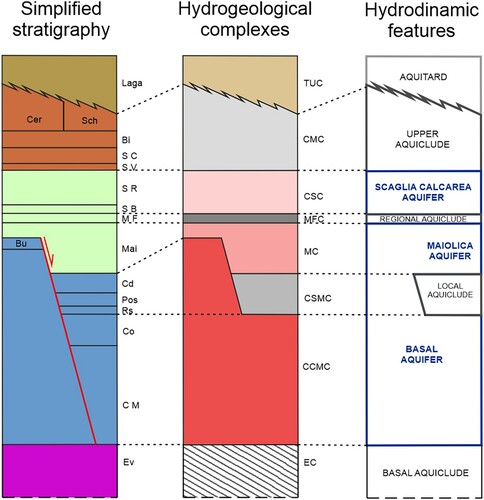
Figure 2. Sketch of relationships between the simplified stratigraphy, hydrogeological complexes and related hydrodynamic features (not in scale). Legend of simplified stratigraphy (name, thickness and age of the formations): Ev: dolomite and evaporite sequence, indefinite thickness (Triass); CM: Calcare Massiccio (600–700 m) (early Jurassic); Co: Corniola, Rs: Rosso Ammonitico, Pos: Marne a Posidonia, Cd: Diaspri corresponding to graben pelagic sequence (200–1000 m), Bu: Bugarone corresponding to horst pelagic sequence (50 m) (early-late Jurassic); Mai: Maiolica (50–500 m), MF: Marne a Fucoidi (50–100 m), SB: Scaglia Bianca, SR: Scaglia Rossa, SV: Scaglia Variegata (150–550 m total thickness) (Cretaceous-Paleogene); SC: Scaglia Cinerea, Bi: Bisciaro, Cer: Marne a Cerrogna, Sch: Schlier (100–300 m total thickness) (Oligocene – early Miocene); Laga: Flysch della Laga (50–2000 m) (Miocene – Pleistocene). Legend of hydrogeological complexes and related approximate thicknesses: EC: Dolomitic -Evaporitic complex (indefinite thickness); CCMC: Corniola – Calcare Massiccio complex (more than 1000 m); CSMC: Calcareous siliceous marly complex (200 m); MC: Maiolica complex (400–500 m); MFC: Marne a Fucoidi complex (50–100 m); CSC: Scaglia calcarea complex (500 m); CMC: Calcareous marly complex (200–500 m); TUC: Terrigenous units complex (more than 1000 m).
2.2. Hydrogeological setting
The Umbria-Marche sedimentary succession is the recharge area of two coexisting regional carbonate aquifers, partitioned in basal and shallow aquifers (Nanni & Vivalda, Citation2005; Mastrorillo et al., Citation2009; Boni et al., Citation2010; Mastrorillo & Petitta, Citation2014).
The basal aquifer is the most productive and exploited one. It consists of fractured and karst formations of Calcare Massiccio and Corniola (early Jurassic) and in fractured and layered Maiolica formation (early Cretaceous). Within the basal aquifer, a low permeability sequence is recognized in correspondence of the early–late Jurassic deposits. Where this sequence has maximum thickness, with a high clay component (graben pelagic sequence), it represents an aquiclude. Where the sequence is present in horst condensed facies (consisting of low thick marly-limestone), it acts as aquitard. In the first case, it is possible to distinguish two differentiated groundwater flows (the Maiolica aquifer sustained by the aquiclude sequence, above the basal aquifer s.s.). In the second condition only one aquifer exits (the basal aquifer) with an undifferentiated groundwater flow ().
The Triassic evaporites underlie the whole groundwater flow, acting as regional aquiclude of the basal aquifer ().
The preferential discharge directions of groundwater flow in the basal aquifer are NNW–SSE or N–S, in accordance with the regional structural lineaments, which usually hinder the transversal groundwater exchanges.
The shallow aquifer (‘Scaglia calcarea aquifer’) can be recognized within the Cretaceous limestones (Scaglia Bianca and Scaglia Rossa formations) and presents a very segmented groundwater flow (Mastrorillo, Citation2001; Mastrorillo & Petitta, Citation2010).
A marly–clayey upper-early Cretaceous aquiclude (Marne a Fucoidi formation) is interposed between the several discontinuous shallow Scaglia calcarea aquifers and the deeper basal aquifer, preventing groundwater mixing. The groundwater flow of the Scaglia calcarea aquifers develops above all in the peripheral sectors of the anticlinal ridges and in the cores of synclines, locally bounded by the Eocene–Miocene marly formations which play the role of aquiclude.
In the Umbria-Marche hydrogeological domain, the groundwater outflows occur mainly as gaining streams, in the stretches of rivers where the groundwater saturation level intercepts the riverbed elevation.
The Quaternary deposits, filling the intermontane extensional basins, host multilayer porous aquifers, mainly fed by lateral inflows from the surrounding carbonate reliefs. The coarse fractions of the layers favor the hydraulic connections between the fractured carbonate aquifers and the rivers flowing into the basins.
3 Material and methods
To build up the hydrogeological map of the area, the geological units were combined into appropriate complexes with similar hydrological features. Working in a GIS environment, the original polygons of the different geological units were joined into the new polygons of the hydrogeological complexes and the related new shapefiles were merged into a single uniform thematic layer based on topological criteria (Gragnanini et al., Citation2015).
The geological and hydrogeological information presented on the Main Map derive from the elaboration of available geological maps at different scales. The study area is completely covered by the official cartography at 1:100,000 scale, provided by the Italian Geological Survey (Morganti & Scarsella, 1941). A more recent and detail geological map (1:40,000 scale) was published by CitationPierantoni et al. (Citation2013), even if it does not provide the entire coverage of the study area. Other available geological maps, at 1:10,000 scale, are provided by the geological surveys of Umbria and Marche regions (Regione Marche, Citation2020; Regione Umbria, Citation2020). All the available maps were collected, and their information was compared, integrated, and homogenized, to get a consistent geological model of the whole study area, at 1:50,000 scale.
3.1. Hydrogeological complexes
The conceptual aggregation criteria of the Umbria-Marche geological formations in the hydrogeological complexes were taken from the available literature (Boni et al., Citation1986; Mari et al., Citation1995; Boni et al., Citation2005; Martarelli et al., Citation2008; Mastrorillo et al., Citation2009; Boni et al., Citation2010; Mastrorillo & Petitta, Citation2014) and outlined in . The classification of the hydrogeological complexes is based on the comparison between the estimated effective infiltration and the surface runoff rates. Shades of red were used to identify aquifer complexes, where the infiltration prevails over the runoff. The intensity of red color shade is proportional with the infiltration rate (darker shade – higher infiltration; paler shade – lower infiltration rate). On the contrary, where the surface runoff prevails over the infiltration, the complexes are marked with grey shades to emphasize the aquiclude role. The brown color represents the aquitard attitude of the complexes for which the infiltration and the runoff rates are equivalent. The fluvio-lacustrine deposits complex is represented in light blue and corresponds to multilayer porous aquifers with an extremely variable infiltration rate.
The alluvial and detrital coverage, reported in the original geological maps, are missing in the Main Map to emphasize the distribution of the recharge areas of the fractured carbonate aquifers. The limits of the hydrogeological complexes, originally covered by the alluvial and detrital deposits, were manually drawn, assuming their trend line consistent with the average thickness of the complexes, used in the realization of the sections. The alluvial and detrital deposits can host seasonal perched aquifers and they act as hydraulic connection between the carbonate aquifers and the gaining streams. Because of their limited extension and thickness, the alluvial and detrital deposits have a secondary hydrogeological role compared with the great fractured carbonate aquifers of the Central Apennines.
3.2. Springs
In this study, the spatial distribution of the springs, active before 2016, and their related data were collected from available publications (Mastrorillo et al., Citation2009; Boni et al., Citation2010; Mastrorillo et al., Citation2012) and technical reports (Petitta, Citation2011).
The springs included in the Main Map have a mean discharge equal or higher than 30 L/s. The springs were differentiated by aquifer type (basal, Maiolica or Scaglia calcarea aquifers), according to the hydrogeological setting described above. Detailed information such as ID code, name, elevation, mean discharge and bibliographic reference of each mapped spring are reported in .
Table 1. Springs of the study area, distinguished by the aquifer of origin (B: basal aquifer; M: Maiolica aquifer; SC: Scaglia calcarea aquifer).
The differentiation of the springs on the basis of the aquifer nature was based on both the most likely recharge area of each spring (Boni et al., Citation2010) and on the results of groundwater chemical analysis. SO42– and Mg+ enrichment usually distinguishes the waters of the basal aquifer from the waters of Maiolica one, while significant concentrations of Na+, K+ and Cl− characterize the water of the Scaglia calcarean aquifers (Mastrorillo et al., Citation2012; Mastrorillo & Petitta, Citation2014).
3.3. Tectonic elements
The careful review of the structural data from the literature (Calamita et al., Citation1982; Brozzetti & Lavecchia, Citation1994; Pierantoni et al., Citation2013; Civico et al., Citation2018; Brozzetti et al., Citation2019 and therein references) has led to select the tectonic elements with regional significance. The choice to map only the regional tectonic lineaments simplifies the reading of the map and highlights the specific hydrodynamic roles of the considered tectonic elements. Generally, the thrust faults act as hydraulic barriers, whereas the normal faults do not necessarily correspond to a seal of the groundwater flow, because their permeability is controlled by the fracture network properties (connectivity, density, orientation, and length distribution of the fractures) of the fault zone (Bense et al., Citation2013).
3.4. Cross sections
The hydrogeological map is supported by a 3D conceptual model defined by 11 hydrogeological sections at 1:50,000 scale. Eight sections are perpendicular (SW–NE) and three are parallel (NNW–SSE) to the main regional structural lineaments. The topographic profiles were generated from the digital elevation model, with a cell size of 20 m, available from the Web Portal of the Italian Ministry of Environment, (Ministero dell’Ambiente, Citation2020).
The realization of the hydrogeological cross sections needed simplifications of both the complexity of the structural elements and the thickness variability of each hydrogeological complex. The minimum and maximum values of the thickness of each hydrogeological complex are reported in the caption of . The thickness can vary according to the geological evolution and the paleo-depositional environment, sometime with significant differences, as described in the Geological setting paragraph. The most significant thickness variability is related to the Calcareous-siliceous marly complex and the overlying Maiolica complex. We considered the mean thickness of both complexes, in view of the regional scale approach of this study. In the Main Map, the presence of the Maiolica aquifer springs can be considered an indication of the maximum thickness of the two complexes. Within the graben pelagic sequence, the Maiolica and Calcareous-siliceous marly complexes present their maximum thickness. Here, the Calcareous-siliceous marly complex, which is characterized by a high clayey component, acts as an aquiclude, allowing the coexistence of distinct of the basal and Maiolica aquifers ().
The Triassic dolomite and evaporites never outcrop in the study area. The elevation of the basal aquiclude top in each section was therefore reconstructed from the mean thickness of the Umbria-Marche sedimentary formations summarized in .
The saturation level of the basal aquifer was drawn according to the outflow elevation of the basal aquifer springs included in the Main Map and according to the mean hydraulic gradient estimated from the literature (Boni et al., Citation2005; Mastrorillo et al., Citation2020). Because of the small extension of the upper Scaglia calcarea aquifers and the perched Maiolica aquifers, average values of their respective hydraulic gradient are not available. The saturation levels of these aquifers were not therefore included in the cross sections.
4. Results and discussion
The sequence of hydrogeological complexes with different hydrodynamic attitudes combined with the E-dipping thrust-and-fold belt regional tectonic framework, drives the hydrostructural setting of the Umbria-Marche domain, well represented in the study area. Generally, the anticline cores host the basal aquifers, whereas the slopes of ridges and the synclines correspond to the peripheral Scaglia calcarea aquifers. This peculiar hydrogeological setting is clearly visible in the Main Map, where also the distribution of recharge area of the different aquifers is well shown. The distribution of the recharge areas of their respective aquifers is not uniformly distributed. The main recharge zone of the basal aquifer corresponds to the Southern sector of the map, where the Maiolica and Corniola–Calcare Massiccio complexes crop out and are structurally more elevated than in other areas. The recharge area of the Scaglia calcarea aquifers is mainly widespread in the western sector of the map.
The main regional thrust (Sibillini Mts. Thrust) hydraulically seals the study area along the eastern side. Other western significant thrusts partition the basal aquifer splitting the deep groundwater circulation in different sectors with prevalent direction towards the NNW. This hydrostructural setting is complicated by the presence of the normal faults that dissect the pre-existing thrusts, altering the sealing role of the latter and allowing non-negligible groundwater seepages at the local scale.
Within the study area 36 springs with discharge rate ≥30 L/s are mapped. 17 springs are fed by the basal aquifer, 7 by the Maiolica aquifers and 12 by the Scaglia calcarea aquifers.
Only 9 springs emerge as point springs, while the remaining emerge as gaining streams.
The sum of the average discharge of the springs in the study area is more than 15,000 L/s. The total basal aquifer discharge reaches at least 10,000 L/s, representing the 67% of the total, the Scaglia calcarea aquifers discharge is almost 4000 L/s (almost 27% of the total) and the Maiolica springs have a total discharge of almost 1000 L/s (6% of the total).
In the whole Umbria-Marche hydrostructural domain, the average annual infiltration rate ranges between 200 and 400 mm/year for the Scaglia calcarea complex, between 250 and 500 mm/year for the Maiolica complex and between 800 and 1100 mm/year for the Corniola – Calcare Massiccio complex, according to the literature data (Caprari & Nanni, Citation1999; Boni et al., Citation2005; Mastrorillo et al., Citation2009; Boni et al., Citation2010; Mastrorillo & Petitta, Citation2014). Generally, the infiltration values increase moving toward the southern sectors of the Umbria-Marche domain, due to the decrease of the marly components and the intensification of the tectonic fracturing (Mastrorillo, Citation2001). Considering that the study area covers the southern section of the Umbria-Marche domain, it is reasonable to expect the highest values of infiltration rate interval.
The presumed extension of the recharge areas was estimated dividing the mean total discharge flowing out from each aquifer by the highest infiltration values suggested for each complex. The Scaglia calcarea aquifers, having a total discharge of 4000 L/s should be recharged by an area of almost 315 km2. A recharge area of 63 km2 corresponds to the Maiolica aquifers (with a total discharge of 1000 L/s), while the basal aquifer to which corresponds a total discharge of 10,000 L/s should have 287 km2 recharge area.
The estimated recharge area extension is comparable to the areal distribution of the aquifer complexes reported in the Main Map. In detail, the outcrops of the Scaglia calcarea complex cover about 350 km2 and the undifferentiated outcrops of the Maiolica and the Corniola-Calcare Massiccio complexes extend for about 400 km2. In the study area, the basal and the Maiolica aquifers are grouped into a single recharge area because it is not always possible to clearly distinguish the recharge areas of each Maiolica spring.
The extension of the aquifer complexes reported in the Main Map is slightly higher than the expected dimension. This slight inconsistency could be attributed both to the choice of the highest values of infiltration in the calculation and the possible presence of springs located outside the Main Map which are recharged by the mapped area. In any case, the results allow to affirm at regional scale that the recharge areas of the mapped springs are included in the Main Map and, considering the prevalent NNW directed groundwater flow, it is reasonable to identify the main recharge area of the basal aquifer in the southern sector of the map, where the Maiolica and Corniola-Calcare Massiccio complexes outcrop are widest and highest.
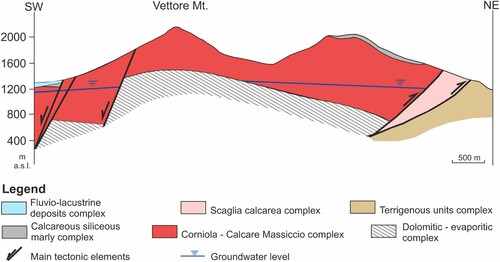
The three-dimensional view, given by the longitudinal and transverse geological sections, confirms the continuity of the hydraulic connection of the basal aquifer in NNW–SSE direction and shows the highest structural elevation of the bedrock in the southern sector of the study area. In addition, in the Vettore Mt. area (south-eastern sector of the study area) the basal aquiclude reaches higher elevations than the saturation level of the basal aquifer acting as groundwater divide between the western and the eastern portions of the basal aquifer ().
Figure 3. Excerpt from Main Map G-G’ cross section in correspondence of the Vettore Mt., where the basal aquiclude acts as groundwater divide within the basal aquifer. The trace of the cross-section is reported in .
In each cross section, starting from the spring elevation, the upgradient trend of the water table level was interpolated, assigning hydraulic gradient values between 0.03 and 0.04 (Boni et al., Citation2005; Mastrorillo et al., Citation2020). The reconstruction of the saturation level in each section permits a widespread vision of the saturation level of the basal aquifer over the whole study area. In this way, the groundwater water level is recognizable not only in proximity of the springs but also within the carbonate reliefs where this information was lacking.
The identification of the water table in each transversal section also highlights the local hydrodynamic attitude of the tectonic elements. The role of hydraulic barriers of the thrust faults is always confirmed, even in the case of Patino Mt. Thrust (center of the map, Norcia area), where the saturation level of the basal aquifer is below the thrust position. In this area the thrust fault is not involved in the basal aquifer circulation, but it could act as lower aquiclude of a perched small aquifer hosted in the top of the relief. In the proposed structural interpretation, the Patino Mt. Thrust would be progressively lowered under the Norcia Plain by the Norcia SW-dipping normal fault. According to this structural hypothesis, it is not possible to deduce the position of the groundwater level in the further south sector of the basal aquifer.
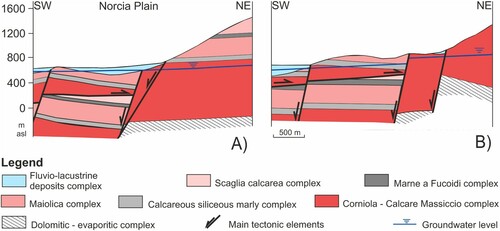
Most of the extensional faults reported in the Main map may drive the groundwater flow directions, but they do not seem to alter the continuity of the water table. When these faults end in correspondence on the tips due to the progressive decrease of their displacement, or in correspondence of transfer zones they can favor a hydraulic connectivity. This is the case of the NW termination of the Norcia fault which mostly acts as a hydraulic barrier keeping separate two basal aquifer sectors, in the southern sector of the study area, where has its maximum displacement, about 1000 m (Brozzetti & Lavecchia, Citation1994). While NW of Norcia town, where it is transferred to the Campi-Preci segment allows hydraulic continuity along a E–W direction as also suggested by previous studies (Petitta, Citation2011; Mastrorillo et al., Citation2020) ().
Figure 4. Excerpt from Main Map G-G’ and I-I’ cross sections showing different role of the extensional faults in groundwater circulation (A) hydraulic connection; (B) hydraulic barrier. The traces of the cross-sections are reported in .
5. Conclusion
The hydrogeological map presented in this study illustrates the spatial distribution of the main elements characterizing the regional fractured aquifers of the Sibillini Mts. carbonate system (Central Italy). It represents the situation prior to 2016 when the study area was struck repeatedly by seismic events up to Mw 6.5, that triggered complex hydrogeological changes. The effect on the hydrogeological setting due to the seismic crisis is not yet exhausted and scientific research on this topic is still in progress. We believe that in this general context, the hydrogeological map proposed, besides illustrating the detailed hydrogeological setting (scale 1:50,000), provides the basis to compare the pre-earthquake setting with the post-earthquake effects and to define their relationships with the hydrogeological setting of the area.
The hydrogeological cross sections were realized considering the consistency of the transversal and longitudinal deep spatial relationship between the aquifers, aquiclude and tectonic elements. This pseudo-3D-dimensional view of the Sibillini Mts. hydrogeological model allows to make realistic assumptions on the most likely groundwater discharge directions from the recharge areas to the springs and the hydrodynamic roles played by the main tectonic elements.
The proposed model shows the importance of the basal aquifer as the main regional groundwater reservoir and the local relevant availability of the groundwater resource of the Scaglia calcarea aquifers.
The analysis of the results highlights some specific situations in which the interpretative model is still weak and not exhaustive. Above all, two aspects need further investigations:
- the distinction between the recharge area of the basal and the Maiolica aquifers
- the validation of the hydrostructural connection between the southern recharge area and the northern springs in the westernmost ridge of the study area. This uncertainty did not allow to draw the saturation level in one of the longitudinal cross sections.
As a final comment, we want to emphasize the effectiveness of the hydrogeological regional studies in conjunction with geo-structural approaches, as this work intended. The content of the present map, combined with the information from the cross sections, provides a detailed framework in which the hydrogeological features are validated by the geo-structural factors.
Software
ESRI ArcGIS 10.1 was used for the production of the original shapefiles. Hydrogeological cross sections were realized using Coreldraw X3. Final editing of the map was performed using Adobe Illustrator CS.
Main_Map_Mastrorillo_REV2_110221.pdf
Download PDF (31.9 MB)Acknowledgements
The authors would like to thank D. Renghi and L. Ottaviani for fieldwork support
Disclosure statement
No potential conflict of interest was reported by the author(s).
Data availability statement
The authors confirm that the data supporting the findings of this study are available within the article.
Additional information
Funding
Related Research Data
References
- Al-Jiburi, H. K., & Al-Basrawi, N. H. (2015). Hydrogeological map of Iraq, scale 1: 1000 000. Iraqi Bulletin of Geology and Mining, 11(1), 17–26.
- Bense, V. F., Gleeson, T., Loveless, S. E., Bour, O., & Scibek, J. (2013). Fault zone hydrogeology. Earth-Science Reviews, 127, 171–192. https://doi.org/https://doi.org/10.1016/j.earscirev.2013.09.008
- Boni, C., Baldoni, T., Banzato, F., Cascone, D., & Petitta, M. (2010). Hydrogeological study for identification, characterization and managementof groundwater resources in the Sibillini Mountains NationalPark (Central Italy). Italian Journal of Engineering Geology and Environment, 2, 21–39. https://doi.org/https://doi.org/10.4408/IJEGE.2010-02.O-02
- Boni, C., Bono, P., & Capelli, G. (1986). Schema idrogeologico dell’Italia centrale. Memorie della Società Geologica Italiana, 35, 991–1012.
- Boni, C., Mastrorillo, L., Cascone, D., & Tarragoni, C. (2005). Carta idrogeologica delle dorsali interne umbro-marchigiane (scala 1:50.000). Pubblicazione N. 2865 CNR – Gruppo Nazionale Difesa Catastrofi Idrogeologiche.
- Brkić, Z., & Briški, M. (2018). Hydrogeology of the western part of the Drava basin in Croatia. Journal of Maps, 14(2), 173–177. https://doi.org/https://doi.org/10.1080/17445647.2018.1445043
- Brozzetti, F., Boncio, P., Cirillo, D., Ferrarini, F., De Nardis, R., Testa, A., Liberi, F., & Lavecchia, G. (2019). High-resolution field mapping and analysis of the August–October 2016 coseismic surface faulting (central Italy earthquakes): slip distribution, parameterization, and comparison with global earthquakes. Tectonics, 38(2), 417–439. https://doi.org/https://doi.org/10.1029/2018TC005305
- Brozzetti, F., & Lavecchia, G. (1994). Seismicity and related extensional stress field: The case of the Norcia seismic zone (Central Italy). Annales Tectonicae, 8, 38–57.
- Calamita, F., Coltorti, M., Deiana, G., Dramis, F., & Pambianchi, G. (1982). Neotectonic evolution and geomorphology of the Cascia and Norcia depressions (Umbria-Marche apennine). Geografia Fisica e Dinamica Quaternaria, 5, 263–276.
- Caprari, M., & Nanni, T. (1999). Idrogeologia della dorsale carbonatica del M.Catria – M.Nerone (Appennino umbro-marchigiano). Bollettino Società Geologica Italiana, 118, 313–326.
- Chaminé, H. I., Carvalho, J. M., Teixeira, J., & Freitas, L. (2015). Role of hydrogeological mapping in groundwater practice: Back to basics. European Geologist, 40, 34–42.
- Checcucci, R., Mastrorillo, L., & Valigi, D. (2017). Groundwater and earthquake: Brief remarks about seismic effects on groundwater resources availability in Valnerina. Italian Journal of Groundwater, 6(1), 75–77. https://doi.org/https://doi.org/10.7343/as-2017-259
- Cheloni, D., Falcucci, E., & Gori, S. (2019). Half-graben rupture geometry of the October 30, 2016 MW 6.6 Mt. Vettore-Mt. Bove earthquake, Central Italy. Journal of Geophysical Research: Solid Earth, 124(4), 4091–4118. https://doi.org/https://doi.org/10.1029/2018JB015851
- Chiaraluce, L., Di Stefano, R., Tinti, E., Scognamiglio, L., Michele, M., Casarotti, E., Cattaneo, M., De Gori, P., Chiarabba, C., Monachesi, G., Lombardi, A., Valoroso, L., Latorre, D., & Marzorati, S. (2017). The 2016 Central Italy seismic sequence: A first look at the mainshocks, aftershocks, and source models. Seismological Research Letters, 88(3), 757–771. https://doi.org/https://doi.org/10.1785/0220160221
- Civico, R., Pucci, S., Villani, F., Pizzimenti, L., De Martini, P. M., Nappi, R., & the Open EMERGEO Working Group (2018) Surface ruptures following the 30 October 2016 Mw 6.5 Norcia earthquake, central Italy. Journal of Maps, 14(2), 151–160. https://doi.org/https://doi.org/10.1080/17445647.2018.1441756
- Cresta, S., Monechi, S., & Parisi, G. (1989). Stratigrafia del mesozoico e cenozoico nell'area umbro-marchigiana. Memorie Descrittive Della Carta Geologica D'Italia, 39, 1–182.
- Di Matteo, L., Dragoni, W., Azzaro, S., Pauselli, C., Porreca, M., Bellina, G., & Cardaci, W. (2020). Effects of earthquakes on the discharge of groundwater systems: The case of the 2016 seismic sequence in the Central Apennines, Italy. Journal of Hydrology, 583, 1-13. https://doi.org/https://doi.org/10.1016/j.jhydrol.2019.124509
- Fronzi, D., Banzato, F., Caliro, S., Cambi, C., Cardellini, C., Checcucci, R., Mastrorillo, L., Mirabella, F., Petitta, M., Valigi, D., & Tazioli, A. (2020). Preliminary results on the response of some springs of the Sibillini Mountains area to the 2016-2017 seismic sequence. Italian Journal of Groundwater, 9 (1), 19–25. https://doi.org/https://doi.org/10.7343/as-2020-450
- Galuzzo, F., & Santantonio, M. (2002). The Sabina Plateau: A new element in the mesozoic palaeogeography of central Apennines. Bollettino Della Società Geologica Italiana, 1, 561–588.
- Giacopetti, M., Fabbrocino, S., Ianni, C., Materazzi, M., & Pambianchi, G. (2019b). Co-seismic and post-seismic changes in groundwater discharge: First results from the epicentral region of the Central Italy earthquake 2016. Rendiconti Online Della Società Geologica Italiana, 47, 52–57. https://doi.org/https://doi.org/10.3301/ROL.2019.10
- Giacopetti, M., Materazzi, M., Pambianchi, G., & Posavec, K. (2019a). A combined approach for a modern hydrogeological mapping: The case study of Tennacola stream catchment (central Apennine, Italy). Journal of Maps, 15(2), 203–214. https://doi.org/https://doi.org/10.1080/17445647.2019.1574621
- Gragnanini, V., Mastrorillo, L., Vignaroli, G., Mazza, R., & Rossetti, F. (2015). Hydrolithology of the area between Tuscany, Latium and Umbria regions (Italy). Journal of Maps, 11(3), 464–479. https://doi.org/https://doi.org/10.1080/17445647.2014.942528
- Lancia, M., Su, H., Tian, Y., Xu, J., Andrews, C., Lerner, D. N., & Zheng, C. (2020). Hydrogeology of the Pearl River Delta, southern China. Journal of Maps, 16(2), 388–395. https://doi.org/https://doi.org/10.1080/17445647.2020.1761903
- La Vigna, F., Mazza, R., Amanti, M., Di Salvo, C., Petitta, M., Pizzino, L., Pietrosante, A., Martarelli, L., Bonfà, I., Capelli, G., Cinti, D., Ciotoli, F., Ciotoli, G., Conte, G., Del Bon, A., Dimasi, M., Falcetti, S., Gafà, R. M., Lacchini, A., … Succhiarelli, C. (2016). Groundwater of Rome. Journal of Maps, 12(S1), 88–93. doi:https://doi.org/10.1080/17445647.2016.1158669
- Lucianetti, G., Mazza, R., & Mastrorillo, L. (2019). Hydrogeology of a high Alpine carbonate aquifer (Pale di San Martino, Dolomites, northern Italy). Journal of Maps, 15(2), 448–459. https://doi.org/https://doi.org/10.1080/17445647.2019.1611497
- Manca, F., Viaroli, S., & Mazza, R. (2017). Hydrogeology of the Sabatini Volcanic District (Central Italy). Journal of Maps, 13(2), 252–259. https://doi.org/https://doi.org/10.1080/17445647.2017.1297740
- Mari, G. M., Motteran, G., Scalise, A. R., Terribili, D., & Zattini, N. (1995). Carta idrogeologica d’italia 1:50 000 guida al rilevamento e alla rappresentazione. Quaderni Servizio Geologico Nazionale, 3(5), 1-37.
- Martarelli, L., Petitta, M., Scalise, A. R., & Silvi, A. (2008). Experimental hydrogeological cartography of the Rieti Plain (Latium) Memorie. Descrittive. Carta Geological. d’Italia. LXXXI, 137–156.
- Mastrorillo, L. (2001). Elementi strutturali e caratteristiche idrogeologiche della dorsale carbonatica umbro-marchigiana interna. Memorie Della Società Geologica Italiana, 56, 219–226.
- Mastrorillo, L., Baldoni, T., Banzato, F., Boscherini, A., Cascone, D., Checcucci, R., Petitta, M., & Boni, C. (2009). Quantitative hydrogeological analysis of the carbonate domain of the Umbria region (Central Italy). Italian Journal of Engineering Geology and Environment, 1, 137–155. https://doi.org/https://doi.org/10.4408/IJEGE.2009_01.O-08
- Mastrorillo, L., Nanni, T., Petitta, M., Vivalda, P. M., Banzato, F., & Palpacelli, S. (2012). Groundwater resources of the upper basin of Aso river (Sibillini Mts. National park): hydrogeological study and management evaluation. Engineering-Hydro-Environmental Geology (Giornale di Geologia Applicata), 15, 83–96. https://doi.org/https://doi.org/10.1474/EHEGeology.2012-15.0-06.0296
- Mastrorillo, L., & Petitta, M. (2010). Effective infiltration variability in the Umbria-Marche carbonate aquifers of Central Italy. Journal of Mediterranean Earth Sciences, 2, 9–18. https://doi.org/https://doi.org/10.3304/JMES.2010.002
- Mastrorillo, L., & Petitta, M. (2014). Hydrogeological conceptual model of the upper Chienti river basin aquifers (Umbria-Marche Apennines). Italian Journal of Geoscience, 133(3), 396–408. https://doi.org/https://doi.org/10.3301/IJG.2014.12
- Mastrorillo, L., Saroli, M., Viaroli, S., Banzato, F., Valigi, D., & Petitta, M. (2020). Sustained post-seismic effects on groundwater flow in fractured carbonate aquifers in central Italy. Hydrological Processes, 34(5), 1167–1181. https://doi.org/https://doi.org/10.1002/hyp.13662
- McDonald, A. M., Bomsor, H. C., Dochartaigh, B. E., & Taylor, R. G. (2012). Quantitative maps of groundwater resources in Africa. Environ. Res. Lett, 7(2),1-7 024009. https://doi.org/https://doi.org/10.1088/1748-9326/7/2/024009
- Ministero dell’Ambiente. (2020). Modello digitale del terreno – 20 m. Available at http://wms.pcn.minambiente.it
- Morganti, E., & Scarsella, F. (1941). Carta geologica d'Italia alla scala 1: 100.000. Foglio 132, Servizio Geologico d'Italia.
- Nanni, T., & Vivalda, P. (2005). The aquifers of the Umbria-Marche adriatic region: Relationships between structural setting and groundwater chemistry. Italian Journal of Geosciences, 124, 523–542.
- Petitta, M. (2011). Integrazione della base conoscitiva per la gestione della risorsa idrica sotterranea del Parco Nazionale dei Monti Sibillini. Tecnical Report for internal use. Parco Nazionale dei Monti Sibillini, p. 101.
- Petitta, M., Mastrorillo, L., Preziosi, E., Banzato, F., Barberio, D. M., Billi, A., Cambi, C., De Luca, G., Di Carlo, G., Di Curzio, D., Di Salvo, C., Nanni, T., Palpacelli, S., Rusi, S., Saroli, M., Tallini, M., Tazioli, A., Valigi, D., Vivalda, P., & Doglioni, C. (2018). Water-table and discharge changes associated with the 2016–2017 seismic sequence in Central Italy: Hydrogeological data and a conceptual model for fractured carbonate aquifers. Hydrogeology Journal, 26(4), 1009–1026. https://doi.org/https://doi.org/10.1007/s10040-017-1717-7
- Pierantoni, P., Deiana, G., & Galdenzi, S. (2013). Stratigraphic and structural features of the Sibillini Mountains (Umbria-Marche Apennines. Italy). Italian Journal of Geosciences, 132(3), 497–520. https://doi.org/https://doi.org/10.3301/IJG.2013.08
- Regione Marche. (2020). Regional geological map at 1:10000 scale. Available at https://www.regione.marche.it/Regione-Utile/Paesaggio-Territorio Urbanistica/Cartografia/Repertorio/Cartageologicaregionale10000)
- Regione Umbria. (2020). Regional geological maps. Available at http://www.regione.umbria.it/paesaggio-urbanistica/cartografia-geologica
- Rosen, M. R., Binda, G., Archer, C., Pozzi, A., Michetti, A. M., & Noble, P. J. (2018). Mechanisms of earthquake-induced chemical and fluid transport to carbonate groundwater springs after earthquakes. Water Resources Research, 54(8), 5225–5244. https://doi.org/https://doi.org/10.1029/2017WR022097
- Schürch, M., Kozel, R., & Jemelin, L. (2007). Hydrogeological mapping in Switzerland. Hydrogeology Journal, 15(4), 799–808. https://doi.org/https://doi.org/10.1007/s10040-006-0136-y
- Teixeira, J., Chaminé, H. I., Carvalho, J. M., Alberti, A. P., & Rocha, F. (2013). Hydrogeomorphological mapping as a tool in groundwater exploration. Journal of Maps, 9(2), 263–273. https://doi.org/https://doi.org/10.1080/17445647.2013.776506
- Teseo, T., Collettini, C., Viti, C., & Barchi, M. R. (2013). Fault architecture and deformation mechanisms in exhumed analogues of seismogenic carbonate-bearing thrusts. Journal of Structural Geology, 55, 167–181.doi:https://doi.org/10.1016/j.jsg.2013.07.007
- Valigi, D., Fronzi, D., Cambi, C., Beddini, G., Cardellini, C., Checcucci, R., Mastrorillo, L., Mirabella, F., & Tazioli, A. (2020). Earthquake-induced spring discharge modifications: The Pescara di Arquata spring reaction to the August–October 2016 Central Italy earthquakes. Water, 12(3), 1-18. https://doi.org/https://doi.org/10.3390/w12030767
- Valigi, D., Mastrorillo, L., Cambi, C., Barchi, M. R., Cardellini, C., Checcucci, R., Di Matteo, L., Frondini, F., Mirabella, F., Viaroli, S., & Vispi, I. (2019). Springs discharge variations induced by strong earthquakes: The Mw 6.5 Norcia event (Italy, October 30th 2016). Rendiconti Online della Società Geologica Italiana, 47, 141–146. https://doi.org/https://doi.org/10.3301/ROL.2019.25
- Zaltsberg, E. (1986). Hydrogeological mapping: Regional distribution of groundwater resources. Canadian Water Resources Journal/Revue Canadienne des Ressources Hydriques, 11(2), 33–40. https://doi.org/https://doi.org/10.4296/cwrj1102033