
ABSTRACT
Hydrogeological mapping is a key tool for groundwater resource management. Generally, hydrogeological maps focus mainly on porous or karst aquifer at large scale. In a fractured-rock aquifer, the groundwater flow path is not immediately deductible due to the intrinsic complexity of fracture systems. Then, it is of crucial importance collecting a complete dataset describing the site of interest: fault and strata patterns, geomorphological features, occurrence of springs. Here we present the hydrogeological map at 1:10,000 scale of the fractured rock aquifer of Conglomerate of Portofino (Italy). The graphical information contained in this map is based on the authors’ field survey and the revision of papers written for academic purposes and technical reports. The aim of the research is to achieve a useful tool for land planning, conservation of groundwater resource and geo-hydrological risk reduction in the unique area of the Natural Park of Portofino.
1. Introduction
Due to water shortage problems on local, regional and even global levels, interest in groundwater has been increasing considerably during the past decades (Richts et al., Citation2011). In order to support the sustainable management of groundwater resources, it is necessary to assess, map and quantify the stored volume and average annual replenishment of groundwater (Vaux, Citation2011).
Hydrogeological mapping is a focal reference and scientific tool for sustainable management and protection of groundwater resources. For this reason, groundwater cartography plays an essential role in water data representation (Chaminé Citation2015; Chaminé et al., Citation2015).
In the past, hydrogeological maps were generally made for regional water management aims at large scale (Boni et al., Citation1986a; Citation1986b; Citation1986c; Celico, Citation1978; CitationCelico, 1983). On the contrary, in the recent decades, a series of detailed hydrogeological maps at scale 1:50,000 have been realized in order to detect the local relationships between surface water and groundwater, mainly in porous and karst media (Amanti et al., Citation2016). Research on aquifers in fractured rock masses is less frequent, probably due to the general lack of interest in groundwater circulation.
In very recent times interesting research on hydrogeological mapping has been developed in different Mediterranean geological and geomorphological contexts, e.g.: an original hydrogeological map of Etna volcanic massif as useful tool for groundwater resources management (Ferrara & Pappalardo, Citation2008); the hydrogeology layout of the Sabatini volcanic district in Central Italy (Manca et al., Citation2017); a hydrogeological mapping case-study of a heterogeneous and multi-layered ophiolitic aquifers in the Northern Apennines (Segadelli et al., Citation2017); a groundwater analysis of a sedimentary sequence consisting of limestones, marly limestones and marls in the Sibillini Mountains National Park, in Central Apennines (Boni et al., Citation2009; Giacopetti et al., Citation2019).
In accordance with recent Italian and international cartographical guidelines (Martarelli & Scalise, Citation2011; Tarragoni et al., Citation2011; Teixeira et al., Citation2013) and papers (De Luca et al., Citation2020; Pantaleone et al., Citation2018; Lucianetti et al., Citation2019; Lancia et al., Citation2020) here we present the groundwater map in a significant hard-rock aquifer, considering research about the local water circulation in a fractured rock mass.
The Conglomerate of Portofino was chosen because it represents an excellent example of fractured rock mass with high geomechanical quality whose groundwater circulation has attracted researchers since the end of the nineteenth century. The Conglomerate of Portofino also represents a unique landscape and cultural heritage as it is the ‘soul’ of the Portofino Natural Park.
With this original hydrogeological map, we would like to provide a tool for the comprehension of the groundwater flow path, the distribution of all the springs on the area and their relationship with villages, pathways and infrastructures.
The peculiarities of the area, from the geomorphology of its coastal cliffs to its terraced landscapes, are strongly related to the conglomerate that has been studied for more than a century. One of the first researches was conducted by Giovanni Ristori (Ristori, Citation1901)CitationRistori, 1901] who carefully studied the springs on the hard-rock conglomerate in order to design and realize a new aqueduct for the town of Camogli.
Further studies during 1960s and 1970s allowed a better interpretation of the structural lineaments and petrophysical properties of the conglomerate (Giammarino et al., Citation1969). Between the end of 1990s and the beginning of 2000s, a series of ecological studies was conducted to link geological and hydrogeological aspects with agrotechnical and geotouristic purpose (Ercoli et al., Citation2001). Further, in recent years, the Conglomerate of Portofino has been studied in various geomorphological and hydrogeological observations (Faccini et al., Citation2008; Bonaria et al., Citation2016; Brandolini et al., Citation2007a; Citation2007b; Coratza et al., Citation2019; Paliaga et al., Citation2020).
The survey and research methodology has followed the guidelines for the realization of the hydrogeological map of Italy (CitationISPRA, 2018).
The hydrogeological map is then intended as a specific part of the Water Protection Master Plan, established by the Italian Legislative Decree n.152/2006, which is a regional planning tool for water action strategies (introduced by the ‘Framework Directive for Community action in the field of water policy (2000/60/EC))’. Besides, groundwater management is necessary for the qualitative and quantitative protection of the water systems in the Park of Portofino, especially since human water footprint in natural areas has increased. Then a comprehensive study of sustainable water use is needed (Gössling, Citation2001) and the map may play a crucial role in assessing relationships and resource availability.
2. Physical geography and geology outlines
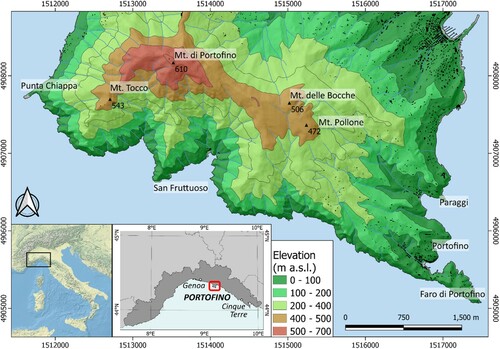
The Monte di Portofino and its related Promontory, which is surrounded by cliffs, is located at about 25 km East of Genoa and it is known for its namesake Park established in 1935 (). The orography is characterized by a NW–SE oriented ridge that interrupts the linearity of the coast between Genoa and the Cinque Terre; the highest peak is the Monte di Portofino, that rises 610 m above the sea level.
Figure 1. Geographic setting with altitude sketch map of Mt. di Portofino.
The main urban area of Portofino and Santa Margherita Ligure () stands along the coastline, while most of the territory of the Promontory is natural or dispersedly settled.
The climate on the Promontory is Mediterranean type (Csa sensu Koppen), even though the slopes various exposures determines different topoclimates (Sacchini et al., Citation2012; Sacchini et al., Citation2016).
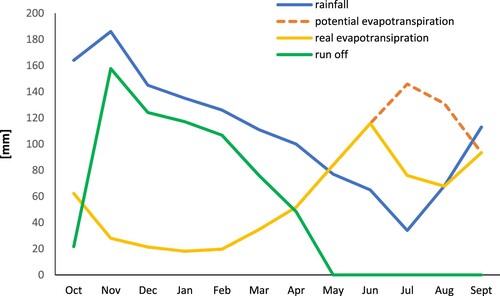
The mean annual rainfall ranges between 1000 mm along the coastline and 1500 mm in the highest area: the absolute maximum occurs in autumn (mainly October and November) and the minimum in summer (July).
The mean annual air temperature ranges between 16°C and 17°C along the coast, and between 13°C and 14°C in the highest altitude area: the absolute maximum occurs in summer (July) and the minimum in winter (January). The average annual hydrological balance shows that rainfall happens all along the year, even if it is not very significant in summer; on the other hand, there is a significant evapotranspiration contribution, with a deviation between effective and potential evapotranspiration only in July and August, and water surplus from October to April ().
Figure 2. Monthly water budget sensu Thornthwaite, recording data from 1951 to 2010 at Santa Margherita Ligure Station (not included in the map). Field capacity is 100 mm.
Land cover essentially consists of mixed and coniferous forest, transitional woodland shrubs and Mediterranean scrub, although agricultural areas such as vineyards and olive groves standing over abandoned or in use dry stone terraced systems have an important role (Paliaga et al., Citation2016; Faccini et al., Citation2018). On the top of the Promontory, eluvial ad colluvial deposits occur, while scree deposits are dominant laying over steep slopes and cliffs (Rellini et al., Citation2017; Rellini et al., Citation2019).
The geological layout of the Portofino Promontory is represented by the overlapping of the Conglomerate of Portofino on the Flysch of Mt. Antola, along an inferred contact with a dip towards SW (Giammarino et al., Citation1969; Corsi et al., Citation2001).
Flysch of Mt. Antola (Upper Cretaceous) consists of gray marly limestones and marls, with interlayers of siltstones and shales. Clay slate, calcareous sandstone, marly schist slate-like are also present but less frequent (Marini, Citation1981; Cimmino et al., Citation2004).
The Conglomerate of Portofino (Oligocene?) is a conglomerate made almost entirely of marly limestone pebbles with sizes varying from 5 to 50 cm (Paraggi Element), with interlayers of sandstone often with a lenticular trend, containing also carbon levels. Secondarily, the pebbles are of metamorphic rocks (Mt. Pollone and Mt. Bocche Element): metagranite, gneiss, schist, marble and ophiolite: the matrix is calcareous-sandstone, sometimes of quartz or clay.
On the Promontory, the conglomerate rock mass shows variable beddings: in the eastern sector the bed attitude is towards SSW, towards S in St. Fruttuoso bay, and towards SE on the western part of the studied area (Boni et al., Citation1969).
Bibliography is agreed that the conglomerate lays on the flysch with a stratigraphic discordance (Boni et al., Citation1969; Giammarino & Messiga, Citation1979). However, some new elements and observations bring to rethink the contact origin (Fanucci et al., Citation1980; Brancucci & Motta, Citation1988; Cevasco et al., Citation2004): the occurrence of plurimetric conglomeratic blocks on the promontory tops, the marked fracturing of rock mass, the presence of regional tectonic lineations, the parallelism between NW–SE and NE–SW normal faults with the inferred contact suggest that a tectonic relation among the two lithotypes is more probable as partly suggested by Giammarino et al., Citation1969.
The tectonic pattern has also influenced hydrographical stream network, coastline orientation and ridge direction along slopes and crests (Roccati et al., Citation2020).
A significant groundwater circulation is determined along the fractures of the Conglomerate, as evidenced by the numerous springs surveyed on Monte di Portofino, some of which have been tapped since historical times and are still in use nowadays as water supply for the municipal aqueducts of Santa Margherita Ligure, Portofino and Camogli.
3. Material and methods
The method adopted is schematically summarized in the flow chart in .
Figure 3. Portofino promontory land use: 11 urban fabric; 12 industrial, commercial and transport units; 14 artificial, non-agricultural vegetated areas; 22 permanent crops; 23 pastures; 24 heterogeneous agricultural areas; 31 forests; 32 shrub and/or herbaceous vegetation associations; 33 bare rock.
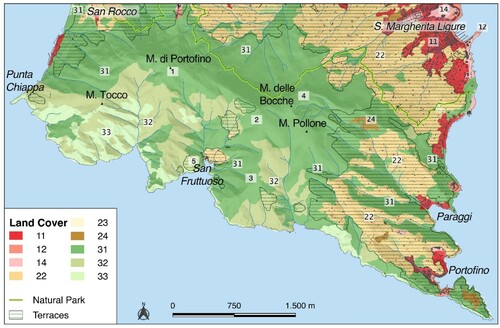
Figure 4. Workflow for the design of Groundwater Resource Map.
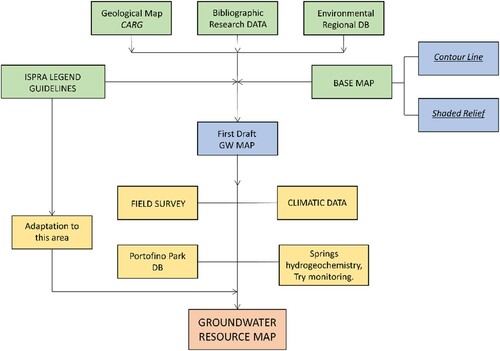
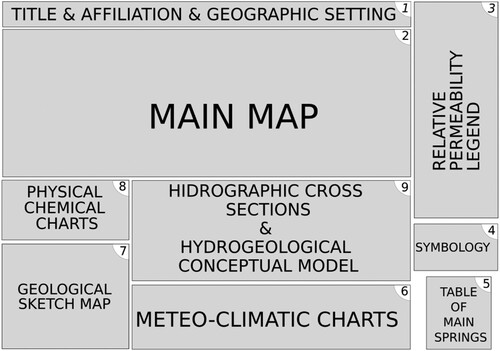
Figure 5. Schematic layout of the final map divided in 8 boxes.
At first, a careful bibliographical research of scientific papers and technical reports has been conducted (Autorità di bacino regionale, Citation2015), combined with the download of raw data from Regione Liguria Database (http://www.banchedati.ambienteinliguria.it/) for geographical, geological and land use information.
Secondly, a geological, geomorphological and hydrogeological field survey was carried out at 1:5000 scale. This allowed to assess the permeability features of the outcrops and the deposits. Then, the collection of all the conglomerate and nearby areas hydrogeological data was realized.
In order to complete the map, raster and vector data were acquired from the cartographical database of Liguria Region (https://geoportal.regione.liguria.it/). In particular, Digital Terrain Model (DTM) with a 5 m – resolution with shaded technique was combined with base features (isolines, bathymetry, tops, walkway trail, etc.) to form the base map.
The map of Groundwater Resources in a Fractured-Rock Aquifer, Conglomerate of Portofino was designed adopting the guidelines of Hydrogeological Map of Italy -1:50.000 scale (CitationISPRA, 2018), that differentiates rock masses in hydrological complexes depending on a different relative permeability degree.
Bed attitude, Contact, Inferred and Identified Faults and Terrestrial/Submarine Caves are geological features, useful to investigate the relationships between stratigraphy, morphology and water circulation as well as groundwater flow path and springs. Moreover, hydrometric station and weather station from RECONECT project (Turconi et al., Citation2020) and the Agency for Environmental Protection Liguria (ARPAL) sensors network were added. They are symbolized respectively with a graduated green–white rod and a pink reverse triangle (see Main Map).
Springs were divided in two groups, based on rate flow: 16 of them were renamed as Main Springs, while the remaining 64 are indicated as Other Springs and Submarine Springs.
As geographical feature, the entire walkway network of Portofino Natural Park was added to underline its spatial relation with the springs and evaluate the hydrogeological vulnerability, considering that some springs are used for the local water supply system.
The Main Map is accompanied by a series of inset maps, and precisely: Geological sketch map of Portofino Promontory adopting the legend of Carta Geologica Regionale at scale of 1:25,000 (Sheet Chiavari-Recco) (Dipteris, Citation2005) and the Geological Map of Chiavari (sheet 94) at scale 1:100,000 (Boni et al., Citation1969); Table of Main Springs observed on field; three maps regarding the annual water balance parameters obtained by the thermo-pluviometric data available in the area (Mean Annual Temperature of the Air, Mean Annual Precipitation, Mean Annual Effective Infiltration); a graphical representation of physical and chemical characteristics was made for 8 of the 16 Main Springs with a Piper diagram, a Temperature Chart and Eh-pH Chart (data referred to Bonaria et al., Citation2016); three Hydrographic Cross Sections of the area and the Hydrogeological Conceptual Model.
4. Groundwater resources in hard-rock aquifer
The groundwater resources map of the Conglomerate of Portofino provides a series of detailed information focusing on the hydrogeological features of rock mass and then to assess the local water cycle characteristics.
In the Main Map, four different lithotypes are present. Flysch of Mt. Antola was renamed as Marly Limestone Complex (MLC); Conglomerate of Portofino (which includes Paraggi, Mt. Pollone and Mt. Bocche lithofacies) as Conglomerate Complex (CC); Scree slopes, landslide and colluvial deposits as Slope deposits Complex (SdC) and alluvial deposits and beach sediments as Alluvial and marine deposits Complex (AmdC).
8 springs have been surveyed: 3 are located directly over the Marly Limestone Complex, 30 over the Conglomerate Complex, 43 over the Slope deposits Complex and 4 are the submerged springs.
Classifying springs by discharge rate (l/min) is also useful to visualize the groundwater outflow distribution: 64 are ephemeral springs characterized by a seasonal discharge (small pale blue circle in the Main Map); the remaining 1, defined here as ‘Main Springs’ and characterized by a perennial annual base outflow, have been classified with different symbols. Only 2 have an annual discharge value less than 1 l/min (small pale aquamarine circle in the Main Map), 6 have an interval discharge ranging from 1 to 5 l/min (meddle sized light blue circle in the Main Map). Other 6 recording values between 5 and 10 l/min are represented by a medium-sized blue circle, and the remaining 2 springs reach values higher than 10 l/min (big dark blue circle in the Main Map).
In the Table of Main Springs, it is possible to extract more specific information: the minimum mean discharge value is 0.6 l/min in the Paraggi spring, the maximum is 12.2 l/min for Nozarego spring. The highest altitude for terrestrial spring is 415 m a.s.l. for Castagna spring, whilst the lowest is 2 m a.s.l. for Scogli Grossi. Submerged springs reach a depth ranging 30–40 m below sea level and they are frequently found in the coastal area between San Fruttuoso and Cala del Prato localities.
Environmental parameters regarding 8 of the 16 are detailed in physical–chemical charts: the Mean Annual Temperature Charts of the Main Springs shows that the highest temperature is 15.7°C for San Nicolò and the lowest is 13.2°C for Caruggio with an average of 14.2°C. In the Eh-pH Charts of Main Springs, pH ranges 7.5–8.2 with an average of 7.8 and Eh has a range 298–603 mV with an average of 409.1 mV. The Piper Diagram of Main Springs shows that the Ca2+ and HCO3− are respectively the dominant cation and anion: this is a typical characteristic of bicarbonate-calcium enriched water due to the interaction between the carbonate matrix of the conglomerate and water infiltration.
The total amount of effective infiltration in the promontory has been estimated with values ranging between 200 mm/y along the coast and 700 mm/y on the peaks, as shown in the Mean Annual Precipitation Sketch Map. These data were obtained combining water balance factors expressed in the Mean Annual Temperature Sketch Map of the Air and Mean Annual Precipitation Sketch Map and adopting infiltration rate of 0.7 for Conglomerate Complex and 0.5 for Marly Limestone Complex (Thornthwaite & Mather, Citation1955).
Based on field observations, Marly Limestone Complex presents different joint sets with a millimetric to centimetric distance. Overall, it is characterized by a middle-low relative permeability degree, more permeable in the fractured marly limestone layers, almost impervious in the argillitic ones.
On the contrary, Conglomeratic Complex is characterized by a middle–high relative permeability degree with a hydraulic conductivity estimation of 10−6 m/s (Bonaria et al., Citation2016) that is comparable with similar lithologies (Cushman & Tartakovsky, Citation2017; Dewandel et al., Citation2006; Gargini et al., Citation2008).
This is due to a very marked fracturing with a Geological Strength Index rate (GSI) of rock mass equal to 65–75 (Marinos & Hoek, Citation2002) and a decametric up to metric average joint distance on the promontory top. Here, rock mass is sporadically covered by very thin weathered blankets of soil. At lower altitudes, very steep slopes are characterized by fractured rock outcrops of the marine cliffs alternating to more gentle slopes with metric debris covers.
Tectonic-origin inland caves and sea wave-excavated submerged caves are located in the central-western sector of the promontory. They are considered as pseudokarst landforms (Eberhard & Sharples, Citation2013), although an incipient karst origin is possible as shown by small fossil travertine deposits.
A peculiarity aspect of this sector is also the submerged spring’s occurrence due to SE–SW bedding direction, shown in the Hydrostratigraphic Cross Sections (section A and B).
From these elements, a groundwater circulation pathway may be drafted as it is shown in the Hydrogeological Conceptual Model. The first water-paths, flowing vertically through the weathered blankets of soil or through debris covers, can reach joints in the rock mass. The intersection between these sub-vertical cracks, the main gently dip layers and other joint sets, changes the flow path’s directions that is free to move in the rock-mass discontinuities, causing carbonate enrichment in the groundwater and dissolution of conglomerate matrix. Deeper, this significant amount of water forms a long-term ‘reservoir’ that outflows as springs feeding creeks: it is the case of Caselle Spring.
Its recharge area has a value of 1.6·105 m2 (Bonaria et al., Citation2016) as it is shown in , and feeds the Fosso di San Fruttuoso (in Italian, San Fruttuoso Creek) placed few meters below.
Figure 6. (a) Hydrogeological sketch map with Caselle spring recharge area; (b) Detailed hydrogeological cross section of the Caselle Spring recharge area; (c) Caselle Spring water balance.
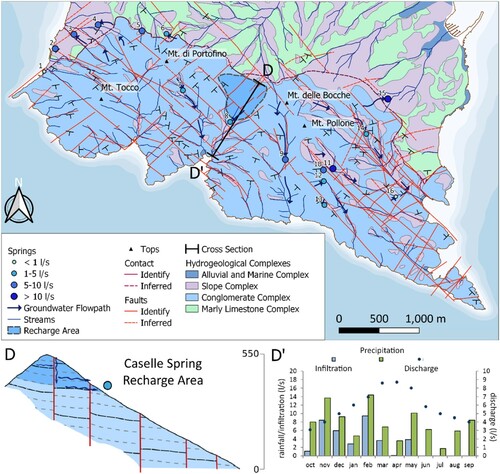
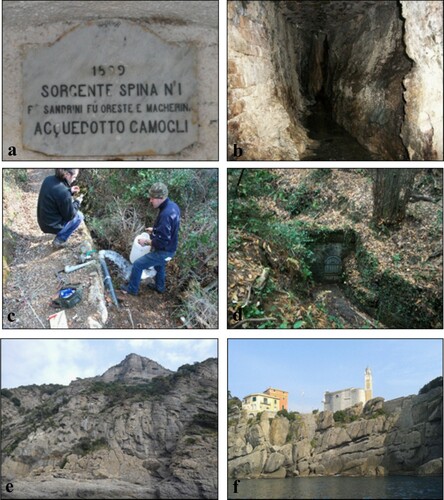
Figure 7. Photos of the springs. From left top clockwise: (a) Spina springs, not included in the list of main springs, but important as an evidence of the long history about the relation between groundwater resource and human consumption (year 1809). (b) Acquaviva, the intake is a 30 m long-gallery excavated in the Conglomerate (c) physical–chemical measurement of Caselle 2 springs, (d) photo of the gate for the gallery intake of Coppelli spring in autumn season, (e) photo from sea level depicting one of the promontory cliffs, (f) photo from sea level depicting the coast and the church of San Giorgio (Portofino). It is remarkable the SW bedding.
Another exchanging mechanism between surface and groundwater is possible. It was observed a high permeability contrast among Slope deposits Complex, (more permeable) and MLC (less permeable and impervious in some parts). This contrast does not allow a complete water infiltration in the rock mass. Therefore, most of groundwater stored in the porous body flows over the interface between SdC and MLC and directly feed small creeks in form of seepage water through the riverbed sediments or indirectly as springs.
On the contrary, if the SdC lays on the CC, the groundwater is transferred from the porous aquifer to the rock mass freely and the groundwater circulation in fractures is realized as previously discussed.
This could justify the reason why the northern part of the contact (MLC dominant) presents a high aligned springs frequency that is the result of porous aquifer – rock mass permeability contrast for springs number 4, 5, 6, 15 and for the Minor Springs.
This aligned pattern could be explained also by another hypothesis. In the Hydrostratigraphic Cross Sections, a stratigraphic contact between CC and MLC is sketched, following the bibliography and geological cross sections in Corsi, Citation2008, but recent studies and field observations are suggesting the hidden tectonic contact theory with a mylonitic patterns highly permeable that probably provide a significant amount of water in form of springs and seepage water.
For now, it is possible to describe only the SdC as porous body, and CC as fractured aquifer. MLC could be only sketched in the upper part of its aquifer: its deeper part (300 m a.s.l. and less in the Hydrostratigraphic Cross Sections) remains unknown. Moreover, the role of ductile geological features (folds) as structural controls for basal water circulation is equally undetermined.
Further research could clarify it, as the future feasibility study for the Santa Margherita Spillway and the Paraggi-Portofino micro-tunnel project. These projects will have to consider the qualitative and quantitative vulnerability of the groundwater resource; this cartography therefore could represent an useful base map for their aims.
5. Conclusions
The hydrogeological map of Portofino promontory has been obtained by collecting original data and properly organizing previous studies materials in order to provide a tool for the safeguard of groundwater resource and for its sustainable management. The peculiar geomorphology and lithology of the area request a great attention in managing groundwater resources.
The large spatial variability of precipitations, although in a limited space and mostly due to the high relief close to the sea, regulate the recharging processes of the aquifer, which plays a crucial role in local communities’ development since historical times. Nowadays groundwater continues to play a vital role as the many springs of the promontory are often used to provide fresh and good quality water in this highly visited area.
Bearing in mind climate change projection for the Central Mediterranean area, with an increase in dry days and reduction of rainy ones, such availability is more important than ever as a central element of resilience for the entire community.
Finally, the map is a significant tool consistent with the principles of the Italian legislation on water conservation (Italian Legislative Decree n 152/2006) and the realized geodatabase will be available for further implementation of new data in the future.
Software
All data processing and the entire map sheet design were performed by using the free and open source software QGIS, FREEWAT (Rossetto et al., Citation2015), a QGIS plugin for Piper Diagram and freeware Inkscape for physical–chemical charts.
Map_def.pdf
Download PDF (16.2 MB)Acknowledgements
This research was financed by Programma Operativo Regione Liguria 2014–2020 - Fondo Sociale Europeo – Asse 3 ‘Istruzione e Formazione’. RLOF18ASSRIC/60/1 ‘Tecnologie per il monitoraggio integrato e la mitigazione del rischio geomorfologico da frana nella gestione delle reti di sottoservizi’.
The authors also thank Davide Carlevaro, Silvia Fornasaro, Martina Godani, Riccardo Lazzeri, Matteo Orecchia, Matteo Raineri, Stefano Sartori, Adrian Yus for the field survey.
Disclosure statement
No potential conflict of interest was reported by the author(s).
Additional information
Funding
Related Research Data
References
- Amanti, M., Conte, G., Martarelli, L., Monti, G. M., Motteran, G., Scalise, A. R., Serafini, R., & Silvi, A. (2016). Hydrogeological map of Italy: The preliminary Sheet N. 348 Antrodoco (Central Italy). Acque Sotterranee – Italian Journal of Groundwater, 204, 17–26. https://doi.org/https://doi.org/10.7343/as-2016-204
- Autorità di bacino regionale. (2015). Piano di Bacino stralcio per l’assetto idrogeologico, Ambito 15 [Basin master plan for the geo-hydrological arrangement]. http://www.pianidibacino.ambienteinliguria.it/GE/ambito15/ambito15.html
- Bonaria, V., Faccini, F., Galiano, I. C., & Sacchini, A. (2016). Hydrogeology of conglomerate fractured-rock aquifers: An example from the Portofino’s Promontory (Italy). Rendiconti Online Società Geologica Italiana, 41, 22–25. https://doi.org/https://doi.org/10.3301/ROL.2016.83
- Boni, C. F., Bono, P., & Capelli, G. (1986a). Schema Idrogeologico dell’Italia Centrale. [Hydrogeological Scheme of Central Italy]. Memorie Della Società Geologica Italiana, 35(2), 991–1012.
- Boni, C. F., Bono, P., & Capelli, G. (1986b). Hydrogeological Map (scale 1:500.000). Memorie Della Società Geologica Italiana, 35(2).
- Boni, C. F., Bono, P., & Capelli, G. (1986c). Carta dei bilanci idrogeologici e delle risorse idriche sotterranee (scala 1:1.000.000) [Hydrogeological balance and groundwater resources map (scale 1:1.000.000)]. Memorie Della Società Geologica Italiana, 35(2).
- Boni, A., Braga, G., Conti, S., Gelati, R., Marchetti, G., & Passeri, L. D. (1969). Note illustrative della Carta Geologica d’Italia in scala 1:100’000 Foglio 83-Rapallo/Foglio 94-Chiavari. [Explanatary Notes of Italian Geological Map at scale 1:100’000 Sheet 83-Rapallo/Sheet 94-Chiavari] Servizio Geologico d’Italia., p. 89, Roma.
- Boni, C. F., Tarragoni, C., Martarelli, L., & Pierdominici, S. (2009). Studio Idrogeologico nel Settore Nord-Occidentale dei Monti Sibillini: un Contributo alla Cartografia Idrogeologica Ufficiale [Hydrogeological Study of the Monti Sibillini North-Western Sector (Central Italy): A contribution to the official hydrogeologic mapping]. Italian Journal of Engineering Geology and Environment, 1, 25–40. doi: https://doi.org/10.4408/IJEGE.2009-01.0-01
- Brancucci, G., & Motta, M. (1988). Morphoneotectonics of the Fontanabuona Valley and surrounding areas. Memorie Dell’Accademia Lunigianese Delle Scienze “G. Cappellini, 57-58, 101–122.
- Brandolini, P., Faccini, F., & Piccazzo, M. (2007a). Geomorphological hazard and tourist vulnerability along Portofino Park trails (Italy). Natural Hazards and Earth System Sciences, 6, 1–8. https://doi.org/https://doi.org/10.5194/nhess-6-563-2006
- Brandolini, P., Faccini, F., Robbiano, A., & Terranova, R. (2007b). Geomorphological hazard and monitoring activity along the western rocky coast of the Portofino Promontory (Italy). Quaternary International, 171–172, 131–142. https://doi.org/https://doi.org/10.1016/j.quaint.2006.11.006
- Celico, P. (1978). Schema Idrogeologico dell’Appennino carbonatico centro-meridionale [Hydrogeological scheme of Central-Southern Carbonatic Appenine]. Memorie e Note Dell’Istituto di Geologia Applicata di Napoli, 14, 3–97.
- Celico, P. (1983). Idrogeologia dei massicci carbonatici, delle piane quaternarie e delle aree vulcaniche dell’Italia centro-meridionale. [Hydrogeology of Central-Southern Italy carbonatic massifs, of quaternary plains and volcanic areas]. Quaderni Della Cassa per il Mezzogiorno, 4(2), Rome: 1-225.
- Cevasco, A., Faccini, F., Nosengo, S., Olivari, F., & Robbiano, A. (2004). The use of geomechanical classifications in the analysis of rock slope stability: Evaluation on the case of the Portofino Promontory (Genoa Province). GEAM, 111, 31–38.
- Chaminé, H. I. (2015). Water resources meet sustainability: New trends in environmental hydrogeology and groundwater engineering. Environmental Earth Sciences, 73(6), 2513–2520. https://doi.org/https://doi.org/10.1007/s12665-014-3986-y
- Chaminé, H. I., Carvalho, J. M., Teixeira, J., & Freitas, L. (2015). Role of hydrogeological mapping in groundwater practice: Back to basics. European Geologist. Journal of the European Federation of Geologists, 40, 34–42.
- Cimmino, F., Faccini, F., & Robbiano, A. (2004). Stones and coloured marbles of Liguria in historical monuments. Periodico di. Mineralogia, 73(3), 71–84.
- Coratza, P., Vandelli, V., Fiorentini, L., Paliaga, G., & Faccini, F. (2019). Bridging Terrestrial and Marine Geoheritage: Assessing Geosites in Portofino Natural Park (Italy). Water, 11(10), 2112. https://doi.org/https://doi.org/10.3390/w11102112
- Corsi, B. (2008). Le vie del conglomerato. Due itinerari geologici nel parco di Portofino. Guida alle escursioni. [The ways of Conglomerate. Two geological trails in the Portofino Park. Hiking Guide].Il Parco di Portofino edizioni, Santa Margherita Ligure, 114 p.
- Corsi, B., Elter, F. M., & Giammarino, S. (2001). Structural fabric of the Antola Unit (Riviera di Levante, Italy) and implications for its Alpine versus Apennine origin. Ofioliti, 26(1), 1–8. http://www.ofioliti.it/index.php/ofioliti/article/view/126
- Cushman, J., & Tartakovsky, D. (2017). The handbook of groundwater engineering. CRC Press. https://doi.org/https://doi.org/10.1201/9781315371801
- De Luca, D. A., Lasagna, M., & Bernardi, L. (2020). Hydrogeology of the western Po Plain (Piedmont, NW Italy). Journal of Maps, 16(2), 265–273. https://doi.org/https://doi.org/10.1080/17445647.2020.1738280
- Dewandel, B., Lachassagne, P., Wyns, R., Maréchal, J. C., & Krishnamurthy, N. S. (2006). A generalized 3-D geological and hydrogeological conceptual model of granite aquifers controlled by single or multiphase weathering. Journal Hydrology, 330(1–2), 260–284. https://doi.org/https://doi.org/10.1016/j.jhydrol.2006.03.026
- Dipteris. (2005). Note illustrative Foglio Chiavari. [Explanatory Notes Sheet Chiavari]. Regione Liguria https://srvcarto.regione.liguria.it/repertoriocartografico/documentazione/DOC_CGR_CHIAVARIRECCO.pdf?type=DS
- Eberhard, R., & Sharples, C. (2013). Appropriate terminology for karstlike phenomena: The problem with ‘pseudokarst’. International Journal of Speleology, 42(2), 109–113. https://doi.org/https://doi.org/10.5038/1827-806X.42.2.2
- Ercoli, A., Nafissi, P., Mercati, F., Conedera, C., Facibeni, P., Moscardi, G., Vannucci, G., Collina, R., Moscardini, R., & De Filippi, G. L. (2001). Landscape Study Portofino. Fergus Foundation, GEOMAP Srl,695, Florence, Italy.
- Faccini, F., Gabellieri, N., Paliaga, G., Piana, P., Angelini, S., & Coratza, P. (2018). The Geoheritage map of the Portofino Natural Park (Italy) as a tool for the management of a highly frequented protected area. Journal of Maps, 14(2), 87–96. https://doi.org/https://doi.org/10.1080/17445647.2018.1433561
- Faccini, F., Piccazzo, M., Robbiano, A., & Roccati, A. (2008). Applied Geomorphological Map of the Portofino municipal territory (Italy). Journal of Maps, 4(1), 451–462. https://doi.org/https://doi.org/10.4113/jom.2008.1023
- Fanucci, F., Pintus, S., Tedeschi, D., & Vignolo, A. (1980). Preliminary data on the neotectonics of Sheets 83-94 Rapallo, Chiavari. CNR Roma, 1305-1327.
- Ferrara, V., & Pappalardo, G. (2008). The hydrogeological map of the Etna volcanic massif as useful tool for groundwater resources management. International Journal for Engineering Geology and the Environment, 1, 77–89.
- Gargini, A., Vincenzi, V., Piccinini, L., Zuppi, G. M., & Canuti, P. (2008). Groundwater flow systems in turbidites of the Northern Apennines (Italy): natural discharge and high speed railway tunnel drainage. Hydrogeology Journal, 16(8), 1577–1599. https://doi.org/https://doi.org/10.1007/s10040-008-0352-8
- Giacopetti, M., Materazzi, M., Pambianchi, G., & Posavec, K. (2019). A combined approach for a modern hydrogeological mapping: The case study of Tennacola stream catchment (central Apennine, Italy). Journal of Maps, 15(2), 203–214. https://doi.org/https://doi.org/10.1080/17445647.2019.1574621
- Giammarino, S., & Messiga, B. (1979). Clasti di meta-ofioliti a paragenesi di alta pressione nel Conglomerato di Portofino: Implicazioni paleogeografiche e strutturali [Clasts of high-pressure meta-ophiolites in the Conglomerate of Portofino: Paleogeographic and structural implications]. Ofioliti, 4(1), 25–41.
- Giammarino, S., Nosengo, S., & Vannucci, G. (1969). Risultanze geologiche-paleontologiche sul Conglomerato di Portofino (Liguria Orientale). Atti Istituto di Geologia Dell’Università di Genova, 7, 305–363.
- Gössling, S. (2001). The consequences of tourism for sustainable water use on a tropical island: Zanzibar, Tanzania. Journal of Environmental Management, 61(2), 179–191. https://doi.org/https://doi.org/10.1006/jema.2000.0403
- ISPRA-Servizio Geologico d’Italia. (2018). Carta Idrogeologica d’Italia – 1:50.000. Nuove linee guida al rilevamento e alla rappresentazione della Carta Idrogeologica d’Italia. [Hydrogeological Map of Italy –1:50.000 scale. New guidelines to survey and mapping for the Hydrogeological Map of Italy]. Quaderni ISPRA-Servizio Geologico d’Italia, serie III, Vol. 14, Rome, Italy.
- Lancia, M., Su, H., Tian, Y., Xu, J., Andrews, C., Lerner, D. N. & Zheng C. (2020). Hydrogeology of the Pearl River Delta, southern China. Journal of Maps, 16:2, 388-395, https://doi.org/https://doi.org/10.1080/17445647.2020.1761903
- Lucianetti, G., Mazza, R., & Mastrorillo, L. (2019). Hydrogeology of a high Alpine carbonate aquifer (Pale di San Martino, Dolomites, Northern Italy). Journal of Maps, 15(2), 448–459. https://doi.org/https://doi.org/10.1080/17445647.2019.1611497
- Manca, F., Viaroli, S., & Mazza, R. (2017). Hydrogeology of the Sabatini Volcanic District (Central Italy). Journal of Maps, 13(2), 252–259. https://doi.org/https://doi.org/10.1080/17445647.2017.1297740
- Marini, M. (1981). Analisi geologico strutturale e interpretazione paleogeografica e tettogenetica dei Calcari di M. Antola (Appennino ligure). [Structural geology analysis and palaeogeographic and tectogenetic interpretation of Calcari di Mt. Antolaformation, Ligurian Apennines]. Ofioliti, 6, 110–150.
- Marinos, P., & Hoek, E. (2002). Estimating the geotechnical properties of heterogeneous rock masses such as flysch. Bulletin of the Engineering Geology & the Environment (IAEG), 60(85), 92. https://doi.org/https://doi.org/10.1007/s100640000090
- Martarelli, L., & Scalise, A. R. (2011). Implementation of the Italian hydrogeological cartographical guidelines (CARG Project). Società Geologica Italiana, 14, 86–93. https://doi.org/https://doi.org/10.3301/ROL.2011.08
- Paliaga, G., Giostrella, P., & Faccini, F. (2016). Terraced landscape as cultural and environmental heritage at risk: An example from Portofino Park (Italy). Annales, 26(3), 513–520. https://doi.org/https://doi.org/10.19233/ASHS.2016.32
- Paliaga, G., Luino, F., Turconi, L., De Graff, J. V., & Faccini, F. (2020). Terraced landscapes on Portofino Promontory (Italy): identification, Geo-Hydrological hazard and management. Water, 12(2), 435. https://doi.org/https://doi.org/10.3390/w12020435
- Pantaleone, D. V., Vincenzo, A., Fulvio, C., Silvia, F., Cesaria, M., Giuseppina, M., Ilaria, M., Vincenzo, P., Rosa, S. A., Gianpietro, S., Giuseppe, T., & Pietro, C. (2018). Hydrogeology of continental southern Italy. Journal of Maps, 14(2), 230–241. https://doi.org/https://doi.org/10.1080/17445647.2018.1454352
- Rellini, I., Olivari, S., Scopesi, C., & Firpo, M. (2017). The soils of the Portofino promontory (NW Italy): distribution, genesis and palaeoenvironmental implications. Geografia Fisica e Dinamica Quaternaria, 40(2), 211–232. https://doi.org/https://doi.org/10.4461/GFDQ2017.40.13
- Rellini, I., Scopesi, C., Olivari, S., Firpo, M., & Maerker, M. (2019). Assessment of soil erosion risk in a typical Mediterranean environment using a high resolution RUSLE approach (Portofino promontory, NW-Italy). Journal of Maps, 15(2), 356–362. https://doi.org/https://doi.org/10.1080/17445647.2019.1599452
- Richts, A., Struckmeier, W. F., & Zaepke, M. (2011). WHYMAP and the groundwater resources map of the world 1: 25,000,000. Sustaining Groundwater Resources, Springer. https://doi.org/https://doi.org/10.1007/978-90-481-3426-7_10
- Ristori, G. (1901). Il Conglomerato miocenico e il regime sotterraneo delle acque nel Promontorio e Monte di Portofino [The Miocene Conglomerate and groundwater system of Promontory and Mount of Portofino] (pp. 49–67).
- Roccati, A., Paliaga, G., Luino, F., Faccini, F., & Turconi, L. (2020). Rainfall threshold for shallow landslides initiation and analysis of long-term rainfall trends in a Mediterranean area. Atmosphere, 11(12), 1367. https://doi.org/https://doi.org/10.3390/atmos11121367
- Rossetto, R., Borsi, I., & Foglia, L. (2015). FREEWAT: FREE and open source software tools for water resource management. Rendiconti Online Società Geologica Italiana, 35, 252–255. https://doi.org/https://doi.org/10.3301/ROL.2015.113
- Sacchini, A., Faccini, F., Ferraris, F., Firpo, M., & Angelini, S. (2016). Large-scale landslide and deep-seated gravitational slope deformation of the Upper Scrivia Valley (Northern Apennine, Italy). Journal of Maps, 12(2), 344–358. https://doi.org/https://doi.org/10.1080/17445647.2015.1021393
- Sacchini, A., Ferraris, F., Faccini, F., & Firpo, M. (2012). Environmental climatic maps of liguria. Journal of Maps, 8(3), 199–207. https://doi.org/https://doi.org/10.1080/17445647.2012.703901
- Segadelli, S., Vescovi, P., Chelli, A., Petrella, E., De Nardo, M. T., Gargini, A., & Celico, F. (2017). Hydrogeological mapping of heterogeneous and multi-layered ophiolitic aquifers (Mountain Prinzera, northern Apennines, Italy). Journal of Maps, 13(2), 737–746. https://doi.org/https://doi.org/10.1080/17445647.2017.1376228
- Tarragoni, C., Martarelli, L., Pierdominici, S., Roma, M. F., & Boni, C. F. (2011). A proposal for compiling quantitative hydrogeological maps. Società Geologica Italiana, 14, 75–85. https://doi.org/https://doi.org/10.3301/ROL.2011.07
- Teixeira, J., Chaminé, H. I., Carvalho, J. M., Pérez-Alberti, A., & Rocha, F. (2013). Hydrogeomorphological mapping as a tool in groundwater exploitation. Journal of Maps, 9(2), 263–273. https://doi.org/https://doi.org/10.1080/17445647.2013.776506
- Thornthwaite, C. W., & Mather, J. R. (1955). The water balance. Climatology, Centerton, New Jersey, Laboratory of Climatology, 8, 1–104.
- Turconi, L., Faccini, F., Marchese, A., Paliaga, G., Casazza, M., Vojinovic, Z., & Luino, F. (2020). Implementation of nature-based solutions for hydro-meteorological risk reduction in small Mediterranean catchments: The case of Portofino Natural Regional Park. Sustainability. https://doi.org/https://doi.org/10.3390/su12031240
- Vaux, H. (2011). Groundwater under stress: The importance of management. Environmental Earth Sciences, 62(1), 19–23. https://doi.org/https://doi.org/10.1007/s12665-010-0490-x