
ABSTRACT
Since the discovery of glacial features on sub-Antarctic Marion Island, the character and extent of a historic glacial period have remained an important research focus for earth science investigations. Previous glacial reconstructions were limited to mostly pre-GPS field observations and pre-digital mapping through a Geographic Information System. With the aid of GPS field mapping, high-resolution satellite imagery and a digital surface model with a 1 × 1 m cell resolution, this paper provides a comprehensive, geo-rectified spatial geodatabase and map of Marion Island’s glacial geomorphology. The geodatabase includes an inventory of glacial erosional (e.g. striations) and depositional (e.g. moraines) features compiled from existing records as well as new features mapped from recent field observations. The final map and the geodatabase, which is downloadable as ESRI layer-package files, will aid future field investigations and modelling applications to understand Marion Island’s Quaternary landscape evolution and post-glacial ecological succession.
1. Introduction
For paleoclimate studies of the Southern Hemisphere, the sub-Antarctic Islands act as important sentinels of the nature and timing of Quaternary glaciations (e.g. CitationHodgson et al., 2014; CitationSchaefer et al., 2015). The glacial geomorphological records preserved on these islands provide valuable insights into earth systems response to hemispheric climate change (CitationHodgson et al., 2014; CitationJomelli et al., 2018; CitationRainsley et al., 2019; CitationWhite et al., 2018). At an island-scale, glacial reconstructions aid to further our understanding of local rates of ecological succession and landscape evolution (e.g. CitationHodgson et al., 2014; CitationJomelli et al., 2018; CitationRudolph et al., 2020; CitationWhite et al., 2018). Such glacial chronological studies and reconstructions rely heavily on process-form interpretation(s) and spatial representation i.e. mapping of the glacial geomorphological record (e.g. CitationBendle et al., 2017; CitationChandler et al., 2018). Sub-Antarctic Marion Island (46°54’S, 37°45’E) is one of the few islands in the southern Indian Ocean sector that can facilitate our understanding of glacial oscillations in this region (CitationBoelhouwers et al., 2008; CitationHodgson et al., 2014; CitationNel et al., 2021). As on other sub-Antarctic islands, past glaciations have had a significant influence on the evolution of Marion Island’s landscape (e.g. CitationHall et al., 2011; CitationHedding, 2008; CitationKent & Gribnitz, 1983; CitationSumner & Meiklejohn, 2004) and ecological succession (e.g. CitationChau et al., 2019; CitationMortimer et al., 2012; CitationScott, 1985; CitationScott & Hall, 1983). Although some advancement has been made towards reconstructing Marion Island’s glacial chronology (CitationRudolph et al., 2020), the spatial extent of these glacial periods remains unknown. Over the last five decades Marion Island’s glacial geomorphology has been mapped during various field campaigns (CitationNel et al., 2021), but there is a need for a comprehensive and cohesive spatial geodatabase to provide a holistic glacial reconstruction. This paper aims to provide such a glacial geomorphological map and geodatabase, which incorporate existing inventories as well as new knowledge, that can be used in future studies to reconstruct Marion Island’s Quaternary glacial and landscape history.
2. Study area and previous work
Marion Island is one of the volcanic Prince Edward Islands located in the southern Indian Ocean (). The island’s volcanic history is dominated by basaltic effusions and explosive events which can be grouped into an older sequence of Pleistocene outflows, otherwise known as the ‘grey’ lava sequence, a younger sequence of Holocene ‘black’ lava outflows, and undated scoria cones (CitationVerwoerd, 1971). The discovery of glacial striations on sub-Antarctic Marion Island during a scientific expedition in 1965 (CitationVerwoerd, 1971) provided the first evidence for former glaciations on the island. As all glacial evidence found since then only occur within the Pleistocene grey lava sequences (CitationBoelhouwers et al., 2008; CitationHall, 1978; CitationVan Zinderen Bakker, 1973), a period of glaciation is assumed to succeed (all) surficial grey lava outflows, and predate any black lava outflows or scoria eruptions (CitationMcDougall, 1971; CitationVan Zinderen Bakker, 1973; CitationVerwoerd, 1971). As such, several geomorphological studies focused on the mapping and relative-age dating of glacial erosional and depositional features found within the grey lava sequences (CitationBoelhouwers et al., 2001; CitationHall, 1978, Citation1981; CitationHedding, 2006, Citation2008; CitationSumner et al., 2002). Most maps, however, were only produced in hardcopy form and are of poor resolution due to the limited spatial resolution (quality) of the topographic and remote sensing data. These maps were based on different data sources and mapping approaches but were all dependant on field observations and aerial imagery. In many cases, the aerial imagery was obscured by cloud cover for regions such as the west coast (CitationSouth Africa, 1988) while field observations were initially limited owing to a lack of field-based research infrastructure and extensive snow cover in the Central Highland (elevations above 750 m a.s.l.) (CitationLangenegger & Verwoerd, 1971). With the advent of Global Positioning Systems (GPS), accessible satellite data and the aid of Geographic Information Systems (GIS), major improvements were made to the geological and geomorphological mapping of the island (e.g. CitationBoelhouwers et al., 2008; CitationHedding, 2006, Citation2008). In addition, the areas that could be accessed by field parties expanded over time due to the increase in personnel, infrastructural support and funding (CitationNel et al., 2021). Climate change also exposed large parts of the Central Highland ‘ice plateau’ previously covered by persistent snow and ice (CitationSumner et al., 2004). The most comprehensive glacial thematic map and inventory is that of CitationNel (2001), which was produced from the verification and expansion of previous observations (CitationHall, 1978, Citation1980) and mainly covered the eastern side of the island (except for the Central Highland), but was completed without the aid of GPS. CitationHedding (2006, Citation2008) produced a more precise map using satellite imagery and GPS, but only focussed on the newly exposed Central Highland. The aim of this paper is thus to provide a comprehensive and cohesive spatial geodatabase of glacial features compiled from existing inventories and new field observations (see Main Map), which are mapped using high-resolution satellite imagery. This geodatabase will assist future studies that aim to reconstruct the spatial and temporal variations in palaeo-ice extent as well as those assessing rates of landscape development in the newly exposed Central Highland.
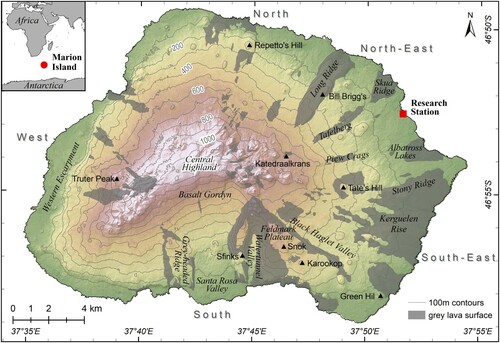
Figure 1. The location of Marion Island (inset) and the distribution of pre-glacial grey lava surfaces across the island (CitationRudolph et al., in press). Prominent landmarks, peaks (▴) and demarcation of coastal sectors are indicated, see text for details.
3. Methods
The mapping of glacial features on Marion Island was limited to the island’s grey lava outcrops and deposits. All geomorphological features that have been recorded in prior works were georeferenced and mapped, whilst generating the inventory with new field observations and interpretations from satellite imagery. Field reconnaissance took place during three field campaigns (April/May, 2017-2019; CitationRudolph, 2020) to verify the interpretations of Marion Island’s glacial geomorphology (see CitationBoelhouwers et al., 2008; CitationHall et al., 2011; CitationRudolph et al., 2020 for summaries). These interpretations followed the approaches of other palaeo-climatic and process-origin landscape reconstructions (see CitationChandler et al., 2018; CitationHedding et al., 2018). A summary of the spatial data and satellite imagery used in the mapping process is presented in .
Table 1. A summary of the data types used in the mapping processes with their specifications and creation dates.
3.1. Data and data processing
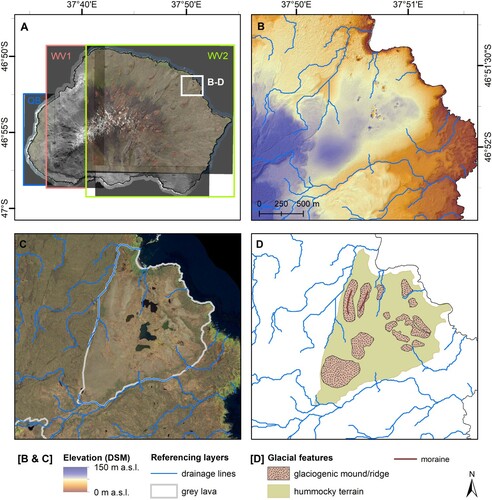
All the datasets were processed in ArcGIS® Desktop 10.6, using a Transverse Mercator projection (WGS ‘84 datum) with Longitude 37°E as the central meridian. The National Geo-spatial Information Directorate of the South African Department of Rural Development and Land Reform developed a digital surface model (DSM) in 2019 by photogrammetry using Stereo Pléiades imagery (). This DSM was used to generate a hillshade raster in ArcGIS® using the ‘Hillshade’ tool (with default parameters) (see B). Drainage lines were also generated in ArcGIS® from the DSM using the ‘Hydrology’ tool sets by first generating ‘Fill’, then ‘Flow Direction’ and then ‘Flow Accumulation’ (with a conditional >50 000 parameter) (see B). Satellite imagery from QuickBird (QB), WorldView 1 (WV1) and WorldView 2 (WV2) were imported into the GIS and georeferenced using distinct point intersections on the calculated drainage line layer (see A and B). The higher resolution WV2 panchromatic and multispectral imagery (refer to ) were primarily used during the mapping process, but it only covers approximately 65% of Marion Island (see A and C). For regions not covered by the WV2 imagery, the lower resolution images, QB and WV1 (), were consulted. The refined geology shapefiles from CitationRudolph et al. (in press) were used as a demarcation of (pre-glacial) grey lava geology (see and 2 C).
Figure 2. A comparison of the satellite imagery used in the mapping process: (A) the QuickBird (QB), WorldView 1 (WV1) and WorldView 2 (WV2) panchromatic and multispectral imagery. (B) The hillshade derived from the DSM was used to generate drainage lines (B & C) to which the satellite imagery was georeferenced. (C) The imagery, hillshade and DSM were used to identify glacial features within grey lava surfaces and to (D) map the glacial geomorphology of grey lava areas. This is an example of the hummocky terrain at Skua Ridge (refer to and ).
3.2. Mapping
A summary of all the mapped features, their morphology and the original source data as depicted in the Main Map, is presented in . Geomorphological features associated with glacial processes that have already been recorded in prior works (e.g. CitationBoelhouwers et al., 2008; CitationHall, 1978; CitationHedding, 2006, Citation2008; CitationNel, 2001; CitationVerwoerd & Langenegger, 1968) were digitised first, using the calculated hillshade and grey lava geology layer (CitationRudolph et al., in press) as the primary reference base layers ( B and C). Striations were digitised as point features by their approximate position indicated in field sketches or maps (see CitationHall, 1978; CitationNel, 2001; CitationVerwoerd & Langenegger, 1968) or from GPS coordinates (CitationHedding, 2006; CitationRudolph, 2020). The attribute data of the ‘striations’ layer include author(s), data source (i.e. map or coordinates) and the method of how the original authors determined the striation bearing (e.g. measured by compass, electronic GPS compass or inferred from an orientated arrow on a map or field sketch). Erosional features, e.g. glacial pavement or molded bedrock, and depositional features such as glaciogenic ridges / mounds described by CitationHall (1978, Citation1980, Citation1981) and CitationBoelhouwers et al. (2008) were digitised as polygons using topographical breaks visible on the hillshade layer. CitationChandler et al. (2018) and CitationHedding et al. (2018) recommend feature specific investigations to confirm process-form interpretations, especially for depositional features. For the current study, however, existing process-form interpretations (e.g. CitationBoelhouwers et al., 2008; CitationHall et al., 2011) that attribute glacial processes to the formation of depositional features (e.g. CitationHall, 1978; Citation1980; Citation1981), as opposed to volcanism (e.g. CitationKent & Gribnitz, 1983), were re-evaluated and are still accepted as correct. The altitudinal limits of the historical persistent snow extent (see CitationHall, 1978; CitationKing, 1954; CitationVerwoerd, 1971; CitationVerwoerd & Langenegger, 1968) and approximate location of the ‘ice plateau’ (see CitationHedding, 2006; CitationSumner et al., 2004; CitationVerwoerd, 1971) were also mapped as these have implications for landscape development in the Central Highland.
Table 2. A summary of the features depicted on the Main Map and their morphologies and mapping uncertainties associated with the original data sources or satellite imagery and DSM. This study has expanded on the inventory of all the features described in previous mapping campaigns.
4. Glacial geomorphology
A collation of Marion Island’s glacial geomorphological features is shown in the Main Map. Overall, nine categories of glacial geomorphological features have been identified and mapped (). Features of glacial origin are markedly more abundant on the east coast, possibly because the west coast is more volcanically active (CitationMcDougall et al., 2001; CitationVerwoerd, 1971; CitationVerwoerd et al., 1981) and recent (or post-glacial) outflows would bury any evidence of glaciation (CitationHall et al., 2011), or because the east coast is better explored than the west or south coasts. Erosional features (e.g. striations, glacial bedrock) are generally found in the Central Highland (> 900 m a.s.l.) and mid-altitude slopes (>400 m a.s.l.) of the island (CitationHall, 1978; CitationHedding, 2008; CitationNel, 2001) (see Main Map). Glacial depositional forms (e.g. glaciogenic sediments and mounds, moraines and hummocky terrain) are mostly found along the coastal plains on the east coast (Main Map). The spatial data (i.e. ESRI map layer packages and shapefiles) associated with the Main Map are available as supplementary data.
4.1. Glaciated bedrock and striations
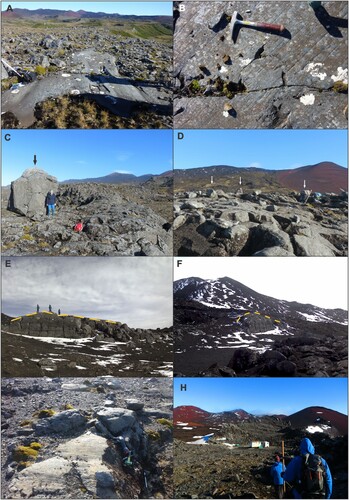
Bedrock surfaces which show evidence of glacial polishing, abrasion or plucking have been classified using a single category, ‘glaciated bedrock’ ( and Main Map). This category includes prominent rock outcrops, such as the roche moutonnées, and larger plateaus and high-lying massifs such as Tafelberg and Piew Crags, respectively ( A-D). In case of smaller features (<10 m) where individual roche moutonnées can be identified (near Truter Peak, E and F), each outcrop was mapped as a single entity. For larger topographic units with several complexes of plucked features and striated surfaces, e.g. Tafelberg, the entire plateau surface is mapped as a single unit (see Main Map and A and G). The striations found on Marion Island vary in size from a few centimetres to metres in length, but are typically no more than 1 cm wide and or 0.5 cm deep (). They usually occur on flat bedrock pavements and rounded outcrops or roche moutonnées that exhibit other signs of scouring or plucking processes ( B, D and G). The orientation of these features indicates former ice-flow direction, which on the island generally radiates coastward from the Central Highland. This is illustrated by the cartographic symbol for striations in the Main Map. Some striated features previously documented e.g. on Katedraalkrans, north of Black Haglet Valley, or near Albatross Lakes (see CitationHall, 1978), could not be verified during recent field visits (see CitationRudolph, 2020) and have thus not been included in the map. Erratics are found mostly on the east coast and vary in size from less than a metre to larger than three metres, and commonly occur on some of the glaciated outcrops ( C and D). Due to their abundance, however, these features were not explicitly mapped.
Figure 3. Examples of erosional features found on Marion Island. On the Tafelberg complex one can find (A) a glaciated bedrock pavement partly covered with erratics and till material; (B) striations and glacial polishing. (C) A large erratic as found on the glaciated outcrop, Piew Crags, and (D) several scattered erratics (white arrows) on glacially moulded and striated bedrock of Tafelberg. (E and F) Different aspects of the same roche moutonnee on the western side of the island, near Truter Peak (G) Glacial abrasions and plucking on Tafelberg. (F) Katedraalkrans as an example of an outcrop where no striations have been found but it exhibits severe dilatation fracturing. Refer to and the Main Map for place names.
4.2. Glaciogenic sediments, mounds and ridges
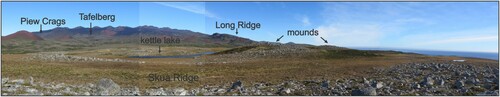
Grey lava surfaces at lower altitudes predominantly consist of glaciogenic deposits comprises clast shapes that vary between angular, sub-angular plates to rounded boulders of <1 m to >2 m in size (CitationBoelhouwers et al., 2008; CitationHall, 1978; CitationNel, 2001; CitationSumner et al., 2002). CitationHall (1978, Citation1981) initiated an extensive megaclast fabric analysis of coastal deposits (i.e. glaciogenic sediments or tills) (e.g. Skua Ridge, Albatross Lakes) and the general direction of ice flow, as interpreted from this analysis, is indicated on the Main Map. This analysis, however, did not comprise all of the glaciogenic depositional units, for example on Long Ridge, Stony Ridge or Kerguelen Rise. For this reason, a broad classification of ‘glaciogenic sediments’ is used to describe all the depositional elements attributed to a glaciogenic origin (see and Main Map). Those sediment deposits that have positive relief profiles but lack a distinct crest which is more commonly associated with moraines, are classified as ‘glaciogenic mounds and ridges’. These ‘mounds and ridges’ vary in shape – some are conical, or asymmetrical, while others are longitudinal or crescent-shaped (Main Map). These features also vary in size from a few metres to over a kilometre long, and from 1 m to over 20 m in height (). Examples of ridges typically include Kerguelen Rise and Stony Ridge, which are mostly associated with lateral ice margins (CitationHall et al., 2011; CitationRudolph, 2020), whereas mounds are commonly found on hummocky terrain, for example on Skua Ridge () or Albatross Lakes (Main Map).
Figure 4. A panorama taken from the hummocky terrain at Skua Ridge, looking towards the interior of the island. Major landmarks and other glaciogenic features, such as mounds, are indicated. Refer to for place names and for an indication of how this region was mapped.
4.3. Moraines
In this paper, ‘moraines’ are strictly defined as depositional elements with distinct positive relief on which large (∼1-3 m) boulders have been deposited and still remain in the landscape today (). The boulders typically lie in a linear fashion on the crest of glaciogenic sediments, for example on either side of the Watertunnel Valley or on the Feldmark Plateau in-land of Karookop ( and Main Map). The mapped moraines also include features found on the top of high-lying massifs such Long Ridge or Grey-headed Ridge ( and Main Map). These features are clearly identifiable from the hillshade and satellite imagery and are typically associated the marginal boundaries of palaeo-ice extent (see and 6).
Figure 5. (A) The U-shaped trough of the Watertunnel Valley, looking northwards from the bottom end of the valley. (B) On the Feldmark Plateau, a (terminal) moraine found inland of Karoo Kop is associated with a cirque near Snok (double arrows indicate north). (C) The hillshade and DSM of the Feldmark Plateau and Watertunnel Valley (inset shows the location on an island scale). The perspectives of photos in A and B are indicated by black arrows and the location of the hanging valley near Watertunnel Valley are shown. The mapping symbology used for line symbols on the Main Map is presented. See text for details and for places names.
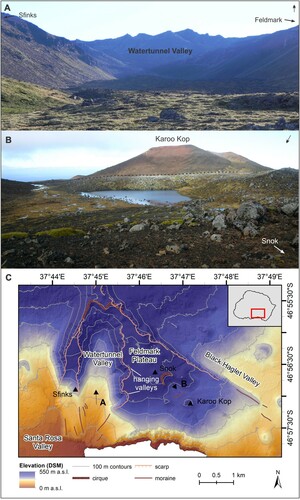
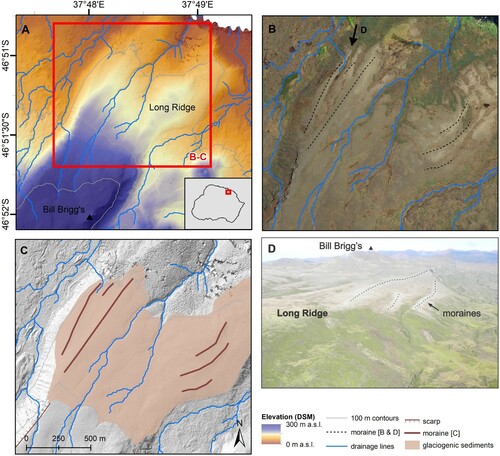
Figure 6. (A) The hillshade and DSM used for mapping the lower reaches of Long Ridge (inset shows the location on an island scale). (B) The WV2 satellite imagery and the moraines identified on the flanks of Long Ridge. The black arrow indicated the perspective of the photograph in D. (C) The geomorphological mapping symbols used for moraines, glaciogenic sediments and scarp features, here overlain on the hillshade. (D) A field photograph of the moraines on the north western flank of Long Ridge.
4.4. Hummocky terrain
Hummocky terrain describes a glacial geomorphic unit that consists of glaciogenic sediments that are deposited in a chaotic fashion exhibiting an undulating topography with kettle lakes and asymmetrical mounds (CitationBendle et al., 2017; CitationSingh et al., 2011) (). On Marion Island, this class includes Skua Ridge and Albatross Lakes, both of which comprise well-vegetated slopes with a positive relief of over 5 m with boulders of various sizes and platy clasts scattered across the ridges and mounds (). On Skua Ridge, the ‘disintegration ridges’ and ‘push moraines’ described by CitationHall (1978, Citation1980) are difficult to delineate from the high-resolution DSM ( B). Similarly, at Albatross Lakes, the hillshade does not distinctly highlight all the terminal moraines identified by CitationHall (1978). Instead, the DSM and hillshade show a series of mounds and depressions, i.e. hummocky terrain related to former zones of stagnant ice, with a few moraines ridges that may indicate the extent of former ice advance(s) (CitationBendle et al., 2017; CitationSingh et al., 2011) (see and 4 and the Main Map).
4.5. Cirques, glacial troughs and scarps
Future reconstructions of the island’s glacial history will continue to rely heavily on the remnants of grey lava outcrops, ridges or scarps, which have not (notably) been affected by post-glacial volcanism. It is, therefore, worth mapping the most distinct scarps or cliffs that can be interpreted as cirques, headwalls, sidewalls or glacial troughs in an attempt to reconstruct palae-glacial basins (). The Watertunnel Valley on the south coast, has a distinct cirque wall and U-shaped valley that can easily be delineated from the DSM and satellite imagery ( A and Main Map). Along the eastern flank of the valley (towards the Feldmark Plateau), two (side) valleys can be found which may be considered hanging valleys, since their floors do not meet the main valley floor ( C). The scarps of Santa Rosa Valley, Black Haglet Valley (Feldmark Plateau), Piew Crags, Tafelberg and Long Ridge are distinct walls that would have, for example, acted as marginal barriers during glacial periods (Main Map). A few smaller cirques are also delineated in the Central Highland (CitationHedding, 2008), and one specifically on the south eastern reaches of the Feldmark Plateau below the scoria cone Snok (CitationBoelhouwers et al., 2008) ( B and C, Main Map). These features collectively will provide the needed framework to reconstruct glacial basins, determine accumulation areas ratios and investigate the probability of the existence of niche glaciers during interglacial periods (CitationBoelhouwers et al., 2008).
4.6. Dilatation outcrops
Some high-lying grey lava outcrops, e.g. Katedraalkrans, a grey lava sliver in the Basalt Gordyn (∼750 m a.s.l.) and the northern reaches of Feldmark Plateau, exhibit an abundance of fractured bedrock material associated with severe dilatation fracturing (see H). The origin of the material is ascribed to joint unloading, as the outcrops provide no other direct evidence of glacial action (CitationMcDougall et al., 2001). Still, glacial unloading is not entirely dismissed as the process-origin (see CitationHall et al., 2011; CitationRudolph et al., 2020), but currently these outcrops are mapped as dilatation outcrops (Main Map and ). Evidence such as a block stream documented on the middle section Long Ridge (CitationSumner & Meiklejohn, 2004) and the size and abundance of well-developed periglacial features on Feldmark Plateau (CitationBoelhouwers et al., 2008; CitationNel, 2001); have led to the hypothesis that these regions have been ice-free for much longer than the surrounding areas (CitationRudolph et al., 2020). The interpretation of these ‘ice-free’ areas is supported by the general absence of other glacial landforms as can be seen in the Main Map.
4.7. Historical snow limits and the ‘ice plateau’
The term ‘ice plateau’ was used to refer to an ice cap that was ∼50 m thick in the mid-1950s (CitationKing, 1954; CitationRand, 1954) which today has all but disappeared revealing a relatively small valley basin with an outlet to the north-west (CitationHedding, 2008; CitationSumner et al., 2004). Permanent (persistent) snow extended down to 600 m a.s.l. at the time of the first scientific surveys (CitationKing, 1954; CitationVerwoerd & Langenegger, 1968) and had retreated to above 950 m a.s.l. by 1970 (CitationHall, 1980; CitationVerwoerd, 1971). The ‘ice plateau’ was traditionally interpreted to be the remnants of the Last Glacial Maximum, ∼ 20 000 years ago (CitationVerwoerd, 1971), however, new evidence suggests a much earlier deglaciation (>35 000 years ago) for the island (CitationRudolph et al., 2020). Still, historical snow and ice limits are important considerations for Martion Island’s more recent landscape development, as is shown quite clearly by the remarkable absence of periglacial fetaures in the Central Highland above 950 m a.s.l. (CitationHedding, 2008; CitationSumner et al., 2004). Understanding the island’s response to contemporary climate change will serve as a baseline for interpreting landscape-climate interactions, such as equilibrium line altitudes and ablation rates througout the Quaternary.
5. Conclusion
The glacial geomorphology of Marion Island is mapped from high-resolution satellite imagery onto a digital surface model (DSM) with a 1 × 1 m cell resolution. Satellite imagery was used to digitise and georeference existing records of the island’s glacial geomorphology, as well as map new glacial evidence found within the island’s grey lava sequences. Nine categories of landforms are mapped, which includes glacial depositional and erosional features, historical snow limits and the extent of the former ‘ice plateau’ as well as regions associated with dilatation fracturing. For future glacial reconstructive studies, the depositional features found predominantly on the east coast can be used to interpret the terminal and lateral extent of palaeo-ice extent. Whereas erosional features and till fabric analysis will assist in interpretations of past glacial flow directions. Other features such as scarps or cirques and ice-free regions will especially aid future studies to reconstruct palaeo-glacial basins or to model accumulation area ratios. In conjunction with this, mapping historical snow limits can allow for a better understanding of landscape-climate interactions and aid in modelling past equilibrium line altitudes or ablation potential. The limited spatial extent of (pre-glacial) grey lava surfaces that remain exposed on the south- and north-west coast, pose a significant limitation for mapping, but the inclusion of periglacial features to future mapping campaigns will aid in a holistic reconstruction of Marion Island’s Quaternary landscape evolution.
Data
The authors have supplied the data used in the production of the accompanying map as ESRI layer-package files.
Software
The mapping and image processing have been completed using ESRI ArcGIS Desktop 10.6.
Supplemental Material
Download Zip (257.3 KB)MarionIsland_glacialgeomorphology_MainMap.pdf
Download PDF (31.1 MB)Acknowledgements
The authors would like to thank the South African National Antarctic Programme and the Department of Environmental Affairs / Environment, Forestry and Fisheries for their logistical support, and the South African National Research Foundation for financial support throughout this study.
Disclosure statement
No potential conflict of interest was reported by the author(s).
Additional information
Funding
Related Research Data
References
- Bendle, J. M., Thorndycraft, V. R., & Palmer, A. P. (2017). The glacial geomorphology of the Lago Buenos Aires and Lago Pueyrredón ice lobes of Central Patagonia. Journal of Maps, 13(2), 654–673. https://doi.org/https://doi.org/10.1080/17445647.2017.1351908
- Boelhouwers, J. C., Holness, S., Sumner, P. D., & Nel, W. (2001). Cryogenic Landforms and Processes on Marion Island. Final report submitted to the South African Committee for Antarctic Research (SACAR), April 1996-March 2001.
- Boelhouwers, J. C., Meiklejohn, K. I., Holness, S., & Hedding, D. W. (2008). Geology, geomorphology and climate change. In S. L. Chown, & P. W. Froneman (Eds.), The Prince Edward Islands: Land-Sea interactions in a changing ecosystem (pp. 65–96). SUN PRESS.
- Chandler, B. M. P., Lovell, H., Boston, C. M., Lukas, S., Barr, I. D., Benediktsson, ÍÖ, Benn, D. I., Clark, C. D., Darvill, C. M., Evans, D. J. A., Ewertowski, M. W., Loibl, D., Margold, M., Otto, J. C., Roberts, D. H., Stokes, C. R., Storrar, R. D., & Stroeven, A. P. (2018). Glacial geomorphological mapping: A review of approaches and frameworks for best practice. Earth-Science Reviews, 185, 806–846. https://doi.org/https://doi.org/10.1016/j.earscirev.2018.07.015
- Chau, J. H., Born, C., McGeoch, M. A., Bergstrom, D., Shaw, J., Terauds, A., Mairal, M., Le Roux, J., & Jansen van Vuuren, B. (2019). The influence of landscape, climate, and history on spatial genetic patterns in keystone plants (Azorella) on sub-Antarctic islands. Molecular Ecology, 28(14), #15147. https://doi.org/https://doi.org/10.1111/mec.15147
- Hall, K. (1978). Quaternary glacial geology of Marion Island. PhD Thesis. University of the Orange Free State, Bloemfontein, South Africa.
- Hall, K. (1980). Late glacial ice cover and palaeotemperatures on sub-Antarctic Marion Island. Palaeogeography, Palaeoclimatology, Palaeoecology, 29, 243–259. https://doi.org/https://doi.org/10.1016/0031-0182(79)90084-1
- Hall, K. (1981). Quantitative analysis of till lithology on Marion Island. South African Journal of Science, 77(2), 86–90.
- Hall, K., Meiklejohn, K. I., & Bumby, A. (2011). Marion Island volcanism and glaciation. Antarctic Science, 23(2), 155–163. https://doi.org/https://doi.org/10.1017/S0954102010000878
- Hedding, D. W. (2006). Geomorphology and geomorphological responses to climate change in the interior of sub-Antarctic Marion Island. MSc Dissertation. University of Pretoria, Pretoria, South Africa.
- Hedding, D. W. (2008). Spatial inventory of landforms in the recently exposed Central Highland of sub-Antarctic Marion island. South African Geographical Journal, 90(1), 11–21. https://doi.org/https://doi.org/10.1080/03736245.2008.9725307
- Hedding, D. W., Brook, M. S., & Winkler, S. (2018). Old landscapes, new eyes: Revisiting geomorphological research in the Southern Alps of New Zealand. New Zealand Geographer, 74(2), 109–112. https://doi.org/https://doi.org/10.1111/nzg.12189
- Hodgson, D. A., Graham, A. G. C., Roberts, S. J., Bentley, M. J., Cofaigh, Ó, Verleyen, C., Vyverman, E., Jomelli, W., Favier, V., Brunstein, V., Verfaillie, D., Colhoun, D., Saunders, E. A., Selkirk, K. M., Mackintosh, P. M., Hedding, A., Nel, D. W., Hall, W., McGlone, K., … A, J. (2014). Terrestrial and submarine evidence for the extent and timing of the Last Glacial Maximum and the onset of deglaciation on the maritime-Antarctic and sub-Antarctic islands. Quaternary Science Reviews, 100, 137–158. https://doi.org/https://doi.org/10.1016/j.quascirev.2013.12.001
- Jomelli, V., Schimmelpfennig, I., Favier, V., Mokadem, F., Landais, A., Rinterknecht, V., Brunstein, D., Verfaillie, D., Legentil, C., Aumaitre, G., Bourlès, D. L., & Keddadouche, K. (2018). Glacier extent in sub-Antarctic Kerguelen archipelago from MIS 3 period: Evidence from 36Cl dating. Quaternary Science Reviews, 183, 110–123. https://doi.org/https://doi.org/10.1016/j.quascirev.2018.01.008
- Kent, L., & Gribnitz, K. H. (1983). Problematic Quaternary successions on Marion Island: Volcanogenic or glaciogenic. South African Journal of Antarctic Research, 13, 15–23.
- King, J. A. (1954). Marion Island. Lantern, April, 433–440.
- Langenegger, O., & Verwoerd, W. J. (1971). Topographic survey. In E. M. Van Zinderen Bakker, J. M. Winterbottom, & R. A. Dyer (Eds.), Marion and Prince Edward Islands: report on the South African biological and geological research expedition 1965-1966 (pp. 32–39). A.A. Balkema.
- McDougall, I. (1971). Geochronology. In E. M. Van Zinderen Bakker, J. M. Winterbottom, & R. A. Dyer (Eds.), Marion and Prince Edward Islands: report on the South African biological and geological research expedition 1965-1966 (pp. 74–77). A. A. Balkema.
- McDougall, I., Verwoerd, W. J., & Chevallier, L. (2001). K–Ar geochronology of Marion Island, Southern Ocean. Geological Magazine, 138(1), 1–17. https://doi.org/https://doi.org/10.1017/S0016756801005039
- Mortimer, E., van Vuuren, J., Meiklejohn, B., & Chown, K. I., & L, S. (2012). Phylogeography of a mite, Halozetes fulvus, reflects the landscape history of a young volcanic island in the sub-Antarctic. Biological Journal of the Linnean Society, 105(1), 131–145. https://doi.org/https://doi.org/10.1111/j.1095-8312.2011.01770.x
- Nel, W. (2001). A spatial inventory of glacial, periglacial and rapid mass movement forms on part of Marion Island: Implications for Quaternary environmental change. MSc Dissertation. University of Pretoria, Pretoria, South Africa.
- Nel, W., Boelhouwers, J. C., Borg, C. J., Cotrina, J., Hansen, C. D., Haussmann, N. S., Hedding, D. W., Nguna, A. A., Meiklejohn, K. I., Rudolph, E. M., Sinuka, S. S., & Sumner, P. D. (2021). Earth science research on Marion Island (1996-2020): A synthesis and new findings. South African Geographical Journal, 103(1), 22–42. https://doi.org/https://doi.org/10.1080/03736245.2020.1786445
- Rainsley, E., Turney, C. S. M., Golledge, N. R., Wilmshurst, J. M., McGlone, M. S., Hogg, A. G., Li, B., Thomas, Z. A., Roberts, R., Jones, R. T., Palmer, J. G., Flett, V., De Wet, G., Hutchinson, D. K., Lipson, M. J., Fenwick, P., Hines, B., Binetti, U., & Fogwill, C. J. (2019). Pleistocene glacial history of the New Zealand subantarctic islands. Climate of the Past, 15(2), 423–448. https://doi.org/https://doi.org/10.5194/cp-15-423-2019
- Rand, R. (1954). Notes on the birds of Marion Island. The Ibis, 96(2), 173–206. https://doi.org/https://doi.org/10.1111/j.1474-919X.1954.tb04125.x
- Rudolph, E. M. (2020). Towards reconstructing Marion Island’s glacial history. PhD Thesis. University of Fort Hare, Alice, South Africa.
- Rudolph, E. M., Hedding, D. W., Fabel, D., Hodgson, D. A., Gheorghiu, D. M., Shanks, R., & Nel, W. (2020). Early glacial maximum and deglaciation at sub-Antarctic Marion Island from cosmogenic 36Cl exposure dating. Quaternary Science Reviews, 231, 106208. https://doi.org/https://doi.org/10.1016/j.quascirev.2020.106208
- Rudolph, E. M., Hedding, D. W., & Nel, W. (2020). The surface geology of the Prince Edward Islands: Refined spatial data and call for geoconservation. South African Journal of Geology. https://doi.org/https://doi.org/10.25131/sajg.124.0014. (in press).
- Schaefer, J. M., Putnam, A. E., Denton, G. H., Kaplan, M. R., Birkel, S., Doughty, A. M., Kelley, S., Barrell, D. J. A., Finkel, R. C., Winckler, G., Anderson, R. F., Ninneman, U. S., Barker, S., Schwartz, R., Andersen, B. G., & Schluechter, C. (2015). The Southern Glacial Maximum 65,000 years ago and its unfinished termination. Quaternary Science Reviews, 114, 52–60. https://doi.org/https://doi.org/10.1016/j.quascirev.2015.02.009
- Scott, L. (1985). Palynological indications of the Quaternary vegetation history of Marion Island (Sub-Antarctic). Journal of Biogeography, 12(5), 413–431. https://doi.org/https://doi.org/10.2307/2844951
- Scott, L., & Hall, K. (1983). Palynological evidence for interglacial vegetation cover on Marion Island, Subantarctic. Palaeogeography, Palaeoclimatology, Palaeoecology, 41(1-2), 35–43. https://doi.org/https://doi.org/10.1016/0031-0182(83)90074-3
- Singh, V. P., Singh, P., & Haritashya, U. K. (2011). Encyclopedia of snow, ice and glaciers. Encyclopedia of earth sciences (Vol. 53). Springer.
- South Africa. (1988). Royal Air Force, 13 April 1961. Flight no. 870/9, Strip 1: 6986-7010; Strip 2: 7025-7039; Strip 4: 7135-7109; Strip 5: 7162-7172; Strip 6: 7194-7228; Strip 7: 7240-7254; Strip 9: 7309, 7311.
- Sumner, P. D., & Meiklejohn, K. I. (2004). On the development of autochthonous blockfields in the grey basalts of Subantarctic Marion Island. Polar Geography, 28(2), 120–132. https://doi.org/https://doi.org/10.1080/789610121
- Sumner, P. D., Meiklejohn, K. I., Boelhouwers, J. C., & Hedding, D. W. (2004). Climate change melts Marion Island’s snow and ice. South African Journal of Science, 100(7), 395–398.
- Sumner, P. D., Nel, W., Holness, S., & Boelhouwers, J. C. (2002). Rock weathering characteristics as relative-age indicators for glacial and post-glacial landforms on Marion Island. South African Geographical Journal, 84(2), 153–157. https://doi.org/https://doi.org/10.1080/03736245.2002.9713766
- Van Zinderen Bakker, E. M., Sr. (1973). The glaciation(s) of Marion Island (sub-Antarctic). In E. M. van Zinderen Bakker, Sr. (Ed.), Palaeoecology of Africa and the surrounding islands and Antarctica (Vol. 8, pp. 161–178). A. A. Balkema.
- Verwoerd, W. J. (1971). Geology. In E. M. Van Zinderen Bakker, Sr., J. M. Winterbottom, & R. A. Dyer (Eds.), Marion and Prince Edward Islands: report on the South African biological and geological research expedition 1965-1966 (pp. 40–62). A. A. Balkema.
- Verwoerd, W. J., & Langenegger, O. (1968). Volcanological map of Marion Island. Pretoria.
- Verwoerd, W. J., Russell, S., & Berruti, A. (1981). 1980 volcanic eruption reported on Marion Island. Earth and Planetary Science Letters, 54(1), 153–156. https://doi.org/https://doi.org/10.1016/0012-821X(81)90076-5
- White, D. A., Bennike, O., Melles, M., Berg, S., & Binnie, S. A. (2018). Was South Georgia covered by an ice cap during the Last Glacial maximum? In M. Siegert, S. Jamieson, & D. White (Eds.), Exploration of subsurface Antarctica: Uncovering past changes and modern processes (Vol. 461, pp. 49–59). Geological Society, Special Publications.