
ABSTRACT
Although mapping long-term scenarios can be considered crucial in decision-making, its inclusion in planning processes remains a challenge. This paper aims to gain insights into this by showing a participatory mapping method that creates a dialogue and interaction space between stakeholders and experts. The research was based on three 2050 visions, taking as a case study the eastern sector of the metropolitan area of Madrid, Spain. The method consisted of conducting a participatory mapping workshop involving urban planners, transport engineers, environmental consultants, and property developers. Those experts mapped transformations in urban land use for each 2050 scenario. The results evidenced differences between the three 2050 scenarios, highlighting the usefulness of the participatory mapping workshop to represent the amount and nature of growth in urban land use and organisation of the transport network.
1. Introduction
Urbanisation is the most dramatic form of land transformation (CitationLi et al., Citation2018), a phenomenon that has witnessed a spiralling increase in recent decades (CitationBettencourt & West, Citation2010; CitationUstaoglu et al., Citation2017). It is estimated that 68.4% of the world’s population will live in urban areas by 2050 (CitationWorld Urbanization Prospects, Citation2018), duplicating urban areas in developed countries and tripling it in developing countries (CitationUN-Habitat, 2018). This rapid urbanisation, often unplanned, brings major social impacts and environmental degradation (CitationChen, Citation2007; CitationZhou & Wang, Citation2011). Moreover, the distribution of urban land uses condition significantly the transport system (CitationWegener & Fuerst, Citation2004). In order to properly manage urban areas, more strategic future planning approaches are needed (e.g. visioning, scenario planning, project design, simulation models).
The strong two-way relationship between urban land use and transport (CitationWegener, Citation2004) has prompted a growing interest in strategic future planning instruments that effectively integrate both aspects (CitationBrömmelstroet & Bertolini, Citation2010; CitationMiller, Citation2018). The scenario planning is a case in point (CitationBörjeson et al., Citation2006), which refers to a series of social science methods aimed at depicting possible disruptive future scenarios with respect to business-as-usual (BAU) (Citationvan der Heijden, Citation2000). Disruptions refer to low probability process and events with high impacts in population lifestyles. Such disruptions can be positive and negative effects for society, but in all cases alter linearity and BAU trends. Thus, enabling planners to anticipate and manage a wide number of future options during decision-making processes. In other words, planners and stakeholders would be able to formulate policy options for unexpected future scenarios, designing appropriate strategies to enhance or correct the resulting scenarios effects (CitationAkerman & Höjer, Citation2006; CitationBanister et al., Citation2000; CitationLyons & Davidson, Citation2016).
To imagine different future situations with respect to BAU, it is important to include divergent elements in the design in order to generate more disruptive scenarios (CitationSoria-Lara & Banister, Citation2018), identified through participatory processes (CitationJunghans et al., Citation2018). This can facilitate outside-the-box thinking, enriching the visioning process and giving rise to more disruptive scenarios (CitationSaritas & Smith, Citation2011).
However, conventional research outcomes from the abovementioned scenario planning process in urban land use and transport planning are mainly descriptions or explanations (e.g. narratives) of possible future trends, focused on understanding the potential impacts of strategic futures on cities and their transport systems. Therefore, new thinking is required to engage decision-makers, planners, businesses and people in formulating practical and implementable policy options based on long-term scenarios, especially when these are highly disruptive. Consequently, this process must be combined with new collaborative mapping techniques (CitationCaquard & Cartwright, Citation2014) in order to foster interactive working environments to support urban policy-making and to establish meeting-point where stakeholders involved in planning can discuss to find win-win solutions (CitationArranz-López et al., Citation2017). Thus, scenario planning requires the involvement of people with a sufficiently expert knowledge of urban systems (urban planners, transport engineers, environmental consultants, and property developers) to be able to identify characteristics of the scenarios and provide a more accurate spatial representation (CitationLarondelle et al., Citation2016). Furthermore, it is required to design activities that facilitate radical transformation of urban areas. Most previous studies have addressed this aspect using traditional drawing and mapping techniques (CitationGoodier & Soetanto, Citation2013; CitationSchoemaker, Citation1995), and have not included a comprehensive spatialisation process.
To address the abovementioned issues, the aim of the present study focuses on generating maps of disruptive future scenarios related to changes in urban land use and mobility patterns, enabling different types of stakeholder to tackle the planning world through effective and creative spatial ideas. For this purpose, we conducted a participatory mapping workshop to spatialise the characteristics of three disruptive 2050 scenarios, using a sector of the metropolitan area of Madrid (the Henares Corridor, Spain) as case study. A total of 18 experts were involved in the experiential workshop, covering professional fields (urban planning, transport, environment, mobility, public health, etc.). Their experience and capacity to analyse and assess, together with the design of the workshop exercises and activities, enabled them to represent urban land use changes in the Corridor of Henares for three different scenarios.
This article is organised as follows: (1) introduction; (2) case study characteristics; (3) design and mapping disruptive future scenarios (processing baseline data to create a base map, implementation of a participatory mapping workshop and scenario construction); and (4) final conclusions.
2. Case study and future visions
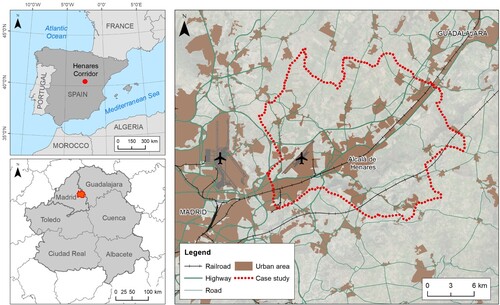
The case study comprised a sector of the Henares Corridor (), an urban-industrial place located in the metropolitan area of Madrid, with a population of 417,773 inhabitants (CitationNational Statistics Institute, Citation2018). The corridor is organised along major transport infrastructures, and serves as a connection route between the two most important metropolitan areas in Spain: Madrid and Barcelona. This circumstance has led to remarkable urban and industrial growth which was especially marked in the late twentieth century (CitationRodríguez-Espinosa et al., Citation2020). Over the last 30 years, the area has witnessed an annual urban growth rate of 3.4%, with a higher rate in single-family homes (4.21%) than in industrial land use (2.92%) due to productive restructuring and stagnation in the secondary sector.
Figure 1. Case study.
Considering the context described above and as a pre-research stage (CitationSoria-Lara et al., Citation2021), we conducted a visioning process that resulted in the generation of three future visions for a 2050 horizon (CitationAriza-Álvarez et al., Citation2021). These visions contributed to generating exploratory scenarios, which allowed to anticipate and examine different assumptions over a long-term future, supporting strategic decision-making in the case study. To this aim, we employed a participatory process that involved conducting semi-structured interviews with 129 residents and commuters, exploring aspects related to transport and urban land uses of the case study. Below, we summarise the three visions that would disrupt BAU projections, used to stimulate an alternative thinking and interrupt the linearity of the process, increasing options to explore imaginable or unimaginable futures (CitationSoria-Lara et al., Citation2021):
Non-motorized city centres (1). The 2050 vision is fundamentally based on the full restriction of private vehicles access to city centres. All public space in city centres is recovered for active mobility and for the creation of socialisation spaces. This shift would initiate a change in the modal split, increasing walking and cycling levels to all daily destinations. There would be a preference for cities offering a high mix of residential, shopping, leisure, and working places, reduce the distances between those activities and foster active mobility patterns. As a result, working places (currently located in the city’s periphery) would be transformed into more mixed-use areas. A dense network of green corridors will connect different places of the case study, including the city centre and the periphery. Public transport stations would be located in the periphery and tightly integrated with green corridors facilitating multimodality.
Overpopulation (2). Under conditions of drastic overpopulation, the vision of 2050 would show changes in modal split patterns. This would increase use of collective modes for work commuting and increased walking and cycling rates to shopping and leisure locations. Car ownerships rates would decrease in favour of a generalisation of car-sharing habits. There would be a preference from high-income families to live in the city periphery and in low density places, but with a high mix land use. Consequently, current work areas (located in the city’s periphery) would be transformed into more multifunctional areas. On the other hand, low-income families would prefer to live in high-density areas in city centres. A dense green network of corridors would connect different places along the case study, with strong integration with public transport stations fostering multimodality.
High level of insecurity in urban areas (3). The 2050 vision is strongly affected by a high level of insecurity in urban areas as a consequence of increasing social inequalities. Walking and cycling are not advisable in this context. Under these conditions, the modal split would be drastically altered, with the private car dominating all daily trips. Nevertheless, there would be also preferences for increasing the level of car sharing. Public green areas would be removed and recovered for car infrastructures. There would be a preference by high-income families for living in the city periphery in private communities. In this respect, urban land uses would be highly segregated in homogenous areas connected by motorised infrastructure. City centres would be mainly transformed into work destinations, with most employees commuting from the city’s periphery. Low-income families would also tend to live in those insecure city centres.
3. Mapping disruptive future scenarios
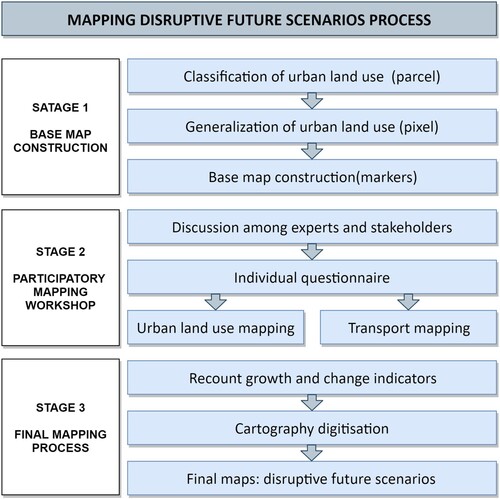
shows a diagram of the stages employed in processing the baseline visions and subsequent mapping through scenario planning: (1) processing of cadastral information to construct a base map (2018) to use during the experiential workshop; (2) implementation of participatory mapping workshop with experts to map changes in urban land use and transport associated with each of the three scenarios; and (3) incorporation of the workshop results in a Geographic Information System (GIS) to obtain final maps of the future scenarios (2050).
Figure 2. Flowchart of mapping disruptive future scenarios process.
3.1. Base MAP construction: PARCEL, PIXEL and markers
In order to develop more refined techniques of facilitation and support for planning groups, we decided to generate a map that was used as a basis for interaction between experts of the abovementioned workshop. Given the characteristics of the scenarios, the map needed to include the different densities and types of building together with the existence of residential, industrial, commercial and utilities or mixed uses. Therefore, we used cadastral information from the Cadastre of Spain (https://www.sedecatastro.gob.es/) to represent urban land uses. This choice was made on two basic considerations as follow.
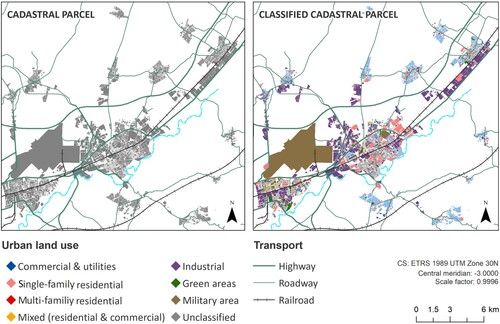
First, the information on each cadastral parcel includes building type (e.g. multi-family dwellings, single-family dwellings, mixed use buildings, commercial building, markets, religious buildings, warehouses, etc.), rendering it possible to determine the degree of mixed uses in each parcel and therefore the existence of mixed, residential or industrial uses. Second, the information also includes the number of buildings in each parcel, rendering it possible to distinguish those with a higher density of residential use (multi-family dwellings) from those with lower densities (single-family dwellings). However, in order to obtain these data, it was necessary to pre-process the information, determining the degree to which each type of building predominated in each parcel and assigning each cadastral parcel the urban land use indicated in .
Figure 3. Basic cadastral information (left) and classification by urban land use (right).
Due to the complexity of mapping disruptive future scenarios, which in some cases might entail major changes in urban land uses, we ruled out manual mapping of future urban land use distribution. Earlier pilot experiments had indicated that this approach only yielded representations of new urban growth, but not modifications to or loss of pre-existing uses. To solve this, we devised a system of representing urban land uses using different coloured markers () for each current urban land use. These could be easily moved by workshop experts to represent urban land use changes, new growth, etc.
Figure 4. Photographs of the dynamic system of changing urban land uses by using markers.
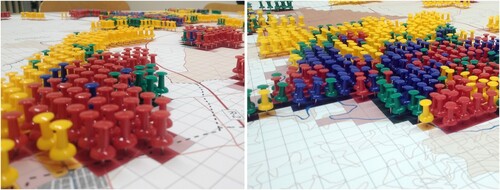
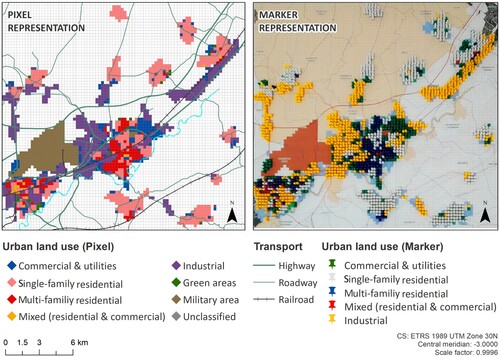
To show uses with these markers, we designed a vector grid with cells representing a real area of 250 × 250 m, a sufficiently large size to accommodate a marker on the map. Each grid element was assigned the most representative urban land use in each cell according to the total number of parcels per pixel for each category and placing the marker corresponding to each category ().
Figure 5. Urban land uses representation by pixels (left) and markers (right).
3.2. Participatory mapping workshop
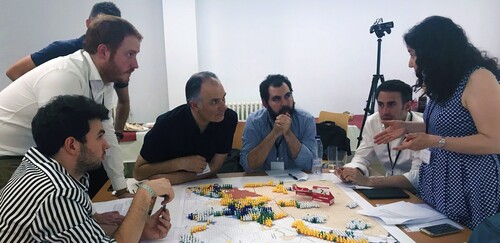
The participatory mapping workshop was attended by 18 experts in urban planning and transport. To encourage experts’ interaction and a diversity of perspectives (CitationJunghans et al., Citation2018), three groups were established (one per scenario) with six experts, ensuring the right variability between professional domains. This variety of perspectives attempts to offer a more complex dialogue, encompassing all potential factors involved in the evolution of urban areas. Considering the existing profiles, each group was organised with at least one expert from each field of interest (urban planners, transport planners, environmental consultants, and property developers). shows a group of experts mapping one of the three scenarios during the workshop.
Figure 6. Photograph taken during the participatory mapping workshop: sharing and discussion among the experts and stakeholders. Note: All participants signed a consent form to make public information for research purposes. Such concerns were aligned and approved by social science ethical commission from the institutions involved in the research.
During the first part of the workshop, we administered a questionnaire to define the spatial characteristics of each scenario. Participants openly discussed potential answers, according to their area of expertise. After discussion, each expert individually filled out the following issues in the questionnaire:
amount of growth/decline in each urban land use, which ultimately determines the number of markers to be added or removed from the map;
most relevant transport mode, determining the collective draw of infrastructures;
existence of green areas, which would indicate whether new green spaces or corridors will be designed;
level of land uses mix, which would indicate whether the markers are placed next to the same or different colours (urban land use);
urban sprawl level, which would signal whether the added markers (urban growth) are placed scattered or compact.
shows the results for scenario characterisation based on the information obtained from the questionnaires where they scored on a 5-point Likert scale.
Table 1. Characteristics of the future scenarios as a result of the first part of the workshop.
The second part of the workshop consisted of two activities conducted in parallel: urban land uses reconfiguration and infrastructures/corridor design. The first was deployment of the markers to represent urban land uses. According to the amount of change in each use determined in the first part, each group was told how many markers to add to the map (growth) or subtract from it (loss). Similarly, according to the degree of dispersion and mixed uses identified in the first part, experts were told to modify urban land use distribution by moving the markers to better represent the future scenario.
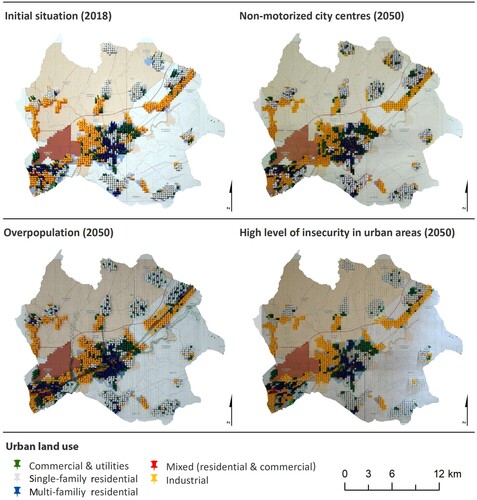
The second activity consisted of drawing the transport network and green infrastructures, as being the easiest and most effective technique to indicate the location of new roads, green corridors and train/bus stations, etc. As a result of both activities, we obtained three maps showing the urban land use distribution in each scenario and changes in the transport network and green infrastructures in the case study ().
Figure 7. Outcomes of the participatory mapping workshop.
3.3. Mapping disruptive future scenarios of urban land use and transport
The maps generated in the workshop were digitised by reversing the pixel to parcel conversion process (similar to that described in section 3.1) and incorporating the information into GIS software. This yielded a more detailed representation of each scenario by parcel.
Broadly speaking, industrial areas are generally located close to existing ones, with no expected growth. In the high level of insecurity in urban areas scenario, clustering patterns of urban land use are observed, especially in single-family residential and commercial pre-existing areas, while in the overpopulation scenario the mix of residential and commercial built-up areas is more pronounced. Below, we describe in detail the results of the three scenarios:
In the Non-motorized city centres scenario, experts indicated that services and utilities infrastructures would experience significant growth (229.68 ha), while the industrial sector would remain stable. The case study would be structured around a network of green spaces linking the urban centres, without any significant changes to the road network. There would be an increase in mixed land uses, with more mixed building (6.65 ha) and multi-family residential (70.70 ha) and a slight loss of single-family residential compared with earlier trends.
In the case of the overpopulation scenario, the hub of the metropolitan corridor would be transformed into a network of interconnected green spaces, with high growth in single-family residential (730.43 ha) on the periphery coupled with growth in commerce and utilities (359.80 ha). To a lesser extent, there would be an increase in multi-family residential (221.75 ha) to accommodate the significant population intensification, and in mixed building (63.24 ha). As regards transport, new high occupancy routes would be designed with intermodal hubs (train and bus stations), and some stops in intermodal stations would change.
Lastly, in the High level of insecurity in urban areas scenario, high levels of citizen insecurity would lead to the disappearance of green spaces and a slight loss of industrial land use. As a consequence of significant growth in single-family residential (789.38 ha) on the periphery and higher segregation of uses, there would be an increase in the use of private vehicles. At the same time, a deterioration in public transport would occur. The transport network would undergo considerable remodelling, with new roads to meet the requirements of residents on the periphery and greater use of private vehicles.
4. Conclusions
The present study meets the challenge of spatially representing 2050 disruptive future scenarios generated through a scenario planning process. To this end, we used a participatory mapping workshop with planners and other experts working in the fields of transport and city environments (transport engineers, environmental consultants, property developers, etc.), taking into account different points of view. The results showed that the workshop activities had generated detailed maps of three disruptive future scenarios, thus furthering integration of the tasks entailed in the management of urban areas. The maps were generated in an intuitive and user-friendly language for urban planning, suitable for professional domains and researchers from several fields. This would enable the exchange of ideas to enhance urban management policies, in contrast to the exclusive use of narratives, which are more abstract and difficult to understand for some of the potential stakeholders involved.
We employed the participatory mapping workshop rather than other Public Participation Geographic Information Systems (PPGIS) techniques such as representation using web mapping applications (CitationRzeszewski & Kotus, Citation2019), thus allowing simultaneous dialogue between experts and face-to-face communication as interact with urban land uses maps.
Within PPGIS context, all phases are considered important in urban planning (CitationBrown, Citation2015), from local people's involvement in the elaboration of narratives, to expert collaboration in the urban land uses and transport mapping. In addition, a validation of future disruptive scenarios will be carried out by the same experts in a GIS environment, considering future simulations. In that light, the proposed methodology could improve PPGIS application for facing urban planning by making existing tools more efficient, instead of looking for new management tools (CitationKahila-Tani, Citation2015).
The resulting maps captured possible outside-the-box future scenarios for use as a final product in scenario-based decision-making (CitationBrail, Citation2008). Similarly, they rendered it possible to analyse aspects such as segregated vs mixed uses, urban sprawl, modes of transport, etc., and provided a more-effective method for the design of sustainable policy packages tailored to each scenario (CitationSoria-Lara & Banister, Citation2018). Furthermore, this methods might be useful as an adjunct to simulation models (CitationGuan et al., Citation2011), as they could be used to test model calibration when simulating these scenarios. In any of these cases, they would also contribute to planning anticipatory measures (CitationAnderson, Citation2010). Nevertheless, further research is required in relation to application of this method at different scales or using 3D, where the models can reproduce simulation results as close to the real-life as possible.
SOFTWARE
The maps presented were drafted with ArcMap 10.6. The final maps were created with ArcMap 10.6 and Adobe Illustrator CS4. The horizontal urban profiles were built with AutoCAD 2020.
Main maps joined
Download PDF (42.4 MB)Main map - Scenario 2
Download PDF (10.2 MB)Main map - Scenario 1
Download PDF (10.5 MB)Main map - Initial situation
Download PDF (13.7 MB)Acknowledgements
This research was performed within the context of TRANSURBAN project (Simulation of collaborative scenarios to integrate sustainable transport and land use policies), funded by the Spanish Ministry of Economy and Competitiveness (CSO2017-86914-C2-1-P) and the research program ‘Estímulo a la Excelencia para Profesores Universitarios Permanentes’ funded by University of Alcalá and the Community of Madrid (EPU-INV/2020/009). The first author is also grateful for the help provided by the State Programme for the Promotion of Talent and its Employability in R&D (PRE2018-084663), funded by the Ministry of Science, Innovation and Universities and European Social Found. Finally, the author(s) would like to thank Julia Clemente Párraga for the computer support provided in programming tasks, the members of the TRANS-URBAN project for making the workshop possible and the reviewers for their useful comments.
Disclosure statement
No potential conflict of interest was reported by the author(s).
Additional information
Funding
Related Research Data
References
- Akerman, J., & Höjer, M. (2006). How much transport can the climate stand?—Sweden on a sustainable path in 2050. Energy Policy, 34(14), 1944–1957. https://doi.org/10.1016/j.enpol.2005.02.009
- Anderson, B. (2010). Preemption, precaution, preparedness: Anticipatory action and future geographies. Progress in Human Geography, 34(6), 777–798. https://doi.org/10.1177/0309132510362600
- Ariza-Álvarez, A., Soria-Lara, J. A., Arce-Ruiz, R. M., López-Lambas, M. E., & Jimenez-Espada, M. (2021). Experimenting with scenario-building narratives to integrate land use and transport. Transport Policy, 101, 57–70. https://doi.org/10.1016/j.tranpol.2020.11.012
- Arranz-López, A., Soria-Lara, J. A., López-Escolano, C., & Pueyo Campos, Á. (2017). Making ‘retail mobility environments’ visible for collaborative transport planning. Journal of Maps, 13(1), 90–100. https://doi.org/10.1080/17445647.2017.1383945
- Banister, D., Dreborg, K., Hedberg, L., Hunhammar, S., Steen, P., & Åkerman, J. (2000). Transport policy scenarios for the EU: 2020 images of the future. Innovation, 13(1), 27–45. https://doi.org/10.1080/135116100111649
- Bettencourt, L., & West, G. (2010). A unified theory of urban living. Nature, 467(7318), 912–913. https://doi.org/10.1038/467912a
- Börjeson, L., Höjer, M., Dreborg, K. H., Ekvall, T., & Finnveden, G. (2006). Scenario types and techniques: Towards a user’s guide. Futures, 38(7), 723–739. https://doi.org/10.1016/j.futures.2005.12.002
- Brail, R. K. (2008). Planning support systems for cities and regions. In R. K. Brail (Ed.), Lincoln Institute of Land policy. Lincoln Institute of Land Policy. http://link.springer.com/10.1007/978-0-387-35973-1_990
- Brömmelstroet, M. T., & Bertolini, L. (2010). Integrating land use and transport knowledge in strategy-making. Transportation, 37(1), 85–104. https://doi.org/10.1007/s11116-009-9221-0
- Brown, G. (2015). Engaging the wisdom of crowds and public judgement for land use planning using public participation geographic information systems. Australian Planner, 52(3), 199–209. https://doi.org/10.1080/07293682.2015.1034147
- Caquard, S., & Cartwright, W. (2014). Narrative cartography: From mapping stories to the narrative of maps and mapping. Cartographic Journal, 51(2), 101–106. https://doi.org/10.1179/0008704114Z.000000000130
- Chen, J. (2007). Rapid urbanization in China: A real challenge to soil protection and food security. CATENA, 69(1), 1–15. https://doi.org/10.1016/j.catena.2006.04.019
- Goodier, C. I., & Soetanto, R. (2013). Building future scenarios using cognitive mapping. Journal of Maps, 9(2), 203–217. https://doi.org/10.1080/17445647.2013.770997
- Guan, D., Li, H., Inohae, T., Su, W., Nagaie, T., & Hokao, K. (2011). Modeling urban land use change by the integration of cellular automaton and markov model. Ecological Modelling, 222(20-22), 3761–3772. https://doi.org/10.1016/j.ecolmodel.2011.09.009
- Junghans, L., Kreft, S., & Welp, M. (2018). Inclusive visions for urban transitions: Lessons from stakeholder dialogues in asian medium sized cities. Sustainable Cities and Society, 42(February 2017), 512–520. https://doi.org/10.1016/j.scs.2018.08.003
- Kahila-Tani, M. (2015). Reshaping the planning process using local experiences: Utilising PPGIS in participatory urban planning. (Doctoral dissertation, Aalto University, Helsinki, Finland). Retrieved from http://urn.fi/URN:ISBN:978-952-60-6604-2
- Larondelle, N., Frantzeskaki, N., & Haase, D. (2016). Mapping transition potential with stakeholder- and policy-driven scenarios in rotterdam city. Ecological Indicators, 70, 630–643. https://doi.org/10.1016/j.ecolind.2016.02.028
- Li, C., Li, J., & Wu, J. (2018). What drives urban growth in China? A multi-scale comparative analysis. Applied Geography, 98(June), 43–51. https://doi.org/10.1016/j.apgeog.2018.07.002
- Lyons, G., & Davidson, C. (2016). Guidance for transport planning and policymaking in the face of an uncertain future. Transportation Research Part A: Policy and Practice, 88, 104–116. https://doi.org/10.1016/j.tra.2016.03.012
- Miller, E. J. (2018). The case for microsimulation frameworks for integrated urban models. Journal of Transport and Land Use, 11(1), 1025–1037. https://doi.org/10.5198/jtlu.2018.1257
- National Statistics Institute. (2018). Spanish Statistical Office. https://www.ine.es/
- Rodríguez-Espinosa, V. M., Aguilera-Benavente, F., & Gómez-Delgado, M. (2020). Green infrastructure design using GIS and spatial analysis: A proposal for the Henares Corridor (Madrid-guadalajara, Spain). Landscape Research, 45(1), 26–43. https://doi.org/10.1080/01426397.2019.1569221
- Rzeszewski, M., & Kotus, J. (2019). Usability and usefulness of internet mapping platforms in participatory spatial planning. Applied Geography, 103, 56–69. https://doi.org/10.1016/j.apgeog.2019.01.001
- Saritas, O., & Smith, J. E. (2011). The Big picture – trends, drivers, wild cards, discontinuities and weak signals. Futures, 43(3), 292–312. https://doi.org/10.1016/j.futures.2010.11.007
- Schoemaker, P. J. H. (1995). Scenario planning: A tool for strategic thinking. MIT Sloan Management Review, 36, 25–40. http://mitsmr.com/1nJI6Qi
- Soria-Lara, J. A., Ariza-Álvarez, A., Aguilera-Benavente, F., Cascajo, R., Arce-Ruiz, R. M., López, C., & Gómez-Delgado, M. (2021). Participatory visioning for building disruptive future scenarios for transport and land use planning. Journal of Transport Geography, 90(December 2019), https://doi.org/10.1016/j.jtrangeo.2020.102907
- Soria-Lara, J. A., & Banister, D. (2018). Collaborative backcasting for transport policy scenario building. Futures, 95, 11–21. https://doi.org/10.1016/j.futures.2017.09.003
- UN-Habitat. (2018). Human Settlements Programme. United Nations. https://unhabitat.org/
- Ustaoglu, E., Williams, B., & Petrov, L. O. (2017). Scenario analysis of alternative land development patterns for the Leipzig-halle region: Implications for transport-land-use sustainability. Urban Planning, 2(1), 108–129. https://doi.org/10.17645/up.v2i1.838
- van der Heijden, K. (2000). Scenarios and forecasting. Technological Forecasting and Social Change, 65(1), 31–36. https://doi.org/10.1016/S0040-1625(99)00121-3
- Wegener, M. (2004). Overview of land Use transport models. In D. A. Hensher, K. J. Button, K. E. Haynes, & P. R. Stopher (Eds.), Handbook of transport Geography and spatial systems (emerald (pp. 127–146). Emerald Group Publishing Limited. https://doi.org/10.1108/9781615832538-010
- Wegener, M., & Fuerst, F. (2004). Land-Use transport interaction: State of the Art. SSRN Electronic Journal, November, 1–119. https://doi.org/10.2139/ssrn.1434678
- World Urbanization Prospects. (2018). Department of Economic and Social Affairs. United Nations. https://population.un.org/wup/
- Zhou, X., & Wang, Y.-C. (2011). Spatial–temporal dynamics of urban green space in response to rapid urbanization and greening policies. Landscape and Urban Planning, 100(3), 268–277. https://doi.org/10.1016/j.landurbplan.2010.12.013