
ABSTRACT
The paper investigates if and where registered crime and the fear of crime intersect in the four locations. This information is important to reduce crime and increase the sense of security of the population. In the past, research was applied to small parts of a city or a whole city, but not in as much detail as this paper. Our research is detailed, and at the same time is applied to four entire locations - three Czech cities (Ostrava, Olomouc, and Kolín) and one Prague district (Prague 12). We placed registered crime and fear of crime on one map to show locations where people feel afraid, where crime happens, and where both events occur together. We drew these phenomena using Moran’s I in a bivariate map. The outputs will be applied by Municipal governments and police departments.
1. Introduction
Almost every place evokes a feeling or an emotion. Some places can be attractive, pleasant, boring, dangerous, or even frightening simultaneously, depending on the observer. Our research question asks what the actual crime rate is (in our case, we only have data concerning registered crime) in these places and whether the public’s fear and discomfort are justified or just based on negative emotions and the history of a place. The genius loci can be the result of a neglected environment or dramatic information presented by local media. Comparing fear of crime with crime statistics is usually a question for sociologists, urban planners and city municipalities because fear of crime affects the quality of life (CitationAdams & Serpe, Citation2000). Security and safety were already identified as basic needs in Maslow’s Hierarchy of Needs (CitationMaslow, Citation1943). Fear of crime can affect everyday behaviour; hence, it can decrease the quality of life in general (CitationBurke et al., Citation2009; CitationO’Campo et al., Citation2009; CitationVilalta, Citation2011). As geographers, we investigate the spatial context by asking the question ‘Are citizens afraid of places where crime is actually registered’?
The phenomenon of Fear of Crime became prominent in the research carried out by the Chicago School in the 1920s and 1930s. This was followed by ‘Second Chicago School’ in the 1960s (CitationFine, Citation1995). Fear of crime is often understood to be a negative emotional reaction demonstrated as fear of criminality (CitationFerraro, Citation1995) or victimisation (CitationGarofalo, Citation1979). Fear of crime does not affect all members of society equally. It has been reported that it limits the lives of women more than men (CitationHille, Citation1999), mainly due to their fear and/or inability to defend themselves (Pain, Citation1997) although some feminist geographers state that men just hide their fear better (CitationPain, Citation1991). Fear of crime is a challenging theme to place on a map because it is a subjective emotion that is difficult to measure (CitationCurtis, Citation2012; CitationCurtis et al., Citation2014), and every form of research uses its own methods and techniques although mapping crime is a much older discipline carried out for almost two hundred years (CitationDent, Citation2000). The spatial connection between fear of crime and registered crime has only been studied in more detail recently in a few studies (CitationLopez & Lukinbeal, Citation2010; CitationPánek et al., Citation2019). In geographic information systems (GIS), we have tools that can be useful in analysing the spatial connection between registered crime and fear of crime. Several studies use bivariate maps to compare fear with the crime itself (CitationKhananayev, Citation2016), or they combine hotspots kernel density for crime and hatched polygons for localities with fear of crime (Doran et al., Citation2012). More studies focus on small urban localities, such as parks, university campuses (CitationFuhrmann et al., Citation2013), tiny parts of a city or interesting places, such as the surroundings of the new Öresund bridge (which, from 2000 connects Sweden and Denmark) (CitationCeccato & Haining, 2004). However, in our study, we focus on three cities and one borough of the capital city Prague. Previous studies combining fear and crime have only asked about fear as such (answers like I'm afraid here, I'm not afraid here). These findings inspired us that the study itself could be extended with specific fear (car, harassment) combined with comparable types of the committed crime. In addition these studies informed us about potential unpleasant urban locations and social aspects that can have a negative impact on living in every city globally.
A combination of two Moran’s I in a bivariate map can produce special outputs with huge information about different fear of crime and registered crime types. A bivariate map is a cartographic tool that allows showing a spatial connection between two or more variables on a single map. Each variable has its own colour scale displayed like a choropleth map or cartogram.
2. Case study
2.1. Study area
We chose four locations involved in wider research collaboration with our team regarding crime mapping for this research. They are Ostrava, the third-largest city in the Czech Republic, with a rich industrial history and almost 300,000 citizens; Olomouc, a historic university city with 100,000 citizens; Kolín, with 31,000 citizens, and Prague 12, a borough of the capital city with a large housing estate, with 56,000 citizens (Czech Statistical Office, Citation2016).
Every city has its own problematic areas and problems, such as social exclusion and fear of crime, that affect the quality of life of the population in different ways. Based on the document Strategy for the Integration of the Roma Community of the Moravian-Silesian Region for 2015–2020, there are 15 socially excluded localities in Ostrava. Also it is a polycentric industrial city with a significant population growth in the 1950s and 1980s, and today it is suffering from depopulation. Olomouc is a historic university city with a delimited city centre.According to citizens’ feelings and previous emotional mapping research (CitationPánek, Citation2019) in Olomouc, the most problematic place is the main train station. Kolín is a small city where City Council successfully reduced crime by 56% over three years (2014–2016) due to the Safe Kolín initiative. The project was based on detailed crime mapping and the reinforcement of police officers in selected locations. Prague 12 is a peripheral part of the capital with a significant traffic load (transit and parking). It consists of several large housing estates, car parks and a large forest park. Many commuters to Prague use car parks in this city.
After analysing our study area, we found that in all cities there are similar types of locations that attract crime and the fear of crime. These are the surroundings of train stations’, city transport hubs, bus stops in excluded localities near city centres, places near nightclubs and bars, and shopping centres.
2.2. Data
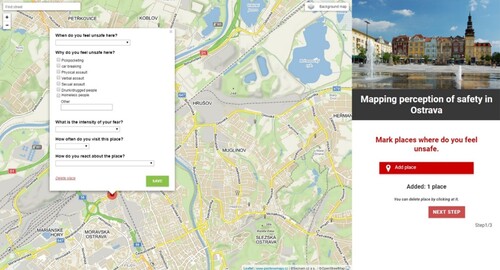
Data regarding the fear of crime were collected through a participatory mapping online questionnaire (). The questionnaire was promoted on public transport, through municipalities’ social networks, by local media and police departments and universities in Olomouc and Ostrava. Participation in the survey was voluntary and anonymous. A total of 2955 respondents took part in the research, who marked 6448 points on the map where they did not feel safe. In addition to localisation of places, they answered a few questions regarding their feelings and behaviour here (a detailed analysis of the questionnaire and statistical results can be found in CitationPánek et al., Citation2019). In Ostrava people marked 3767 points, in Olomouc, there were 1589 points, and in Kolín, there were 574 points, and Prague 12 had 457 points. The second part of the questionnaire was related to demographic information about the respondents and where they lived. Gender distribution has a slightly higher proportion of women. Due to the chosen mapping platform, the younger part of the population is more involved than the real age structure of the population (see Supplementary Material, Tables 1 and 2).
Figure 1. The example of a participatory mapping application used for data collection.
The registered crime statistics are from the Police Presidium of the Czech Republic as geotagged crime events from January 2015 to September 2018. The crime data include geometric representation (point), timestamp, and category. We have selected categories of crimes that can be compared with the types of fear expressed in the questionnaire and which were recommended by the Police Presidium. The types were violent crime; burglary; and theft from a person. Registered crime data in such detail had never been provided by the Police in the Czech Republic prior to this research; and the crime data available freely to public are only as aggregated to larger polygon areas.
3. Methods
To answer our research question, we first computed the correlations between fear of crime and registered crime for our four studied locations. Based on these correlations, we have chosen combinations that could indicate the spatial dependence of these phenomena. Duranton and Overman’s Kd functions were then used on the point data to find a point’s neighbour at a given distance (CitationKukuliac & Horak, Citation2017). These functions show a statistically significant attraction of the two monitored phenomena in space; otherwise, there is a statistically significant repulsion. All this is measured for a defined benchmark distribution and always for the observed phenomena.
Based on previously computed correlations and Duranton and Overman’s Kd function, we chose combinations of fear of crime and registered crime with the best results from these calculations. Both point data sources were managed in two hexagon fishnets, where one hexagon contains the number of all registered crimes or points marked by respondents in the participatory mapping. Hexagons are often used as the optimal shape for delimiting urban areas (CitationBurian et al., Citation2014), and they are also referred to in ecological modelling (CitationBirch et al., Citation2007) and self-organising maps (CitationJiang & Harrie, Citation2004). Hexagonal overlays have an advantage over traditional square grids because they enable the nearest neighbourhood analysis, which is simpler and has fewer ambiguous results (CitationPánek et al., Citation2020). Hexagons have a shorter perimeter than a square of equal area; hence, this reduces bias caused by edge effects (CitationKrebs, Citation1989). The hexagon sides were set at 40 m after the deployment of the sensitivity analysis, which compared Moran’s I for hexagon sides from 20 to 120 m with 20 m steps (CitationPánek et al., Citation2019).
On both fishnets, we computed Moran’s I and we combined the fishnets in one bivariate map. The main map shows hexagons in shades of green, where registered crimes occurred, but people were not afraid there. Furthermore, it shows in hexagons shaded blue the places where fear of crime existed, but no crimes were registered there. Using red hexagons, we highlighted the localities where registered crime and fear of crime were mapped.
3.1. The main map
The main map shows four combinations of different types of fear of crime and various registered crimes in the four locations of our research. In addition to red hexagons, we consider the adjacent blue and green hexagons to be a combination of fear of crime and registered crime. Crime, similarly to other social phenomena, is not randomly distributed but spatially clustered and spatial dependent. The dependence is measured as spatial autocorrelation, which is basically computed and formalised by Tobler’s First Law of Geography (CitationLeitner et al., Citation2021).
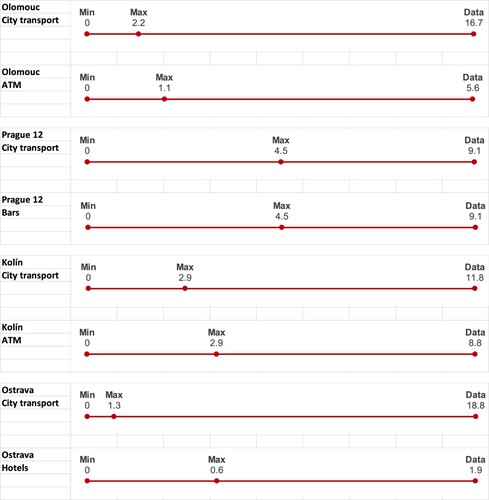
We realised that some places, such as bus and tram stops and ATMs, experience both phenomena more than other places. So, we decided to confirm our investigations and determine whether this was by chance or otherwise. From a hexagon network that covers the entire city, we randomly selected the same number of hexagons as the amount of intersected Points of Interests (POIs) type was a thousand times to find how many POIs of the selected category would intersect these hexagons. Then we made a numerical axis for numbers such as minimum and maximum for random data and the number of points in real data. shows these numerical axes for four cities and two types of POIs where no random results were the most significant. We found that all types of POIs in all localities are not in the red hexagons by chance. Public transport, in particular, is abundantly represented in the red hexagons in all localities.
Figure 2. Minimum, maximum and the real number of POIs in red hexagons.
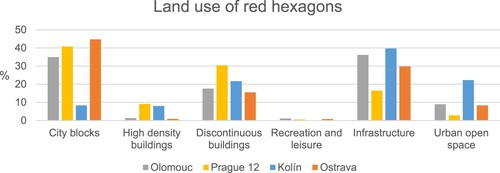
For more complex information about the red hexagons, we used the Urban Atlas database to find which types of land use were contained in the hexagons. The results are shown on column charts with the percentages of the land use categories and details on building density. We chose the categories, city blocks, high density buildings, discontinuous buildings, recreation and leisure infrastructure, and urban open space. shows that registered crime and fear of crime mainly occurred within city blocks and around the recreation and leisure infrastructure. The exception is Kolín, which has a higher percentage of red hexagons containing urban open space and a smaller percentage within the city blocks. This may be explained by the fact that Kolín is a very small city with smaller city blocks than the bigger cities of Ostrava and Olomouc. Prague 12 has a higher percentage of red hexagons with discontinuous buildings, and this is caused by large housing estates.
Figure 3. Land use in combined Moran’s I clusters (high-high clusters).
The specific topics covered in each city were selected to represent the ‘typical’ safety issues in our studied locations. Of course, one could select different registered crime categories and different fear of crime categories to highlight different locations, but as this is not a paper about fear of crime/registered crime micro-locations, we expect that a variety of categories is welcomed.
4. Results
4.1. Olomouc
In Olomouc, we focused on violent crimes and fear of sexual harassment. The first location where registered crime and fear of crime intersect is near the underpass leading to the main bus station on Ostravská street. On this street, there are bars, a small casino and a pawnshop. However, there is no crime in the surroundings of the main bus station, only fear of sexual harassment. Registered crime and fear of sexual harassment also occurred at the main train station. In Olomouc, the main train station is the most marked place where people feel uncomfortable. People feel fear of sexual harassment in the park Bezručovy sady, but there is no crime at all. The same situation exists in the other parks: Smetanovy sady and Čechovy sady. Violent crimes happen around the whole city centre, mainly around Uhelná street, with bars and pubs and an old city market. People are justified in feeling fear in Biskupské square, where there are often homeless people.
4.2. Prague 12
The map window of Prague 12 compares car thefts and fear of crime in general for the same reason as in Kolín. In Prague 12, registered crime occurs on Kabeláčova street, where there is a high concentration of parking places for the adjacent large blocks of prefabricated buildings. Hence, we can say that in car parks connected to such buildings, with many levels, there is a high probability of car thefts, but people are not afraid there. Another problematic location where registered crime and fear of crime intersect is Labe’s shopping centre, where a Billa supermarket and a cheap hostel, Hotel Dům, are located. Other similar places are the parking areas on Modřanská street and Sofijské square, where people are mainly afraid of homeless and drugged people.
4.3. Kolín
In Kolín, we chose violent crimes and fear of crime in general because of a smaller point data from the questionnaire than the other cities. The combination of fear of crime and registered crime is located at the main railway station, at the Futurum shopping centre, near the high school on Kutnohorská street, on Charles Square, and around some bars and supermarkets in the city centre. In Zálabí, part of Kolín behind the Elbe river, people feel afraid at the Zálabí train station, around Ludmila, a cheap hostel, and on K vinici street, where there are warehouses, specialised shops, rental equipment, etc. In the eastern part of the city centre near the main train station, the location which shows a fear of crime is around the Billa supermarket.
4.4. Ostrava
The map window of Ostrava, the largest city in our research, contains the categories of the crime theft from a person and fear of being a victim of a robbery on the street. Thefts from a person are usually located near shopping centres, squares and places where there are many people. Nevertheless, these places are not a source of the fear of theft from a person. People feel unsafe around cheap hostels, former industrial areas and at public transport stops and railway stations. In the city centre fear of crime and registered crime are notable on Stodolní street (a famous party street in the city) and around the local Albert supermarket. Citizens feel fear of crime in socially excluded localities in Přivoz (map window H) and Poruba on Dělnická street (map window G), but thefts are only located at the public transport stops in these localities. This is because people wait there for buses or trams, and the type of crime is ‘theft from a person’ (‘mugging’).
5. Conclusions
From the detail of the grid network, we could identify public transport stops, bars, and other specific locations and places that seem to be problematic. The research follows the current trend in crime research, where micro-locations (CitationZhao et al., Citation2015) and the impact of land use (CitationMatijosaitiene et al., Citation2018; CitationSreetheran & van den Bosch, Citation2014; CitationSypion-Dutkowska et al., Citation2017) on crime/fear of crime are widely studied. Other studies are similar in finding potential criminogenic localities (public transport stops, parks, and railway stations); however, this study combines specific localities with a higher intensity of specific crime and fear-causing factors on a very detailed scale and several cities of different sizes and types. The proposed methodology also has a few limitations: (1) point representation of the fear of crime places cannot cover the whole area (such as parks and malls) but still over a polygon representation is easier to vectorise for respondents in web application; (2) representativeness of the sample which does not fully correspond the real population; (3) time inconsistency of data files (crime data for three years vs. fear data for ten weeks); (4) high-high clusters (red hexagons) show rather cores of problematic localities; and (5) existence of unreported crime that if reported could increase the level of high-high areas (for more see discussion in CitationPánek et al., Citation2019).
The results of this study will be used by municipalities and police departments in the cities studied for crime prevention and awareness raising. The proposed visualisation methodology has been applied in a few cities, and training courses are being prepared to promote the methodology further. Further research with this dataset will be focused on the data relating to specific citizens’ fear of crime (according to age, sex, education, etc.).
Software
Data were processed in RStudio and ArcMap 10.6. Correlations and Kd function were produced by RStudio. Moran’s I characteristics were computed in GeoDa software. A combination of Moran’s I’s was visualised in ArcGIS Pro.
Geolocation information
All three cities and one city borough are in the Czech Republic in Central Europe.
Informed consent
Informed consent of voluntary participants of our research was obtained in the web application. In the included questionnaire, they had to confirm their agreement with publishing the anonymized data.
TJOM_2035263_Supplementary material
Download PDF (32.8 MB)Acknowledgements
The authors are grateful for the cooperation of city municipalities, the Czech Police Presidium, the Ministry of the Interior of the Czech Republic. Of course, the authors thank all the respondents to the survey.
Disclosure statement
No potential conflict of interest was reported by the author(s).
Data availability statement
Due to the nature of this research, participants of this study and the Czech Police Presidium, which provide us with crime data, did not agree for their data to be shared publicly, so supporting data are not available.
Additional information
Funding
References
- Adams, R. E., & Serpe, R. T. (2000). Social integration, fear of crime, and life satisfaction. Sociological Perspectives, 43(4), 605–629. https://doi.org/10.2307/1389550
- Birch, C., Oom, S., & Beecham, J. (2007). Rectangular and hexagonal grids used for observation, experiment and simulation in ecology. Ecological Modelling, 206(3–4), 347–359. https://doi.org/10.1016/j.ecolmodel.2007.03.041
- Burian, J., Pászto, V., & Langrová, B. (2014). Possibilities of the definition of city boundaries in GIS – the case study of a medium-sized city. 14th SGEM GeoConference on informatics, Geoinformatics and remote sensing (Vol. 17 - 24 June 2014, 3, pp. 777–784). https://doi.org/10.5593/SGEM2014/B23/S11.099.
- Burke, J., O’Campo, P., Salmon, C., & Walker, R. (2009). Pathways connecting neighborhood influences and mental well-being: Socioeconomic position and gender differences. Social Science & Medicine, 68(7), 1294–1304. https://doi.org/10.1016/J.SOCSCIMED.2009.01.015
- Ceccato, V., & Haining, R. (2004, December). Crime in border regions: The Scandinavian case of Öresund, 1998-2001. Annals of the Association of American Geographers, 94(4), 807. https://doi.org/10.1111/j.1467-8306.2004.00436.x
- Curtis, J. W. (2012). Integrating Sketch Maps with GIS to explore fear of crime in the urban environment: A review of the past and prospects for the future. Cartography and Geographic Information Science, 39(4), 175–186. https://doi.org/10.1559/15230406394175
- Curtis, J. W., Shiau, E., Lowery, B., Sloane, D., Hennigan, K., & Curtis, A. (2014). The prospects and problems of integrating sketch maps with geographic information systems to understand environmental perception: A case study of mapping youth fear in Los Angeles gang neighborhoods. Environment and Planning B: Planning and Design, 41(2), 251–271. https://doi.org/10.1068/b38151
- Czech Statistical Office. (2016). Population by permanent residence by 01.01.2016. Retrieved from https://vdb.czso.cz/vdbvo2/faces/en/index.jsf?page=uziv-dotaz#k=5&pvokc=43&uroven=70&w=
- Dent, B. D. (2000). Brief history of crime mapping. In B. D. Dent, E. H. Hendrix, & L. S. Turnbull (Eds.), Atlas of crime: Mapping the criminal landscape (pp. 4–21). Oryx Press.
- Doran, B. & Burgess, M. (2012). Putting fear of crime on the map. https://doi.org/10.1007/978-1-4419-5647-7
- Ferraro, K. F. (1995). Fear of crime: Interpreting victimization risk. SUNY press.
- Fine, G. A. (1995). A second Chicago school? The development of a postwar American sociology. (G. A. Fine, Ed.). University of Chicago Press. https://doi.org/10.2307/2945605
- Fuhrmann, S., Huynh, N. T., & Scholz, R. (2013). Comparing fear of crime and crime statistics on a university campus. In Michael Leitner (Ed.), Crime modeling and mapping using geospatial technologies (pp. 319–337). Springer Netherlands. https://doi.org/10.1007/978-94-007-4997-9_14
- Garofalo, J. (1979). Victimization and the fear of crime. Journal of Research in Crime and Delinquency, 16(1), 80–97. https://doi.org/10.1177/002242787901600107
- Hille, K. (1999). Gendered exclusions”: women’s fear of violence and changing relations to space. Geografiska Annaler, Series B: Human Geography, 81(2), 111–124. https://doi.org/10.1111/j.0435-3684.1999.00052.x
- Jiang, B., & Harrie, L. (2004). Selection of streets from a network using self-organizing maps. Transactions in GIS, 8(3), 335–350. https://doi.org/10.1111/j.1467-9671.2004.00186.x
- Khananayev, M. (2016). Does crime correlate with fear?: Analyzing the Spatial Relationship between Perceptions of Safety and Crime using Sketch Maps and Geographic Information Systems (GIS) in the Main South Neighborhood of Worcester, MA. Human Geography Commons, Place and Environment Commons. https://commons.clarku.edu/idce_masters_papers/14
- Krebs, C. (1989). Ecological methodology. Harper Collins. https://scholar.google.com/scholar?q = Krebs%2C+C.J.+1989.+Ecological+methodology.+Harper+Collins+Publishers%2C+New+York.%2C+554&btnG = &hl = en&as_sdt = 0%2C5
- Kukuliac, P., & Horak, J. (2017). W function: A new distance-based measure of spatial distribution of economic activities. Geographical Analysis, 49(2), 199–214. https://doi.org/10.1111/gean.12120
- Leitner, M., Glasner, P., & Kounadi, O. (2021). Geographies of crime. The Encyclopedia of Research Methods in Criminology and Criminal Justice, 60–63. https://doi.org/10.1002/9781119111931.ch12
- Lopez, N., & Lukinbeal, C. (2010). Comparing police and residents’ perceptions of crime in a phoenix neighborhood using mental maps in GIS. Yearbook of the Association of Pacific Coast Geographers, 72(1), 33–55. https://doi.org/10.1353/pcg.2010.0013.
- Maslow, A. H. (1943). A theory of human motivation. Psychological Review, 50(4), 370. https://doi.org/10.1037/h0054346
- Matijosaitiene, I., Zhao, P., Jaume, S., & Gilkey, J. (2018). Prediction of hourly effect of land use on crime. ISPRS International Journal of Geo-Information, 8(1), 16. https://doi.org/10.3390/ijgi8010016
- O’Campo, P., Salmon, C., & Burke, J. (2009). Neighbourhoods and mental well-being: What are the pathways? Health & Place, 15(1), 56–68. https://doi.org/10.1016/J.HEALTHPLACE.2008.02.004
- Pain, R. (1991). Space, sexual violence and social control: Integrating geographical and feminist analyses of women’s fear of crime. Progress in Human Geography, 15(4), 415–431. https://doi.org/10.1177/030913259101500403
- Pain, R. (1997). Social geographies of women’s fear of crime. Transactions of the Institute of British Geographers, 22(2), 231–244.
- Pánek, J. (2019). Mapping citizens’ emotions: Participatory planning support system in Olomouc, Czech Republic. Journal of Maps, 15(1), 8–12. https://doi.org/10.1080/17445647.2018.1546624
- Pánek, J., Glass, M. R., & Marek, L. (2020). Evaluating a gentrifying neighborhood’s changing sense of place using participatory mapping. Cities, 102, 102723. https://doi.org/10.1016/j.cities.2020.102723
- Pánek, J., Ivan, I., & Macková, L. (2019). Comparing residents’ fear of crime with real crime data – case study Ostrava, Czech Republic. ISPRS International Journal of Geo-Information, 8(9), 9. https://doi.org/10.3390/IJGI8090401
- Sreetheran, M., & van den Bosch, C. C. K. (2014). A socio-ecological exploration of fear of crime in urban Green spaces – a systematic review. Urban Forestry & Urban Greening, 13(1), 1–18. https://doi.org/10.1016/J.UFUG.2013.11.006
- Sypion-Dutkowska, N., Leitner, M., Sypion-Dutkowska, N., & Leitner, M. (2017). Land use influencing the spatial distribution of urban crime: A case study of szczecin, Poland. ISPRS International Journal of Geo-Information, 6(3), 74. https://doi.org/10.3390/ijgi6030074
- Vilalta, C. J. (2011). Fear of crime in public transport: Research in Mexico city. Crime Prevention and Community Safety, 13(3), 171–186. https://doi.org/10.1057/cpcs.2011.4
- Zhao, J. S., Lawton, B., & Longmire, D. (2015). An examination of the micro-level crime–fear of crime link. Crime & Delinquency, 61(1), 19–44. https://doi.org/10.1177/0011128710386203