
ABSTRACT
The cave map, as a result of mapping in limited cave spaces, is a specific cartographic product characterized by a high degree of cartographic abstraction and subjectivity of the cave features. Over the last decade, remote sensing methods have been increasingly used in cave mapping. Specifically, the laser scanning technology can effectively record the vastly fragmented interior of the cave at a high level of detail. The presented paper demonstrates a methodology of making the high-scale cave map from LiDAR point clouds. The innovativeness of the presented approach is in the use of highly detailed model of a cave floor derived from a point cloud as a base data layer for identification of the cave features. The main benefit of the final cave map is in the diminution of the authoŕs subjective perception during the cave mapping resulting in the generalization of the cave spaces geometry and cave features.
1. Introduction
Portraying the geometry of the cave within a map in form of a plan view and vertical profiles is an essential part of speleology and caving. Cave map is mainly used for orientation in the cave (CitationNieland, Citation1978), technical documentation of research and speleological activities (CitationMandić et al., Citation2013; CitationUrban et al., Citation2017), cave management (CitationNepstad, Citation1987), as well as for popularization and marketing purposes (CitationKambesis et al., Citation2013). Moreover, cave map provides important assistance to cave researchers and spelunkers (CitationDasher, Citation2011; CitationWhite, Citation2019).
The principles and technologies of cave mapping have been gradually developed from the mining survey since the end of the nineteenth century (CitationMattes, Citation2015). The most traditional and still most commonly used method is the compass traverse (CitationCorvi, Citation2018). Due to the affordability and flexibility of the equipment handling, and the voluntary character of the speleoclubs, it is still predominant cave mapping approach up to the present. During the twentieth century, theodolites, later total stations, also began to be used sporadically in cave mapping, which increased the positional accuracy of the measurements (CitationMattes, Citation2015). Their usage was mainly related to the artificial, constructional or technical interventions in the cave (breaks in the entrance, construction work, access to the cave, etc.). Even though the mapping with the total station is highly accurate, the arduous handling in the cave environment increases the time consumption, making this method inefficient in many aspects. The common output of these methods is a traverse line linking vertexes acquired by the conversion of measured distances and angles to the Cartesian coordinates (CitationDasher, Citation2011).
A significant milestone in cave mapping was the utilization of remote sensing technologies since the beginning of the twenty-first century. The most used are photogrammetry (CitationTriantafyllou et al., Citation2019) and laser scanning (CitationGallay et al., Citation2016), and capturing the morphology of the cave in the form of point cloud in high spatial resolution is the main output. Derived 3D models of the cave (CitationSilvestre et al., Citation2015) can be visualized by 3D printing (CitationBuchroithner, Citation2015), virtual reality (CitationColón, Citation2019), or in the form of interactive web-based visualization via open-source applications using point clouds (CitationSchütz, Citation2016) or commercial solutions designed for 3D models formats (CitationPotenziani et al., Citation2015). The disadvantage of the derived 3D cave model is the inability to fully substitute the cave map (CitationVan Rentergem et al., Citation2017) directly in the cave environment. For orientation in the cave, as well as for other caving and speleological activities, visualization of the complex cave plan view with the interpretation of the important cave features and sudden elevation changes is much more beneficial.
The cave map produced based on the traverse line, details of the passages, horizontal and vertical dimensions of the cave, cave features and their location are drawn from the field sketches or detailed measurements of the significant objects made during the cave mapping (CitationTrimmis, Citation2018). At the end of the twentieth century, specialized software, such as the Compass software (CitationFish, Citation1997), Therion (CitationBudaj & Mudrák, Citation2008), Cavewhere (CitationSchuchardt, Citation2013) began to be used in the cartographic creation of the cave maps. Sporadically, a geographical information system (GIS) has also been used (CitationKershaw, Citation2012). In comparison with the topographic mapping of the landscape, the map of the cave is additionally supplemented by additional content in the form of vertical views or cross-sections to represent the elevation of the cave passages (CitationDay, Citation2002). However, the main limitation of the cartographic production of the cave map is the subjectivity and the reliability of the position and shape of the cave features. The method of depicting the configuration of the cave floor, walls and ceilings, occurring rock blocks, type of sediments (gravel, sand, clay), sintering formations (speleothems), details of stream banks, technical objects (concrete walkway, stairs) and other cave features in the resulting map is based on the authoŕs subjective perception.
The presented paper introduces the creation of the cave map from a point cloud by maintaining the plan view approach. The methodical procedure for making the cave map is based on deriving the cave floor model and generating the shaded surface of the cave floor, which is used for the interpretation of the cave features. The derived shaded surface of the cave floor is also the fundamental compositional element of the map, expressing the position and shape of the individual cave features in detail with their altitude. Therefore, the final cave map is not drawn based on the subjective perception of the surveyor and is fully independent of the traverse line of the cave. This paper also presents a comparison of the acquired results with the previously applied approaches at the study site of the Domica cave located in Slovak karst in southern Slovakia.
2. Study area
The presented methodology is demonstrated on an approximately 100-meter-long section of the Čertova Diera – Domica cave system including the Majko dome (CitationGaál & Gruber, Citation2014). This section was selected for the high diversity of passages from large domes to narrow crawlways, the occurrence of different cave feature types, and artificial objects as well as the existence of several types of maps of this part of the cave created by classical speleocartographic approaches. The Domica cave represents the Slovak part of the internationally significant cross-border Baradla-Domica cave system (30 km) in the Slovak and Aggtelek Karst located on the Slovakia-Hungary border (). In 1995, caves of the Aggtelek Karst and Slovak Karst were inscribed on the UNESCO World Heritage list.
Figure 1. Location of the Domica cave, integrating data from airborne and TLS missions. Basemap: GKÚ, Esri Hillshade, OpenStreetMap.
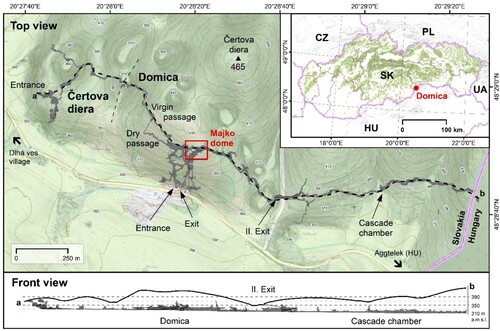
The terrestrial laser scanning (TLS) of the cave interior has been done under the auspices of the Slovak Speleological Society Speleoclub UPJŠ since 2014. Currently, 95% of known cave interior parts of the Čertova diera – Domica cave system () are mapped by TLS. In addition, the airborne laser scanning (ALS) capturing the landscape surface above the cave was carried out in 2014.
3. Data and methods
A major part of the Domica cave was systematically mapped using TLS Riegl VZ-1000. Since 2019, the TLS survey had been supplemented by mapping with more compact TLS FARO Focus 3D X130 used in the narrow cave passages. The selected cave part comprises 28 scanning positions acquired by TLS Riegl with angular step set to 0.06° and 61 positions acquired by TLS FARO with the angular step of 0.036°.
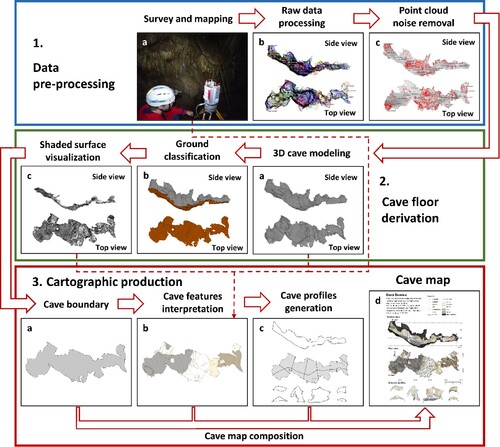
The fundamental input data for the cave map creation is the shaded surface of the cave floor derived from the point cloud. shows a schematic representation of the individual steps of the methodology for creating a map of the cave derived from a point cloud comprising three phases: data pre-processing, cave floor derivation and the cartographic production of the final map.
3.1 Data pre-processing phase
During the TLS cave survey, high-density point clouds and elimination of the data shadows were achieved by suitable placement of the scanning positions at a maximum distance of 20 m from the successive position. Depending on the cave part, point density varied from 26,000 points/m2 in large domes up to 460,000 points/m2 in the narrow passages. The cave mapping also included field sketches and other evidence containing photographs and notes of the mapped cave parts characteristics (, 1a). These records were later used within the cave features interpretation phase (, 3b).
Figure 2. The workflow of creating a cave map from a point cloud: 1. Data pre-processing, 2. Cave floor derivation and 3. Cartographic production. The red arrows show the sequence of the individual steps, the dashed guidelines of the arrow indicate individual partial outputs used for the cave feature interpretation.
The initial processing of the TLS point cloud (, 1b) consists mainly in combining the individual scanning positions. For the raw data processing, the manual and automatic registration was applied with the standard deviation error of the Iterative closest point (ICP) registration of 0.004 m. The point cloud was located in the S-JTSK coordinate system (EPSG code: 5514) and Balt datum using the stabilised control points on the aboveground surface and inside the cave. The total standard deviation of the global registration using 8 control points was 0.016 m, which expresses the positional accuracy of the resulting cave map. Subsequently, noise removal was performed using echo and deviation filters in the RiSCAN software for TLS data from the Riegl scanner. For data from the FARO laser scanner, the edge artifact and stray point filter were included in the initial processing and automatic registration phase in the FARO Scene software. Approximately 5% of the points were removed by filtering. The final point cloud subsampled to a spatial resolution of 0.01 m comprised 144 million points.
3.2 Cave floor derivation phase
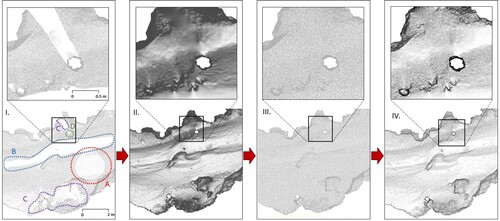
Identification of the cave floor (, 2a–c) is the key step for the creation of the cave map derived from the point cloud. The result of this phase is a shaded surface model of the cave floor (, 2c). First, a 3D mesh model of the cave was generated (, 2a) using the Poisson surface reconstruction (PSR) method (CitationKazhdan & Hoppe, Citation2013) implemented in the CloudCompare software (CitationGirardeau-Montaut, Citation2016) with a spatial resolution of 0.01 m. The possible data shadows due to the fragmentation of the cave, the occurrence of water or obstacles (, I), and also the uneven overlaps resulting in the presence of redundant point coverage were eliminated using PSR for the surface reconstruction. Subsequently, a point cloud with 0.01 m of spacing between points was derived from the created 3D mesh cave model. This step ensured the homogeneity of the points distribution, reduction of redundant points, and filling the data shadows in the point cloud (, III). The scalar field of the normal orientation for the individual points was also exported. The dip direction of normal vectors of the point cloud enhanced the visualization of the shaded surface of the cave floor for the cave features interpretation (, 3b).
Figure 3. The original points distribution from TLS (I.) is inhomogeneous and different point density and data shadow are caused by (A) scanning position, (B) water occurrence, (C) speleothems, (D) pillar. After generating the 3D cave mesh model (II.), a homogenous point cloud was derived (III.), coloured by the normal dip direction (IV.) increasing the detection capability of the cave features.
The cave floor was classified from the point cloud (, 2b) using The Cloth Simulation Filter (CitationZhang et al., Citation2016) implemented in the CloudCompare software (CitationGirardeau-Montaut, Citation2016). To detect points representing the cave floor, the cloth resolution parameter was set to 0.1 m and the classification threshold to 0.5 m. The weakness of this approach is in the unsuccessful point classification due to the steep slopes mainly in those places, where the speleothems are located. For this reason, the incorrectly classified clusters of points distant more than 0.02 m from the ceiling were also defined as the cave floor using the Label Connected Components tool. In total, 91.5% points were successfully classified by the automatic classification. The subsequent manual classification solved specific cases such as low ceilings, overhangs, and morphologically complex features with considerable elevation.
3.3 Cartographic production
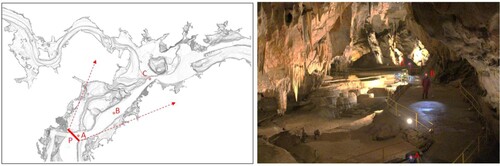
The fundamental layer for the cave features interpretation is the cave footprint which is defined as a cave space extent projected on a horizontal plane (, 3a). The cave walls boundaries were derived automatically from the cave footprint using the lasBoundary tool (CitationIsenburg, Citation2019) implemented in the LasTools software. The process of the cave features interpretation was primarily performed in the ArcGIS 10.6 software using the source layers comprising the shaded surface of the cave floor and the cave walls boundaries (). By manual vectorization, polygonal, linear, and point types of cave objects were differentiated.
Figure 4. Shaded surface of the cave floor of the Domica cave in the part of Majko dome. The thick red line (P) indicates where the photo (on the right side) was taken from. Cavers marked with the letters A–C can be used as a scale.
The final composition of the cave map consisted of the polygonal, line and point features with a raster background of the shaded surface of the cave floor. Due to the sufficient clarity of the shaded surface basemap, the standards of the International Union of Speleology (UIS) map key were respected. Additionally, the use of colours was preferred to standard hatching.
Areal cave features are represented by polygons with qualitative characteristics differentiated by colours. Polygonal objects were delimited from the cave walls boundaries layer and the attributes for water, seasonal water, flowstone, limestone, clastic sediments, and pavement were assigned to the particular segments.
The cave features such as railings, pipes, and boundaries of the ceiling forms and chimneys were considered as linear features. The line symbols in the map also express additional information such as the axes of the cross-sections (, 3c). Contour lines can be considered as an individual group of line features. Although the contours occur in the cave maps (CitationMattes, Citation2015), due to the difficulty of obtaining dense elevation measurements by conventionally used methods, it is a sporadic additional content, often strongly generalized. In the presented case, contour lines were derived from the point cloud using the lasContour tool (CitationIsenburg, Citation2019) with a defined interval of 2 m. Line features are represented by line symbols, while for expressing their qualitative characteristics the change of line structure and colour is used.
As point features, it is possible to consider, e.g. measuring points, speleothems, or other points of orientation and labels. Geometric symbols were used to represent the point features with the halo effect improving their readability. For creating the Domica cave map, geodetic points of the previous mapping (CitationNovoveský, Citation1974) were marked on the cave walls by red circles and labels with a number for each point. For the polygonal data layers, the transparency of 40% was set to make the underlying shaded relief legible.
4. Results and discussion
This study demonstrates the potential of TLS data for making the high-scale cave map. The final cave map at the scale of 1:250 with the size of A2 contains the map legend, imprint with metadata, map sheet number in case of the large cave system and grid for interpretation of the distances in the map.
By highlighting the shaded surface of the cave floor, the information about the cave altitude and location of the cave features is more legible compared to the technical hatching, similar to the topographic maps expressing the terrain. Another innovative cartographic element of the final map is the maximum vertical extent of the cave which can be defined as a cave space extent projected on a vertical plane. The scale of vertical views and unfolded profiles in the main map is 1:500. This gives us further information about the layout of the cave in places beyond the selected profiles. Therefore, the content of the map was supplemented by unfolded cross-sections and perpendicular projections of the cave generated from the 3D cave mesh model. In the case of vertical views, the map also included the area representation of the maximum cave extent for parts not directly visible within a given cross-section.
Vertical views are an important part of the resulting cave map, expressing the height fragmentation of the cave passages. Although the cave model created from a point cloud allows to display sections regularly at certain distance intervals, the sections through the cave in selected places determined by the author of the map were preferred. To show the course of the cave profiles and their localization, the already established speleocartographic method was applied using a line with alphanumeric characters indicating the starting and terminal point. The longitudinal profiles of the cave are represented by unfolded profiles, which significantly facilitate orientation in the cave. In addition to the vertical fragmentation of the cave, the altitude of the individual parts can be determined using guidelines with an indication of the altitude given in meters above mean sea level. The representation of the material type on the cave walls and the use of shaded surface technique is also integrated in the vertical views. In this way, the cave features are visible even in the perspective views.
In terms of evaluation of the Domica cave maps and comparing them with the presented methodology, four maps representing the same part of the Domica cave – Majko dome were selected. For the comparison, five cave features marked with red labels were chosen ().
Figure 5. Comparison of the cave maps of the Majko dome in the Domica cave produced by (A) CitationPaloncy (Citation1931), (B) CitationKettner and Roth (Citation1937), (C) CitationDroppa (Citation1964), (D) CitationNovoveský (Citation1974) and (E) presented final cave map by Šupinský et al. (2021). Points marked as red number labels represent the identical locations or cave features.
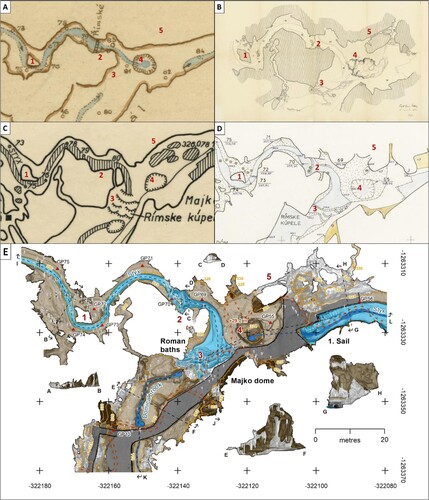
To compare the individual maps, the level of detail of the map content, the generalization of the geometry of the cave features, and the used cartographic expressions are evaluated. Point 1 represents the massif with a flowstone, which protrudes from the cave floor and connects to the cave ceiling. Point 2 refers to the representation of the watercourse of the River Styx. Point 3 is a depiction of sinter pools named as the Roman Baths, which were created during the overflowing of the river Styx into the vast spaces of the Majko dome. Point 4 represents man-made modified pit with an episodic pond (the natural state is in , B). Point 5 represents narrow corridors and branches from the main dome.
In general, it can be stated that the maps of CitationPaloncy (Citation1931) (, A) and CitationDroppa (Citation1964) (, C) are considerably generalized, and the shape of the cave and cave features are simplified. The strength of the CitationNovoveský (Citation1974) map (, D) is the expression of the cave floor type and the use of spots with the height labels. On the other hand, the generalization of shape of the cave and positional deformation of the cave features are also considerable. The map (, B) by CitationKettner and Roth (Citation1937) is the most positionally accurate and the cave features are portrayed in detail. This map can be considered as a work of art with a historical value, while the final map production is time-consuming and required advanced drawing skills.
There are also several published examples of cave maps created from a point cloud using remote sensing techniques. At the International Congress of Speleology in Sydney (2017), a map of Jenolan caves based on previous mobile laser scanning (CitationZlot & Bosse, Citation2014) and a map of the Gomantong caves derived from TLS data (CitationVan Rentergem et al., Citation2017) were presented. In these maps, the positional accuracy and shape generalisation is on the similar level as in our approach. On the other hand, as the shaded surface of the cave floor was not included, there is a higher simplification of the cave features in the cave floor. The use of the shaded surface of the cave floor has appeared in earlier published works (CitationKonsolaki et al., Citation2020; CitationŠupinský et al., Citation2019). However, it was only a plan view of the shaded surface without the cartographic symbols of the cave features. We argue, that the solely use of the shaded surface of the cave floor within the map content is insufficient. Therefore, the interpretation of the points, lines and especially areal cave features using presented symbology make the readability of the cave map content clearer.
5. Conclusion
The presented paper deals with making the high-scale cave map from LiDAR point cloud. The methodical procedure for creating the cave map is based on deriving the shaded surface model of the cave floor, which is used for the interpretation of the cave features. The shaded surface model of the cave floor is also used as a basic compositional element of the final map, which expresses the position and shape of the individual cave features and their elevation in detail.
From a cartographic design point of view, the use of the shaded surface of the cave floor in combination with the colouring of the cave surface types make the map content more readable. Cartographic symbols of the cave features were designed based on the UIS map standards. The combination of several cartographic methods maintains the legibility of the cave map, despite the plentiful map content and the expression of the high number of the cave features.
Software
The final cave map was produced using ArcMap 10.6. Derivation of the 3D model, floor classification, derivation of sections as well as the vectorization of the speleothems was performed in the CloudCompare software. Derivation of the cave boundary and contour lines was performed in the LasTools software.
TJOM_2035270_SUPPLEMENATRYMATERIAL
Download PDF (22.5 MB)Data availability statement
The data that support the findings of this study are available from the corresponding author, Ján Kaňuk, upon reasonable request.
Acknowledgements
With support by grantVEGA 1/0798/20 Synergistic use of multisource remote sensing data in Earth system research.
Disclosure statement
No potential conflict of interest was reported by the author(s).
Additional information
Funding
Related Research Data
References
- Buchroithner, M. F. (2015). Mountain cartography ‘down under’–Speleological 3D mapping. Wiener Schriften zur Geographie und Kartographie, Wien, 21(1), 93–204.
- Budaj, M., & Mudrák, S. (2008). Therion–digital cave maps. Spelunca Mémoires, 33(1), 138–141.
- Colón, A. A. A. (2019). From cave surveying to virtual fieldwork experience. In GSA annual meeting in Phoenix, Arizona, USA. GSA.
- Corvi, M. (2018). Cave surveying . Newcaves Chronicles, 26(1), 49–56.
- Dasher, G. R. (2011). On station: a complete handbook for surveying and mapping caves. National Speleological Society, 264.
- Day, A. (2002). Cave surveying. Cave studies series 11. BCRA, 40.
- Droppa, A. (1964). Domica, plán 1:1000. Mapový archív SMOPaJ, ev. č. 16212. https://www.slovakiana.sk/kulturne-objekty/cair-ko1jx3j?content=CAIR_DIV_IMAGES_1&contentDo=urn:nbn:sk:cair-do3f8hk
- Fish, L. (1997). Compass. Compass Point, 5(17), 3–6.
- Gaál, Ľ., & Gruber, P. (2014). Jaskynný systém Domica-Baradla. Jaskyňa, ktorá nás spája. Aggtelek (Aggteleki Nemzeti park), 512.
- Gallay, M., Hochmuth, Z., Kaňuk, J., & Hofierka, J. (2016). Geomorphometric analysis of cave ceiling channels mapped with 3-D terrestrial laser scanning. Hydrology and Earth System Sciences, 20(5), 1827–1849. https://doi.org/10.5194/hess-20-1827-2016
- Girardeau-Montaut, D. (2016). CloudCompare. https://www.danielgm.net/cc
- Isenburg, M. (2019). LAStools—Efficient LiDAR Processing Software, (version 181001 academic); rapidlasso GmbH: Gilching, Germany.
- Kambesis, P. N., Oakes, B., & Lace, M. (2013). Challenges of cave management in a developing country: A case study of Grotte Marie-Jeanne, Departemente Sud, Haiti. 20th National Cave and Karst Management Symposium, 143–146.
- Kazhdan, M., & Hoppe, H. (2013). Screened poisson surface reconstruction. ACM Transactions on Graphics, 32(3), 1–13. https://doi.org/10.1145/2487228.2487237
- Kershaw, B. (2012). Managing the survey information of the caves of Judbarra/Gregory National Park, Northern Territory. Helicite, 41(1), 87–94. https://helictite.caves.org.au/contents4.html
- Kettner, R., & Roth, Z. (1937). Domica, plán 1:100. Mapový archív SMOPaJ, ev. č. 09711/1. https://www.slovakiana.sk/kulturne-objekty/cair-ko25h5o?content=CAIR_DIV_IMAGES_1&contentDo=urn:nbn:sk:cair-do3f89g
- Konsolaki, A., Vassilakis, E., Gouliotis, L., Kontostavlos, G., & Giannopoulos, V. (2020). High resolution digital 3D modelling of subsurface morphological structures of Koutouki Cave, Greece. Acta Carsologica, 49(2–3), 163–177.
- Mandić, M., Mihevc, A., Leis, A., & Bronić, I. K. (2013). Concentration and stable carbon isotopic composition of CO2 in cave air of postojnska jama, Slovenia. International Journal of Speleology, 42(3), 279–287. https://doi.org/10.5038/1827-806X.42.3.11
- Mattes, J. (2015). Underground fieldwork – A cultural and social history of cave cartography and surveying instruments in the 19th and at the beginning of the 20th century. International Journal of Speleology, 44(3), 251–266. https://doi.org/10.5038/1827-806X.44.3.4
- Nepstad, J. (1987). In pursuit of a perfect cave management cave map. Cave management symposium, 65–71.
- Nieland, J. (1978). Cave surveying. The caving information series of the National Speleological Society, 116–124.
- Novoveský, A. (1974). Domica, mapa 1:500. Mapový archív SMOPaJ, ev. č. 09724. https://www.slovakiana.sk/kulturne-objekty/cair-ko1lpw4?content=CAIR_DIV_IMAGES_1&contentDo=urn:nbn:sk:cair-do36zq3
- Paloncy, E. (1931). Domica, plán 1:2000. Mapový archív SMOPaJ, ev. č. 18660. https://www.slovakiana.sk/kulturne-objekty/cair-ko246u1?content=CAIR_DIV_IMAGES_1&contentDo=urn:nbn:sk:cair-do3f8a9
- Potenziani, M., Callieri, M., Dellepiane, M., Corsini, M., Ponchio, F., & Scopigno, R. (2015). 3DHOP: 3d heritage online presenter. Computers & Graphics, 52, 129–141. https://doi.org/10.1016/j.cag.2015.07.001
- Schuchardt, P. (2013). Quick 3D cave maps using Cavewhere. 16th international congress of speleology, 2, 306–309.
- Schütz, M. (2016). Potree: Rendering large PointClouds in web browsers. Diplom thesis, Vienna University of Technology, 92.
- Silvestre, I., Rodrigues, J. I., Figueiredo, M., & Veiga-Pires, C. (2015). High-resolution digital 3D models of algar do penico chamber: Limitations, challenges, and potential. International Journal of Speleology, 44(1), 25–35. https://doi.org/10.5038/1827-806X.44.1.3
- Šupinský, J., Kaňuk, J., Hochmuth, Z., & Gallay, M. (2019). Detecting dynamics of cave floor ice with selective cloud-to-cloud approach. The Cryosphere, 13(11), 2835–2851. https://doi.org/10.5194/tc-13-2835-2019
- Triantafyllou, A., Watlet, A., Le Mouélic, S., Camelbeeck, T., Civet, F., Kaufmann, O., … Vandycke, S. (2019). 3-D digital outcrop model for analysis of brittle deformation and lithological mapping (Lorette cave, Belgium). Journal of Structural Geology, 120, 55–66. https://doi.org/10.1016/j.jsg.2019.01.001
- Trimmis, K. P. (2018). Paperless mapping and cave archaeology: A review on the application of DistoX survey method in archaeological cave sites. Journal of Archaeological Science: Reports, 18, 399–407. https://doi.org/10.1016/j.jasrep.2018.01.022
- Urban, J., Tyc, A., Kasza, A., & Ślusarczyk, A. (2017). Scientific documentation required during the exploration of caves and technical work carried out in tourist show caves ‒ examples from central Poland. Geotourism/Geoturystyka, 48–49(1), 1–60. https://doi.org/10.7494/geotour.2017.48-49.4
- Van Rentergem, G., McFarlane, D., Lundberg, J., & Buchroithner, M. (2017). Lessons learned from a large-scale 3-D mapping project, with Faro laser scanners, of the Gomantong Caves, Borneo. Proceedings of the 17th International Congress of Speleology, 2, 144–146.
- White, W. B. (2019). Surveying caves. Encyclopedia of caves. Academic Press. 1063–1070. https://doi.org/10.1016/B978-0-12-814124-3.00123-0
- Zhang, W., Qi, J., Wan, P., Wang, H., Xie, D., Wang, X., & Yan, G. (2016). An easy-to-Use airborne LiDAR data filtering method based on Cloth simulation. Remote Sensing, 8(6), 501. https://doi.org/10.3390/rs8060501
- Zlot, R., & Bosse, M. (2014). Three-dimensional mobile mapping of caves. Journal of Cave & Karst Studies, 76(3), 3. https://doi.org/10.4311/2012EX0287