
 ?Mathematical formulae have been encoded as MathML and are displayed in this HTML version using MathJax in order to improve their display. Uncheck the box to turn MathJax off. This feature requires Javascript. Click on a formula to zoom.
ABSTRACT
The census of population, conducted by three statistical offices in the United Kingdom, provides a unique resource for measuring and understanding internal migration patterns and propensities. It is the only source that asks an entire population, once every ten years, about their migration behaviour and as such provides a valuable resource for assessing the impact that migration has on the size and composition of local populations. The data are attribute rich in that they provide information about migration patterns by demographic group and are spatially detailed so provide a view of the impact that migration has on small areas. Despite their utility, the data have limitations, not least that they are only collected once per decade so only provide a snapshot of the UK migration system. This paper utilises data from the previous four censuses to present maps showing how migration propensity and efficiency has changed between 1981 and 2011.
1. Introduction
Internal migration has a substantial effect on the size and composition of sub-national populations. In the United Kingdom (UK), the decennial census, conducted by three statistical offices (the Office for National Statistics in England and Wales, National Records of Scotland and the Northern Ireland Statistics and Research Agency), provides a ‘gold standard’ in terms of data collection for understanding these migration patterns as it is the only data source which asks the question ‘one year ago, what was your usual address?’ of an entire population. As such the census offers a once in a decade opportunity to assess comprehensively how mobile the population is. Other data sources capture these patterns outside of census years, but they rely on administrative data or sample surveys, neither of which are designed to measure migration patterns across an entire population. As such, they need to be ‘pegged’ to census data to provide a sound assessment of how patterns and propensities of migration change over time. This paper sets out to demonstrate the value of UK census internal migration data as a unique and valuable resource by presenting maps which summarise migration patterns reported in the last four censuses taken in 1981, 1991, 2001 and 2011. The work also highlights some of the challenges and inconsistencies which exist in the census data, which become especially clear when comparing data from different time periods. While this paper has a UK focus, the impact of internal migration on sub-national populations, as well as the utility and challenges of using census data are shared by many countries around the world. A comprehensive review of internal migration data availability, measurement and collection practices for 193 countries can be found in CitationBell and Charles-Edwards (2015).
1.1. Migration research using the census
UK Census migration data have been used extensively to study internal migration patterns over several decades. Utilising linked census data (with limited geographical coverage), CitationChampion and Shuttleworth (2017a) find that between the 1971 and 2011 Census, overall internal migration propensity has declined, although this is more pronounced for shorter distance moves than for longer distance moves. Further investigation by CitationShuttleworth et al. (2019) reveal the fall in rates observed when comparing the 1971–1981 period with the 2001–2011 period cuts across all population groups. This long term decline in migration propensity is not unique to the UK, with comparisons having been drawn in other developed countries such as the United States and Australia (CitationChampion et al., 2017).
The sub-national spatial patterns underlying these long-term headline declines in propensity have been examined with the aid of census data. Counter urbanisation, the move from urban to less urban areas, has been reported in the 1981 (CitationChampion, 1989), 1991 (CitationRees et al., 1996) and 2001 Census data (CitationChampion, 2005). CitationSimpson and Finney (2009) compare 1991 and 2001 census data, finding patterns of counter urbanisation hold for most ethnic groups in both time periods. However, a comparison of 2001 and 2011 Census data reveal that the 2000s marked a period of re-urbanisation (CitationRae, 2013), with a pattern of moves into urban areas evident in the 2011 data. CitationChatagnier and Stillwell (2021) find that this is the case for most age groups in their comparison of 2001 and 2011 Census data.
The comprehensive geographical coverage and attribute rich nature of census data mean they have been used to provide insight into the nuances of mobility patterns within society. A detailed consideration of how the distance of internal migration varies across a range of demographic variables is undertaken by CitationLomax et al. (2021) who argue that what constitutes ‘long distance’ is very specific to the variables of interest. CitationDarlington-Pollock et al. (2019) assess how propensity and distance of move varies by ethnic group and country of birth while CitationRaymer and Giulietti (2009) group local authority areas to better understand ethnic group migration patterns by type of area. The effect that scale (the size of the geographical area) and zonation (the way that contiguous zones are amalgamated) has on the assessment of migration intensity and effectiveness is reported by CitationChatagnier and Stillwell (2021). Using 2001 and 2011 Census data at local authority scale they find that results are increasingly sensitive to the way that zones are formulated as scale increases, i.e. where there are fewer, larger zones the way in which they are constructed becomes more important.
Despite being a valuable resource for understanding internal migration, the census data have their limitations. Data are only collected once every ten years which means that they only provide a snapshot of the migration system, and other sources are needed to understand what is happening to internal migration in the inter-censal years. A key source of data, used extensively to assess migration patterns in the UK, is recorded by the National Health Service (NHS) which relies on a patient reporting a change of address to their doctor. The value of these data is discussed by CitationStillwell et al. (1994) and the NHS data are combined with Census data by CitationLomax (2013) to provide a comprehensive time-series of UK migration for the period 2001–2013. Other data sources include consumer survey data used by CitationStillwell and Thomas (2016) to estimate intra-zonal migration distances, and commercial data arising from postal redirection services, used by CitationLomax (2021) to estimate household mobility.
Census data are extremely useful for investigating propensities and patterns of migration, but do not reveal the motivation for those moves. As such, alternative data are needed to investigate why people move. For example, CitationThomas et al. (2019) use the UK Household Longitudinal Study (and the Australian, Swedish and US equivalents) to examine migration motive by distance, finding housing motivates short distance moves while employment motivates long distance moves. CitationShuttleworth et al. (2021) use Understanding Society longitudinal survey data to demonstrate that migration propensity and distance varies by personality traits, where extroverts are more likely to move than introverts, and that people predisposed to openness are more likely to move longer distances.
It is important to point out that issues have been identified with Census data, and considerable energy has gone into identifying discrepancies and offering solutions for adjustment of the data. This includes corrections for under-enumeration in 1991 Census data (CitationRees & Duke-Williams, 1997; CitationSimpson & Middleton, 1999) and adjustment of the data to redistribute internal migrants without a defined origin (CitationBoyle & Feng, 2002; CitationLomax, 2013). An assessment of the impact that disclosure control methods introduced in 2001 (and subsequently dropped for 2011) had on data quality is discussed by CitationStillwell and Duke-Williams (2007). They highlight that this methodological change, as well as other issues like the inclusion of students in 2001 data and treatment of those aged under one in the migration data cause issues comparability when compared with 1991 data. Mindful of this range of issues, the methods and analysis presented below attempt to provide a view of migration as reported in the last four censuses, but do not pretend to deal with all the discrepancies which exist.
This paper contributes to the existing literature by offering comparison of sub-national migration intensity and efficiency across four decades in a consistent way, for as much of the UK as is feasible with the data available. Previous work taking a long-term view on UK internal migration has reported national trends (CitationChampion & Shuttleworth, 2017a), assessed patterns at larger scale regional geographies (CitationChampion & Shuttleworth, 2017b), excluded one or more of the countries that make up the UK (CitationKalogirou, 2005) or dealt with a smaller number of time periods at a sub-national scale (CitationStillwell & Lomax, 2017). In discussion, this paper also anticipates potential challenges which might arise in advance of the release of the 2021 Census migration data.
2. Methods
2.1. Data sources
All data used in this study are derived from the Census ‘special migration statistics’ (SMS), which comprise origin-destination flow data from the smallest Output Area scale upwards for the UK. Flow data are available from the 1981, 1991, 2001 and 2011 censuses. All data were downloaded from the Web-based Interface to Census Interaction Data (WICID) platform supported and maintained by the UK Data Service Census Support (https://wicid.ukdataservice.ac.uk/). Census-based population data, used as the denominator to calculate migration rates, was also downloaded from WICID. All data relate to the total number of migrants/total population and were extracted at Local Authority District (LAD) scale. Data were cleaned and made broadly consistent for comparison as outlined below.
2.2. Data adjustments
In the 1981 and 1991 Census data, migrants who did not give a full account of their address one year ago (their origin) were coded as having ‘origin unstated’, while in the 2001 Census respondents were given the option of stating that one year ago they had ‘No Usual Address’. In both cases the effect on the data was substantial: in 1981, 1.82% of migrants had no origin (CitationBoyle & Feng, 2002) while in 2001 467,052 people reported having ‘No Usual Address’ (CitationLomax, 2013). The result was an under-reporting in the Census SMS regarding the outflows from origin of internal migrants and an imbalance in the origin-destination matrix. The practice of assigning or allowing responses with unstated origins was dropped in the 2011 (and 2021) Census in order to achieve full enumeration in the SMS. In the case of 1981 and 1991 Census data, an adjusted dataset is available directly from WICID which reallocates ‘origin unstated’ flows proportionally within the origin-destination data of the SMS, effectively allocating migrants to an origin based on the size of observed migration flow (CitationBoyle & Feng, 2002). A similar approach was undertaken to proportionally reallocate the ‘No Usual Address’ migrants in the 2001 data by CitationLomax (2013). For 1981 and 2001, these adjusted data (from WICID and CitationLomax (2013) respectively) were utilised. However, for 1991 a further issue of under-enumeration, caused by the suppression of data for statistical disclosure control, was identified by CitationRees and Duke-Williams (1997) and CitationSimpson and Middleton (1999) who each produced an enhanced dataset, adjusting the SMS (the former developing the MIGPOP dataset while the later developed the SMSGAPS dataset). Both of these adjusted datasets are available within WICID and the adjusted data resulting from the MIGPOP project are used in this paper.
2.3. Dealing with changing geographies
Periodically, the geographies used to report Census data, indeed any socio-economic data, change. This can be due to intentional changes to underlying statistical geographies, for example, the reorganisation of output areas (the ‘building blocks’ of census data) so that they better represent the population as it changes over time. Another reason is that administrative geographies, often used to analyse census data because they provide meaning in the context of local government decision making or resource allocation, change independently of the census release. No matter the reason, any changes cause difficulties when comparing phenomena over time and need to be dealt with. In this paper two solutions are utilised: (1) a best-fit is imposed on LADs to produce a consistent set of spatial units for the four time periods; and (2) LADs are grouped in to functional ‘City Regions’ which represent the relationship that Core UK cities have within their immediate region and more broadly with the rest of the spatial system.
Both of these adjustments are possible because the link between origins and destinations is available in the census data, in the form of flow matrices or pairwise data frames. This provides flexibility to aggregate areas into larger geographies, and in both cases where inter-area flows become intra-area flows, they can easily be removed from the migration matrix. The population data, used as denominator to calculate rates and other metrics, can be aggregated to the new geography as required.
2.4. Creating consistent LAD boundaries
This study uses LADs as the smallest spatial scale of analysis. While there has been considerable energy devoted towards producing consistent data at finer spatial scales (CitationRees et al., 2004) for the visualisation and analysis presented in this paper LAD scale provides a good balance between detail and data availability. Fortunately, much of the hard work in producing consistent LAD boundaries has already been done by previous research projects, so only minor further adjustments are required. The 1981 Census data were re-estimated for 1991 geographies and deposited into WICID by CitationBoyle and Feng (2002), and this study utilises these 1991 boundaries for the first two time periods. The 2001 data have been re-estimated to 2011 geographies by CitationLomax (2013) and these data are utilised for the second two time periods.
It is worth noting that there has been further work on re-estimating 1981 and 1991 census data for 2001 geographical boundaries (CitationBoyle & Feng, 2002), and both datasets are available within WICID. However, the adjusted data which account for under enumeration in 1991 (as discussed above) have not been re-estimated for 2001 geographies, so the analysis here requires a trade-off between using the enhanced data or a consistent geography. The enhanced data were chosen and further adjustment was undertaken to match 1991 geography (attached to the 1981 and 1991 data) to 2011 geography (attached to the 2001 and 2011 data). The process first involved straight aggregations of LADs in the 1991 data to match boundaries from the 2011 geography where LADs have been amalgamated (39 areas fit into nine areas). Second, six LADs reported in the 1991 were split to form a total of 15 new administrative units as reported in the 2011 data. In this case, the aggregated LADs were retained in 1981 and 1991 while the disaggregated boundaries were used for 2001 and 2011. Data for Northern Ireland are not available for 1981 or 1991 (under any of the geographical boundary systems used) so 26 LADs are excluded for the first two time periods. The net result of these three discrepancies is that data are reported for 35 fewer areas in 1981 and 1991 than in 2001 and 2011.
2.5. Grouping LADs into city regions
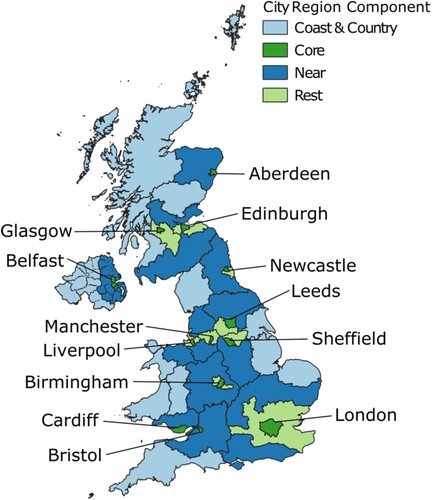
The grouping or collation of geographies is often undertaken to provide a summarised, more easily understandable set of boundaries. The analysis presented in this paper adopts a City Region typology, designed as a set of functional entities to aid in decision making (CitationMarvin & Robson, 2006). The City Regions used in this study were defined by CitationStillwell et al. (2000, Citation2001) and represent 13 ‘Core Cities’ of the UK: Aberdeen, Belfast, Birmingham, Bristol, Cardiff, Edinburgh, Glasgow, Leeds, Liverpool, London, Manchester, Newcastle and Sheffield (see ). In addition to the ‘Core’ LAD, which contains the city itself, each region is comprised of a ‘City Rest’ zone (other LADs which are strongly connected to the Core), a ‘Near’ zone (further away from the Core than the City Rest) and a ‘Coast and Country’ zone (furthest away from the Core). Utilising the origin-destination data, any flows that occurred within the constituent part of the of each city region was removed, leaving the inter-zone migration but excluding the intra-zone migration. For example, all flows between the 33 London Boroughs (each of which is a LAD) were removed, leaving just total inflow and total outflow to/from the ‘London Core’ zone. The adjustments to LADs described in the previous section do not impact on these groupings, meaning that data for England, Wales and Scotland are consistent in all four time periods. No data were available for Northern Ireland in 1981 or 1991.
Figure 1. City region geography
2.6. Measures of migration
A broad range of measures have been used to capture patterns and trends in the internal migration system (CitationBell et al., 2002). The maps presented in this study utilise two measures: migration rates offer a snapshot of the intensity of migration for a given area while migration efficiency is a measure of how efficient a force migration is in population redistribution.
Migration rate is calculated for each area
by taking the sum of the in-migration flow from all other areas (
) minus the out-migration flow to all other areas (
), divided by the population of the given area
. This is represented as a net rate of migration per 1000 people which can be positive (denoting population gain) or negative (population loss).
The migration efficiency ratio (
) is the ratio of net migration in area
to the sum of in-migration from all other areas (
) plus out-migration flow to all other areas (
).
Results are constrained to ±100: a value of zero means that in- and out-migration are equally balanced so migration in that area is inefficient as the net effect has no change on overall population size. The higher the score, the more efficient migration is as a force for redistributing population. By way of example, an area with an inflow of 1000 and outflow of 500 would have a value of 33.3. An area with an inflow of 250 and outflow of 1000 would have an
value of −60.
3. Results
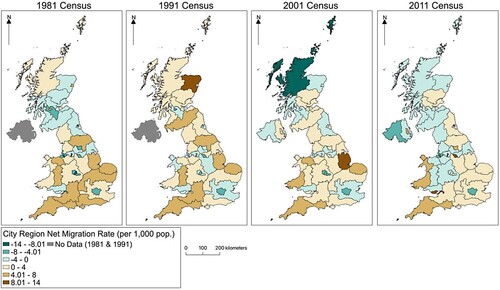
The maps presented in reveal how migration rates have changed in each of the City Region component zones. In the first two decades of 1981 and 1991, most Core city zones have a negative migration rate, with most urban areas losing population to elsewhere in the country. The exceptions in 1981 are the three Scottish city Cores (Aberdeen, Edinburgh and Glasgow) which have positive net migration rates, while in 1991 only Aberdeen Core has a positive rate. By 2001, the fortunes of many Core city zones had reversed and over half show a positive net migration rate, with the exception of Aberdeen, Birmingham, Liverpool, Glasgow, London and Newcastle. The largest swing between 1981 and 2001 is apparent in Manchester Core, which goes from a negative migration rate of 11.8 migrants per 1000 population to a positive rate of 3 per 1000. The 2011 patterns show an almost complete reversal when compared with 1981, with all Core cities, except London, showing a positive net migration rate. Of note are Manchester, Newcastle, Liverpool and Sheffield Core cities, which in 2011 have a positive net migration rate of over 10 per 1000. Net gains in city Near zones fall as the decades progress.
Figure 2. Migration rates for each city region component.
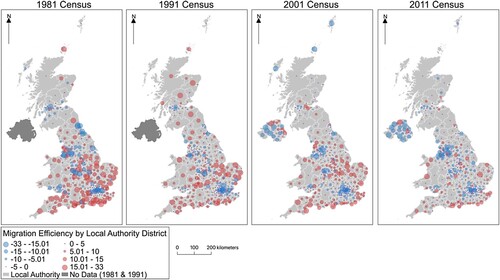
The Migration Efficiency Ratios () presented at LAD scale paint a more detailed picture, with urban loss and rural gain prominent in a very efficient migration system in 1981. There is a notable decline in the number of areas showing the highest efficiency scores (both positive and negative) as the decades progress, with the 2011 efficiencies looking far lower those seen in 1981.
Figure 3. Migration efficiency ratios at LAD scale.
provides a summary of overall Migration Efficiency across all LADs. Notably, the maximum value (i.e. the most efficient LAD for out-migration) in the latter two decades (2001 and 2011) is much lower than those in the first two decades. The minimum value does not vary as much. The mean migration efficiency value declines in each decade, moving from positive in 1981 and 1991 to negative in 2001 and 2011. Standard deviation also declines slightly, suggesting a higher concentration of values around the mean in later years.
Table 1. A summary of migration efficiency values across all LADs.
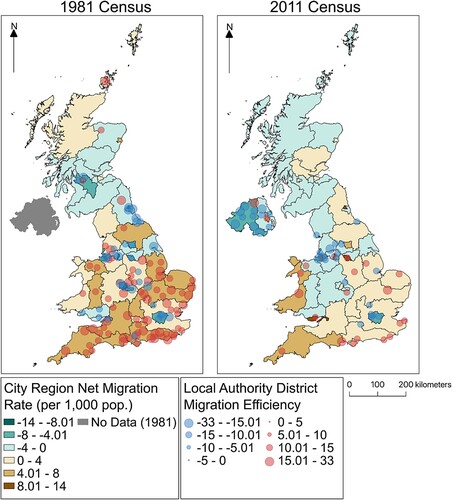
Taking the migration rate at City Region level and the migration efficiency scores at LAD level together demonstrates how smaller areas (1) can have a substantial effect upon their wider region and (2) sometimes exhibit trends which are counter to those seen in the wider region. By way of example, shows this combined view for 1981 and 2011, focusing on just those LADs with efficiency scores of ±10 (i.e. those which are most efficient at gaining or losing population through migration) overlaid atop of the City Region migration rates. There is clearly a large fall in the number of individual LADs with higher efficiency scores between 1981 and 2011. The negative efficiency scores for urban areas seen in 1981 are less prominent in 2011 and the positive efficiency scores for less urban LADs, especially along the south coast of England and in the Midlands and Wales, have declined substantially. Overall, the pattern is one of a far less efficient internal migration system in 2011 than was seen in 1981. These two time points form the beginning and end of the analysis presented in this paper: the main map (see supplementary material) demonstrates the picture for four decades by including the middle two periods of 1991 and 2001.
Figure 4. Identifying the most efficient local authority districts within the city region context, 1981 and 2011.
4. Discussion and conclusion
The maps presented in this paper provide a spatially disaggregated view of the UK’s internal migration system using two different geographies, utilising 1981, 1991, 2001 and 2011 Census data. The decline in overall migration rates at City Region scale and in migration efficiency at LAD scale seen in these maps over four decades is consistent with the headline long term declines in migration propensity reported in CitationChampion and Shuttleworth (2017a). The local area results echo those seen in previous studies, with urban loss and rural gain the predominant pattern in 1981, 1991 and 2001 while a pattern of re-urbanisation emerges in the 2011 data. While these overall trends have been well reported elsewhere (either at more aggregate geographies or for fewer time-periods at LAD scale), by presenting spatially disaggregated results across four decades of census data in a consistent way these maps provide a clear visual representation of how the UK migration system has changed over a prolonged period. It is worth highlighting that the geography at which these results are reported mask variation at a finer spatial resolution, however, a trade-off was required to enable consistent reporting in each time period and ensure that data could be visualised on the maps in a way that is interpretable.
Looking forward, results from the 2021 Census will report on a point in time where the Covid-19 pandemic had a profound impact upon the entire UK population. The 12-month period leading up to census day (21 March 2021), in which people had an opportunity to complete a move and so report a change of address in their census return, was marked by national lockdowns, local authority level tiered restrictions on mobility and substantial delays in the professional services required to complete a home move, such as mortgage lending, conveyancing and home surveys. These factors may contribute to the continuation of the overall decline in migration rates and efficiency seen in the 1981–2011 period. Sub-national patterns may also have changed, a hypothesised shift in migration preference towards more space in less urban locations as a result of the pandemic (CitationNanda et al., 2021) could mark a return to the counter-urbanisation patterns of the 1981–2001 period. Other data, such as the NHS data used as a proxy for migration, are currently only available to mid-2020, so there is not yet evidence which provides a clear and comprehensive picture of internal migration during the pandemic period.
SMS data from the 2021 Census will provide an incomplete picture of the UK migration system owing to the Scottish Census being delayed by one year due to the Covid-19 pandemic. This means that migration within and into England, Wales and Northern Ireland will be reported for the year to March 2021, however, moves within and into Scotland will be reported for the year to March 2022. This discrepancy will have implications for understanding the entire migration system which will result in missing data (as is the case for Northern Ireland in 1981 and 1991 as reported in this paper) and no doubt encourage work to estimate and make consistent the internal migration data, much like the adjustment of previous census migration data (CitationLomax et al., 2013; CitationRees & Duke-Williams, 1997; CitationSimpson & Middleton, 1999).
The value of the migration data reported from the census is its coverage of an entire population and level of detail (both geographical and in terms of attributes reported) which are unrivalled in other datasets. Despite shortcomings as reported in this paper and the unique challenges faced by the latest census, the 2021 data will be eagerly anticipated and essential for better understanding internal migration patterns and propensities during an extraordinary period.
Software
The maps were generated in QGIS v3.14 and finalised in Inkscape v1.0.1.
Main Map
Download PDF (29 MB)Disclosure statement
No potential conflict of interest was reported by the author(s).
Data availability statement
All census data for were downloaded from the Web-based Interface to Census Interaction Data (WICID) platform supported and maintained by the UK Data Service Census Support (https://wicid.ukdataservice.ac.uk/). The data used are freely available for download from this source.
Additional information
Funding
References
- Bell, M., Blake, M., Boyle, P., Duke-Williams, O., Rees, P., Stillwell, J., & Hugo, G. (2002). Cross-national comparison of internal migration: Issues and measures. Journal of the Royal Statistical Society: Series A (Statistics in Society), 165(3), 435–464. https://doi.org/10.1111/1467-985X.00247
- Bell, M., & Charles-Edwards, E. (2015). Internal migration data around the world: Assessing contemporary practice. Population, Space and Place, Query date: 2016-11-15. http://onlinelibrary.wiley.com/doi/10.1002/psp.1848/full
- Boyle, P., & Feng, Z. (2002). A method for integrating the 1981 and 1991 British census interaction data. Computers, Environment and Urban Systems, 26(2–3), 241–256. https://doi.org/10.1016/S0198-9715(01)00043-6
- Champion, T. (1989). Internal migration and the spatial distribution of population. In H. Joshi (Ed.), The changing population of Britain (pp. 110–132). Basil Blackwell.
- Champion, T. (2005). Population movement within the UK. In R. Chappell (Ed.), Focus on people and migration (pp. 91–113). Springer.
- Champion, T., Cooke, T., & Shuttleworth, I. (2017). Internal migration in the developed world: Are we becoming less mobile? Routledge.
- Champion, T., & Shuttleworth, I. (2017a). Are people changing address less? An analysis of migration within England and Wales, 1971–2011, by distance of move: Are people changing address less? Population, Space and Place, 23(3), e2026. https://doi.org/10.1002/psp.2026
- Champion, T., & Shuttleworth, I. (2017b). Is longer-distance migration slowing? An analysis of the annual record for England and Wales since the 1970s: Is longer-distance migration slowing? Population, Space and Place, 23(3), e2024. https://doi.org/10.1002/psp.2024
- Chatagnier, S., & Stillwell, J. (2021). Scale and zonation effects on internal migration indicators in the United Kingdom. Population, Space and Place, 27(6), e2455. https://doi.org/10.1002/psp.2455
- Darlington-Pollock, F., Lomax, N., & Norman, P. (2019). Ethnic internal migration: The importance of age and migrant status. The Geographical Journal, 185(1), 68–81. https://doi.org/10.1111/geoj.12286
- Kalogirou, S. (2005). Examining and presenting trends of internal migration flows within England and Wales. Population, Space and Place, Query date: 2016-11-15. http://onlinelibrary.wiley.com/doi/10.1002/psp.376/abstract
- Lomax, N. (2013). Internal and cross-border migration in the United Kingdom: Harmonising, estimating and analysing a decade of flow data. University of Leeds.
- Lomax, N. (2021). Estimating household mobility using novel big data. In M. Birkin, G. Clarke, J. Corcoran, & R. Stimson (Eds.), Big data applications in geography and planning (pp. 25–42). Edward Elgar Publishing.
- Lomax, N., Norman, P., & Darlington-Pollock, F. (2021). Defining distance thresholds for migration research. Population, Space and Place, 27(4), e2440. https://doi.org/10.1002/psp.2440
- Lomax, N., Norman, P., Rees, P., & Stillwell, J. (2013). Subnational migration in the United Kingdom: Producing a consistent time series using a combination of available data and estimates. Journal of Population Research, 30(3), 265–288. https://doi.org/10.1007/s12546-013-9115-z
- Marvin, S., & Robson, B. (2006). A framework for city-regions. ODPM. https://webarchive.nationalarchives.gov.uk/ukgwa/20070507024923/http://www.communities.gov.uk/pub/588/AFrameworkforCityRegionsResearchReportPDF814Kb_id1163588.pdf
- Nanda, A., Thanos, S., Valtonen, E., Xu, Y., & Zandieh, R. (2021). Forced homeward: The COVID-19 implications for housing. Town Planning Review, 92(1), 25–31. https://doi.org/10.3828/tpr.2020.79
- Rae, A. (2013). English urban policy and the return to the city: A decade of growth, 2001–2011. Cities, 32, 94–101. https://doi.org/10.1016/j.cities.2013.03.012
- Raymer, J., & Giulietti, C. (2009). Ethnic migration between area groups in England and Wales. Area, Query date: 2016-11-15. http://onlinelibrary.wiley.com/doi/10.1111/j.1475-4762.2009.00884.x/full
- Rees, P., & Duke-Williams, O. (1997). Methods for estimating missing data on migrants in the 1991 British census. International Journal of Population Geography, 3(4), 323–368. https://doi.org/10.1002/(SICI)1099-1220(199712)3:4<323::AID-IJPG74>3.0.CO;2-Z
- Rees, P., Durham, H., & Kupiszewski, M. (1996). Internal migration and regional population dynamics in Europe: United Kingdom case study. eprints.whiterose.ac.uk. http://eprints.whiterose.ac.uk/3734
- Rees, P., Norman, P., & Brown, D. (2004). A framework for progressively improving small area population estimates. Journal of the Royal Statistical Society: Series A (Statistics in Society), 167(1), 5–36. https://doi.org/10.1111/j.1467-985X.2004.00289.x
- Shuttleworth, I., Cooke, T., & Champion, T. (2019). Why did fewer people change address in England and Wales in the 2000s than in the 1970s? Evidence from an analysis of the ONS longitudinal study. Population, Space and Place, 25(2), e2167. https://doi.org/10.1002/psp.2167
- Shuttleworth, I., Stevenson, C., Bjarnason, Þ, & Finell, E. (2021). Geography, psychology and the ‘Big Five’ personality traits: Who moves, and over what distances, in the United Kingdom? Population, Space and Place, 27(3), e2418. https://doi.org/10.1002/psp.2418
- Simpson, L., & Finney, N. (2009). Spatial patterns of internal migration: Evidence for ethnic groups in Britain. Population, Space and Place, Query date: 2016-11-15. http://onlinelibrary.wiley.com/doi/10.1002/psp.497/full
- Simpson, S., & Middleton, E. (1999). Undercount of migration in the UK 1991 census and its impact on counter urbanisation and population projections. International Journal of Population Geography, 5(5), 387–405. https://doi.org/10.1002/(SICI)1099-1220(199909/10)5:5<387::AID-IJPG155>3.0.CO;2-F
- Stillwell, J., Bell, M., Blake, M., & Duke-Williams, O. (2000). Net migration and migration effectiveness: A comparison between Australia and the United Kingdom, 1976–96 Part 1: Total migration patterns. Journal of the Australian Population Association, Query date: 2016-11-15. http://link.springer.com/article/10.1007/BF03029446
- Stillwell, J., Bell, M., Blake, M., Duke-Williams, O., & Rees, P. (2001). Net migration and migration effectiveness: A comparison between Australia and the United Kingdom, 1976–96. Journal of Population Research, 18(1), 19–39. https://doi.org/10.1007/BF03031953
- Stillwell, J., Boden, P., & Rees, P. (1994). Internal migration trends in the United Kingdom from National Health Service Reregistration data. Espace Populations Sociétés, 12(1), 95–108. https://doi.org/10.3406/espos.1994.1629
- Stillwell, J., & Duke-Williams, O. (2007). Understanding the 2001 UK census migration and commuting data: The effect of small cell adjustment and problems of comparison with 1991. Journal of the Royal Statistical Society, Query date: 2016-11-15. http://onlinelibrary.wiley.com/doi/10.1111/j.1467-985X.2006.00458.x/full
- Stillwell, J., & Lomax, N. (2017). United Kingdom: temporal change in internal migration. In T. Champion, T. Cooke, & I. Shuttleworth (Eds.), Internal migration in the developed world (pp. 120–146). Routledge.
- Stillwell, J., & Thomas, M. (2016). How far do internal migrants really move? Demonstrating a new method for the estimation of intra-zonal distance. Regional Studies, Regional Science, 3(1), 28–47. https://doi.org/10.1080/21681376.2015.1109473
- Thomas, M., Gillespie, B., & Lomax, N. (2019). Variations in migration motives over distance. Demographic Research, 40, 1097–1110. https://doi.org/10.4054/DemRes.2019.40.38