
ABSTRACT
Population shrinkage has gained attention from academics and policymakers in recent years, due to the long-term implications the phenomenon has for public service delivery and the viability of urban and rural communities. We visualise the socio-temporal evolution of population shrinkage and growth, utilising a spatially rectified dataset containing population data from seven Census of Population covering the 1986–2016 period in the Republic of Ireland. Spatial changes in population distribution are visualised in a map that classifies small administrative units using a spatial typology distinguishing between those experiencing population growth or shrinkage, across the 30-year period. The temporal dimensions of these developments are considered in a sequence of inset maps that apply the same typology to identify the intercensal changes. Overall, the map facilitates the visual communication of long-run population trends, the identification of areas experiencing limited or no growth, and indicates the relative consistency of these trends over time.
1. Introduction
The spatial distribution of population is an important socio-economic indicator (CitationLi et al., 2016). Changes to population distribution have been investigated in many disciplines from different perspectives, including geography, demography, sociology, economics and history (CitationBatunova & Perucca, 2020; CitationLi & Clarke, 2012). In recent years, the issue of population loss or ‘shrinkage’ has gained attention, from policymakers and academics (CitationBatunova & Perucca, 2020). Studies have progressed from focusing on cities (CitationHaase et al., 2014) to regions (CitationGrasland et al., 2008; CitationŠimon & Mikešová, 2014), as shrinkage involves broader regional social and economic systems, not just cities (CitationBatunova & Perucca, 2020). There is also a need to consider the interrelationships between areas that are growing and those that are shrinking (CitationCopus et al., 2021; CitationPiro, 2016). Such analysis requires well-designed cartographic resources that represent populations with sufficient spatial and temporal detail and provide easily readable and interpretable legends (CitationZuniga et al., 2012).
Ireland presents an interesting case study of population change and the associated spatial impacts. These issues have long been of significant public and policy concern due to long-run population decline from the 1840s through to the 1950s and a subsequent period of fluctuating growth rates (CitationDaly, 2006). During 1986–2016, Ireland experienced substantial economic fluctuations, suffering through a recession in the 1980s, experiencing rapid economic expansion (the Celtic Tiger) in the 1990s and early 2000s, a further recession in 2008, and a subsequent period of recovery.
Concerns with the spatial distribution of the population have become increasingly important and gave impetus to the development of the National Spatial Strategy (2002), the National Planning Framework (2018) and the recently published National Rural Development Policy (2021). Each document highlights the widely varying patterns of population change and the consequent challenge of providing for the needs of populations living in shrinking and growing areas. Surprisingly, the most recent policy documents do not present a map of population distribution or change despite these issues underpinning their rational.
We aim to advance understanding of the spatial complexities of population change by visualising the temporal dynamics at a smaller administrative unit level of Electoral Divisions (EDs) – Ireland’s Local Administrative Units 2 (LAU2). Our analysis is valuable as population change statistics reported for larger spatial units can be influenced by changes specific to sub-areas within these units, i.e. city cores, city regions and rural areas (CitationCopus et al., 2021). Using more detailed spatial scales reveal significant differences in population growth/shrinkage both within and between regions (CitationŠimon & Mikešová, 2014). The effect of shrinkage may be hidden at higher spatial/administrative levels but may be visible at fine geographical level (CitationESPON, 2019). CitationStjernberg and Penje (Citation2019) show how the ‘Modifiable Areal Unit Problem’ (MAUP) can affect the identification of shrinking regions. They reveal that most of Denmark is classified as shrinking at grid level, despite the fact most municipalities are classified as growing at the same time. Using Census of Population data for the Republic of Ireland, we visualise through a sequence of choropleth maps the temporal dimensions of aggregate population growth or decline associated with each ED during each intercensal period and produce an overall map covering the entire period which also highlights Ireland’s main cities.
2. Materials and methods
Maps are an invaluable tool in the visualisation and analysis of population changes as the cartographic presentation enables readers, both professional and lay, to make an initial assessment of the rate and direction of changes (CitationCebrykow et al., 2016). To achieve this, we produced a main map representing a typology of changes that occurred between 1986 and 2016, while the intercensal maps apply the same typology to capture the different trends and their associated patterns during the six intercensal periods (1986–1991, 1991–1996, 1996–2002,Footnote1 2002–2006, 2006–2011, and 2011–2016).
2.1. Base materials
The maps are based off shapefiles provided by the Central Statistics Office (CSO) and Ordnance Survey Ireland (OSI) (CitationOrdnance Survey Ireland (OSI), 2017). The shapefile features ungeneralised Electoral Divisions (EDs). In the shapefile, the Shannon estuary is covered by land and EDs. For accuracy, the ED shapefile was clipped using the OSI 250k Sea Area shapefile (CitationOrdnance Survey Ireland (OSI), 2016). This generates the accurate depiction of Ireland’s land mass. As the Republic of Ireland has relatively few large lakes or rivers, a decision was taken to exclude these features from the map. The ED shapefile only contains the Republic of Ireland, not Northern Ireland which is part of the UK. While the analysis focuses on the Republic of Ireland, the decision was made to include Northern Ireland to ensure that the island of Ireland is geographically accurate. The shapefile used is the OSNI Open Data – Largescale Boundaries – NI Outline published by the Ordnance Survey of Northern Ireland (CitationOrdnance Survey of Northern Ireland (OSNI), 2021). Finally, to highlight the location of Ireland in Europe the 2020 Countries 1:60,000,000 shapefile provided by Eurostat GISCO (CitationEurostat GISCO, 2020) was used. The Ireland in Europe inset is in the ETRS 1989 LAEA system.
2.2. Rectifying and preparing the dataset
The statistical data sources used in our analysis are the seven censuses carried out in Ireland during 1986, 1991, 1996, 2002, 2006, 2011, and 2016 (CSO, Citation1986, Citation1991, Citation1996, Citation2002, Citation2006, Citation2011, Citation2016). The results of each census are summarised and reported at a variety of geographic scales ranging from national to Small Areas. Whilst the latter is the smallest spatial unit, these were only introduced following the 2011 Census. To undertake longer-term analysis, it is necessary to use EDs, which have existed since the nineteenth Century. As of the 2016 Census, there are 3440 legally defined EDs in Ireland.
To protect households’ anonymity in EDs with very small populations, EDs with less than 15 households or 50 persons are merged with adjoining EDs for the purpose of reporting census statistics. These are known as Small Area Population Statistics (SAPS). Whilst most merged EDs have remained the same since 1986, there have been several aggregations and a limited number of boundary changes that required additional data processing to ensure comparability between the spatial areas and associated SAPS used in our analysis. Regarding boundary changes, the urban-rural definition between some EDs (e.g. Carlow Urban and Carlow Rural) changed between 1996 and 2002. To ensure comparability of population statistics and spatial units across time in our analysis, the affected EDs were amalgamated into a single unit, e.g. combining Carlow Urban and Carlow RuralFootnote2 into a single unit called Carlow Urban. While the method is not perfect as the urban-rural distinction is lost for some EDs, the resulting EDs and associated population statistics are comparable across time. Several spatial aggregation changes were made during the period in question. Depending on the census year, data for some EDs were reported differently, e.g. Aghalateeve and Aghavoghill were merged as one ED in 2002. However, in 2006 Aghalateeve and Aghnalish were merged, while Aghavoghill was merged with Melvin. These were similarly amalgamated for the purpose of consistency across time. The spatial dataset used in our analysis comprises 3384 EDs out of a total of 3440 EDs, meaning we retain a very significant level of spatial disaggregation. The statistical data are matched to these spatial units to provide a continuous and comparable population change dataset.
2.3. Methods
Initially, the focus of the paper was on population loss and regional shrinkage. There are many different definitions of regional shrinkage within existing literature (CitationSepp & Veemaa, 2017; CitationŠimon & Mikešová, 2014). This paper is more in line with the definition of shrinkage by CitationGrasland et al. (Citation2008) who classified a region as shrinking if it loses a significant proportion of its population over a period equal to or more than one generation (20–30 years). Reflecting this definition, our paper provides an analysis covering a 30-year period from 1986 to 2016. We also examine population loss within the intercensal periods to facilitate the identification of consistency with or divergence from trends and patterns across time.
Rather than a simple binary classification of ‘growing’ or ‘shrinking’ EDs, we applied a typology that reflects the percentage change in population. The classification initially identified EDs that were either growing or shrinking. The shrinkage definition from CitationGrasland et al. (Citation2008) does not specify what qualifies as significant proportion. The definition indicates that shrinkage should not be defined by relatively small negative changes and that exact thresholds (either numerical or proportionate) must be specific to the data and scale of analysis (CitationESPON, 2019). Identifying above average population loss has been implemented in previous work which examined and defined population loss (CitationBatunova & Perucca, 2020; CitationMeredith, 2016). As such, the decision was made to examine population loss as above and below average. The decision was then made to split population growth in a similar manner. While using the same static value would ensure that the categories are symmetrical, we felt that using 16% as the cut-off point for population growth would not properly capture or reflect the trends in population growth. Ireland experienced significant population growth over the 30-year period (CitationCSO, 1986, Citation2016). 2348 EDs (69.4%) experienced population growth between 1986 and 2016, while the rates of population growth tend to be higher than the rates of population loss. As such, there is substantial variance in the levels of population change during this period. Thus, to ensure an accurate depiction of substantial population increase, the decision was made to split the category into above and below average population growth as well. EDs with growing populations were categorised as recording above or below average growth whilst those that shrank, were categorised in terms of above or below average decline. This resulted in five categories of EDs: Substantial increase (>51%), Increase (1–51%), No change, Decrease (−1 to 15%), and Substantial decrease (≤−16%). Increase ranges from 1 to 51%, and substantial increase covers all values greater than 51%. The reason we use greater than (>) for substantial increase and less than or equal to (≤) for substantial decrease, is that the GIS software only allows for setting upper band limits (i.e. −16% for substantial decrease and 51% for increase). There are very few EDs that experience no population change in each map (14 in 1986–2016, 42 in 1986–1991, 45 in 1991–1996, 38 in 1996–2002, 32 in 2002–2006, 23 in 2006–2011, and 48 in 2011–2016). This category was included so we did not misrepresent EDs as either shrinking or growing. Categorisation in each map is determined by the population change during the respective period, e.g. while the categories have the same thresholds across each period (e.g. ≤−16%, −1% to 15%, No change, 1%–51%, and >51%), in the 1986–1991 map, categorisation is determined by the population change during the period 1986–1991. In the 1991–1996 map, categorisation is determined by the population change during the period 1991–1996. Maintaining consistency in the categories’ definition is beneficial for comparing different intercensal periods. Readers can identify the contribution of each intercensal change on the overall map, e.g. a substantial decrease in 1986–1991 may ensure that an ED lost population over the entire 30-year period, even if it experienced population increase post-1991. However, it must be noted that, mathematically, the cumulative effect is asymmetrical, i.e. a +50% increase in 1986–1991 followed by a −50% decrease in 1991–1996 does not result in the overall population returning to the original amount (in this example, 1986). There is a potential bias even in random fluctuations around a constant size for positive growth rates to be nominally higher than the negative growth rates (e.g. −50% followed by +100% results in no change).
The main map includes inset maps of the five main cities in Ireland (Dublin, Cork, Limerick, Galway, and Waterford), enabling a city-level analysis in Ireland. The insets are not of a standardised scale due to the varying city sizes. Attempts were made to standardise the scale; however, it was not cartographically viable. e.g. Dublin is a relatively large city, while the other cities are smaller. The boxes provide an indication of the city’s respective scales whilst scalebars are also included in each of the inset maps to convey this information.
2.4. Design
A map’s design is crucial as effective visualisation is typically the first step to understanding a spatial phenomenon (CitationLi & Clarke, 2012). In developing the map, we took into consideration several issues, starting with the need to convey both the intercensal and aggregate change over the 30-year period for different categories of ED. We were particularly conscience of the need for some users for a printed map that was easy to produce, share and display. This led to the choice of a choropleth map in A3 landscape format with a scale of 1:1,750,000. The aggregate population change between 1986 and 2016 forms the main section, whilst the intercensal maps arranged in temporal sequence along the map’s left-hand side at a scale of 1:7,000,000. The layout and design choice for our map takes inspiration from the maps designed by CitationZuniga et al. (Citation2012) and (CitationParreño-Castellano et al., 2021). Our layout lends itself to an initial assessment of overall change, a more detailed reading of intercensal changes and their contribution to the aggregate change, and finally, a consideration of change in Ireland’s main cities.
Many possible colour schemes can be used to represent population change. CitationŠimon and Mikešová (Citation2014) use a colour scheme with blue representing population loss and red representing population growth with various colours, shades, and hues in between. CitationZuniga et al. (Citation2012) use red, orange, yellow, and green, with the scale ranging from dark red (population gain) to dark green (population loss). We do not use red-green gradient to avoid any potential colour-blindness issues which may hamper the interpretation of colour encoded information (CitationGeissbuehler & Lasser, 2013). CitationSchiewe (Citation2019) found evidence to suggest a dark-is-more-bias when colours are used in maps. Essentially, individuals tend to assume a darker colour represents a higher number, while lighter colours are thought to represent lower numbers. To account for this tendency, we choose to represent population growth in darker colours, while we use lighter colours for population loss. A pastille, magma colour hue is implemented. The ‘substantial decrease’ category is represented by yellow, ‘decrease’ by a pastille orange hue, ‘no change’ is represented by grey, whilst ‘increase’ and ‘substantial increase’ are represented by purple and dark purple, respectively.
3. Results
The main map reflects the fact that the majority of EDs experienced population growth between 1986 and 2016, with those proximal or accessible to larger urban centres, generally experiencing increases. EDs experiencing decreases over the period are more peripherally located from Ireland’s major urban areas. 1022 EDs (30%) lost population between 1986 and 2016. The standardised classification of the level of change across the intercensal maps and main map allows for direct comparisons. EDs experiencing population loss between 1986 and 2016 recorded persistent shrinkage across the intercensal periods. The map shows how population loss is largely associated with EDs in the west and midlands of Ireland.
The intercensal maps offer valuable insight into the dynamic nature of population trends in Ireland. The 1986–1991 intercensal map depicts widespread population decline and captures the effects of the unprecedented recession that Ireland faced during the 1980s. Ireland’s population decreased by 14,924 between 1986 and 1991 (CitationCSO, 2020), while the estimated net migration figure was −134,170 (CitationCSO, 2020). 2211 EDs (approximately 65%) experienced population loss during this period. The issue of population loss persisted in many peripherally located EDs during 1991–1996, though, overall, there were less EDs experiencing population decline, relative to the preceding census period. The challenge of population loss persists in a set of EDs. These tend to be in more rural regions with weak urban structures or limited accessibility to the major cities, i.e. Dublin, Cork, Galway, Limerick, and Waterford. Overall, however, our analysis highlights that compared to the previous period, many EDs reversed their population loss trends ().
Figure 1. The spatiotemporal dimension of population change in Ireland: Visualisation of growth and shrinkage in Irish Electoral Divisions (1986–2016).
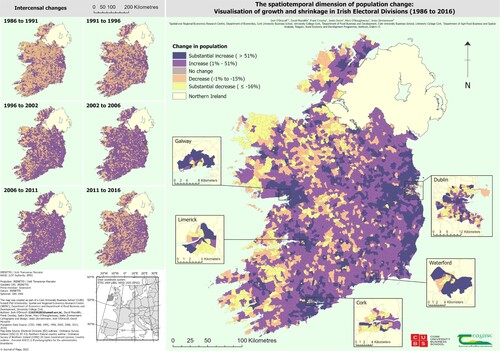
The 1996–2002 and 2002–2006 maps capture the Celtic Tiger period in Ireland. During these two intercensal periods, Ireland saw a fall in the number of EDs experiencing population loss. This period was characterised by significant economic growth, increase in employment opportunities and positive net migration, particularly in the early 2000s (CitationFahey et al., 2007). Much of this growth was concentrated in the cities and the surrounding regions with resulting impacts on population growth in these areas. Notwithstanding the scale of economic expansion and associated population growth, there were EDs that continued to lose population throughout this period. Many EDs that lost population had already previously lost population, showing the issue of population shrinkage was persistent in some parts of Ireland.
The 2006–2011 map captures a socio-economically volatile period in recent Irish history: the tail end of the Celtic Tiger, collapse of the banking system and a subsequent recession. Despite the recession occurring during this period, Ireland still experienced an overall population increase between 2006 and 2011 (see ), with positive net migration (see ). The majority of EDs experienced population increases, with population decreases occurring mainly in the west and midlands.
The number of EDs which experienced population loss increased during the 2011–2016 period with an estimated national net migration of −24,669 (CitationCSO, 2020). This reflected the impact of the recession in Ireland. Though the national population continued to grow throughout this period, the rate of increase was substantially reduced (see ). Population decline affected many EDs that had experienced growth during the preceding 20 years. During this time, the unemployment rate rose from 4.8% in 2007 to its peak of 15% in 2012 (CitationCSO, 2017). Outward migration during this period can be largely attributed to the recession as people emigrated for employment opportunities.
Table 1. Components of population change – change in population since previous census (1986–2016).
The inset maps show many EDs within cities have also experienced both shrinkage and population increases. Dublin displays a ring pattern of population decreases surrounding the city centre. In contrast, many EDs, particularly in the very centre of Dublin, have experienced substantial population increases. Cork and Limerick also experienced both shrinkage and population increases, with both substantial decreases and increases experienced across some EDs from 1986 to 2016. Galway and Waterford experienced population decreases and substantial decreases in their city centres with a general pattern of population increases and substantial increases in the surrounding areas ().
Table 2. Components of population change – estimated net migration (1986–2016).
4. Discussion
This paper presented a process for visualising population change using a spatially rectified dataset of small area population statistics that facilitates the visualisation of both long-run and intercensal changes. The scope of this study concerned representation of changes in the spatial distribution of the population in Ireland over a period of 30 years, from 1986 to 2016. The map consists of two series (the full period and the intercensal), which provide different temporal perspectives using a consistent typology to represent growth and shrinkage. Whilst the former areas are primarily accessible to larger towns and urban centres, the latter are predominantly located in areas that are remote or inaccessible to these places. There are, however, EDs within the cities experiencing shrinkage. The series of intercensal maps show the impact of two recessions (1986–1991 and 2006–2011 maps) and the expansionary period of the ‘Celtic Tiger’ (1996–2002, and 2002–2006 maps). The maps demonstrate the influence of economic crises on Ireland’s population, illustrated by the extensive nature of population change during the 1980s and 1990s (1986–1991 and 1991–1996 maps) and the 2011–2016 map. The combination of the overall and intercensal change data on a single map highlights the temporal dimension of population change and how these processes play out in different ways.
Future research is required in two areas, firstly to establish whether the processes underpinning urban and rural shrinkage are the same, or, if they differ, in what way. The findings from such research will be important to the design of policies targeting rural and urban areas, and in identifying if very different policy interventions are required across these spatial types. The second area of research should examine the changing distribution of specific groups or subgroups (i.e. age groups or gender). Any such work should consider the spatial dimensions of the life courses associated with younger and older cohorts to understand changes in spatial relations and how these affect population change over time. Potential factors driving the changes, could include economic, sociodemographic, or geographical factors. Empirical work is required to understand the precise relationship each factor has on population change, and the extent of their contributions across Irish EDs.
Software
The maps were generated and realised in ArcGIS Pro 2.8.2.
Supplemental Material
Download Zip (2.8 MB)Acknowledgements
The authors would like to thank the reviewers of this map and paper for their insight and comments that improved the paper and map. We, the authors, hereby assign worldwide copyright of the work in all forms and media (whether now known, or hereafter developed), in all languages for the full term of copyright and all extensions and renewals thereof.
Disclosure statement
No potential conflict of interest was reported by the author(s).
Data availability statement
Raw Census of Population data is available from Central Statistics Office (CSO) and Irish Social Science Data Archive (ISSDA). Rectified dataset is part of funded PhD and not yet available to share.
Correction Statement
This article was originally published with errors, which have now been corrected in the online version. Please see Correction (https://doi.org/10.1080/17445647.2023.2184957)
Additional information
Funding
Notes
1 This deviation was due to the foot-and-mouth disease outbreak in 2001 and subsequent postponement of the census for 12 months (see: https://www.cso.ie/en/census/census2021postponementfaq/).
2 While the region’s title is Carlow Rural the region itself is the area immediately surrounding Carlow town and does not comprise the rural elements of Co. Carlow.
References
- Batunova, E., & Perucca, G. (2020). Population shrinkage and economic growth in Russian regions 1998–2012. Regional Science Policy and Practice, 12(4), 595–609. https://doi.org/10.1111/rsp3.12262
- Cebrykow, P., Krukowski, M., Flaga, M., & Kałamucki, K. (2016). Changes in the population distribution in Poland in the years 1946–2012. Journal of Maps, 12(4), 655–658. https://doi.org/10.1080/17445647.2015.1060178
- Copus, A., Kahila, P., Dax, T., Kovács, K., Tagai, G., Weber, R., Grunfelder, J., Meredith, D., Ortega-Reig, M., Piras, S., & Löfving, L. (2021). European shrinking rural areas: Key messages for a refreshed long-term European policy vision. Terra: Revista De Desarollo Loca, 8(8), 280–309. https://doi.org/10.7203/terra.8.20366
- CSO. (1986). Census of population 1986. Retrieved January 15, 2021. https://www.ucd.ie/issda/data/censusofpopulation/
- CSO. (1991). Census of population 1991. Retrieved January 15, 2021. https://www.ucd.ie/issda/data/censusofpopulation/
- CSO. (1996). Census of population 1996. Retrieved January 15, 2021. https://www.ucd.ie/issda/data/censusofpopulation/
- CSO. (2002). Census of Population 2002. Retrieved January 15, 2021. https://www.cso.ie/en/census/census20062002and1996/2002censussmallareapopulationstatisticssaps/census2002sapsforelectoraldivisions/
- CSO. (2006). Census of population 2006. Retrieved January 15, 2021. https://www.cso.ie/en/census/census2006smallareapopulationstatisticssaps/sapsforelectoraldivisionsprovinceandcounty/
- CSO. (2011). Census of population 2011. Retrieved January 15, 2021. https://www.cso.ie/en/census/census2011smallareapopulationstatisticssaps/
- CSO. (2016). Census of population 2016. Retrieved January 15, 2021. https://www.cso.ie/en/census/census2016reports/census2016smallareapopulationstatistics/
- CSO. (2017). Sustainable development indicators Ireland 2017. https://www.cso.ie/en/releasesandpublications/ep/p-sdii/sustainabledevelopmentindicatorsireland2017/soc/#:~:text=The unemployment rate fell from 17.1%25 in 1986,in 2016.3.3Ireland%3A Emigration and immigration 1987-2016
- CSO. (2020). Components of population change since 1926. https://ws.cso.ie/public/api.restful/PxStat.Data.Cube_API.ReadDataset/C0401/XLSX/2007/en%0A
- Daly, M. (2006). The slow failure: Population decline and independent Ireland, 1920–1973. University of Wisconsin Press.
- ESPON. (2019). Inception report ESCAPE European shrinking rural areas: Challenges, actions and perspectives for territorial governance.
- Eurostat GISCO. (2020). Countries 2020 1:60,000,000, EN: © EuroGeographics for the administrative boundaries. Retrieved September 7, 2021. https://ec.europa.eu/eurostat/web/gisco/geodata/reference-data/administrative-units-statistical-units/countries
- Fahey, T., Russell, H., & Whelan, C. T. (2007). Best of times? The social impact of the Celtic Tiger. Institute of Public Administration.
- Geissbuehler, M., & Lasser, T. (2013). How to display data by color schemes compatible with red-green color perception deficiencies. Optics Express, 21(8), 9862–9874. https://doi.org/10.1364/oe.21.009862
- Grasland, C., Ysebaert, R., & Corminboeuf, B. (2008). Shrinking regions: A paradigm shift in demography and territorial development. Study for Directorate-General for Internal Policies of the Union, Policy Department B: Structural and Cohesion Policy, European Parliament. Brussels: European Parliament. http://www.europa.eu/thinktank/en/document.html?reference=IPOL-REG_ET(2008)408928
- Haase, A. D., Grossmann, K., Bernt, M., & Mykhnenko, V. (2014). Conceptualizing urban shrinkage. Environment and Planning A, 46(7), 1519–1534. https://doi.org/10.1068/a46269
- Li, L., & Clarke, K. C. (2012). Cartograms showing China’s population and wealth distribution. Journal of Maps, 8(3), 320–323. https://doi.org/10.1080/17445647.2012.722792
- Li, S., Juhász-Horváth, L., Harrison, P. A., Pintér, L., & Rounsevell, M. D. A. (2016). Population and age structure in Hungary: A residential preference and age dependency approach to disaggregate census data. Journal of Maps, 12(sup1), 560–569. https://doi.org/10.1080/17445647.2016.1237898
- Meredith, D. (2016). The challenges facing rural communities.
- Ordnance Survey Ireland (OSI). (2016). Sea area – OSi National 250k Map of Ireland. Retrieved March 15, 2021. https://data.gov.ie/dataset/sea-area-osi-national-250k-map-of-ireland2?package_type=dataset
- Ordnance Survey Ireland (OSI). (2017). CSO electoral divisions ungeneralised – OSi national statistical boundaries – 2015. Retrieved January 15, 2021. https://data.gov.ie/dataset/cso-electoral-divisions-ungeneralised-osi-national-statistical-boundaries-20151?package_type=dataset
- Ordnance Survey of Northern Ireland (OSNI). (2021). OSNI open data – largescale boundaries – NI outline. https://www.opendatani.gov.uk/dataset/osni-open-data-largescale-boundaries-ni-outline
- Parreño-Castellano, J. M., Moreno-Medina, C., Domínguez-Mujica, J., & Santana Rivero, C. (2021). Mapping foreign immigration in Spain (1998–2018). Trends and spatial patterns. Journal of Maps, 17(1), 78–83. https://doi.org/10.1080/17445647.2020.1866700
- Piro, R. (2016). Parallel patterns of shrinking cities and urban growth: Spatial planning for sustainable development of city regions and rural areas. Routledge.
- Schiewe, J. (2019). Empirical studies on the visual perception of spatial patterns in choropleth maps. Journal of Cartography and Geographic Information, 69(3), 217–228. https://doi.org/10.1007/s42489-019-00026-y
- Sepp, V., & Veemaa, J. (2017). Shrinking regions and innovative solutions: Entrepreneurship, employment and the accessibility of services.
- Šimon, M., & Mikešová, R. (2014). Population development and policy in shrinking regions: The case of Central Europe.
- Stjernberg, M., & Penje, O. (2019). Population change dynamics in Nordic municipalities: Grid data as a tool for studying residential change at local level. Nordisk ministerråd.
- Zuniga, M., Pueyo, A., & Calvo, J. L. (2012). The Spanish population during the twentieth century and beyond. Journal of Maps, 8(4), 386–391. https://doi.org/10.1080/17445647.2012.744364