
 ?Mathematical formulae have been encoded as MathML and are displayed in this HTML version using MathJax in order to improve their display. Uncheck the box to turn MathJax off. This feature requires Javascript. Click on a formula to zoom.
ABSTRACT
The model of optimal utilization of arable land presents a new way of farming evaluation. The main map sheet consists of four parts, which logically follow each other. The first part shows which natural conditions (general soil and climatic character, local risk of water erosion) were taken into account in the creation of model crop rotations. The resulting production of biomass according to these crop rotations follows (part 2). The third part evaluates the production, consumption and biomass balance of crop groups in terms of self-sufficiency (food, feed and energy needs). The impact of biomass production on soil quality, according to the balance of soil organic matter, is shown in Part 4. This returns the cycle to the natural conditions of biomass production. The resulting map, therefore, shows a state in which the soil is sufficiently protected against water erosion and the biomass production is sufficient to cover all needs.
1. Introduction
At present, there are often contradictory expectations concerning the use of agricultural land. On one hand, there is a growing pressure on increasing the use of agricultural biomass for energy purposes (Directive 2009/28/EC; CitationMIT CR, Citation2015), as well as, on increasing agricultural production with decreasing area of agricultural land (CitationJørgensen, Citation2010). On the other hand, the negative impacts of climate change are becoming increasingly apparent (in particular drought: CitationTrnka et al., Citation2015; CitationZahradníček et al., Citation2015) and the efforts to make agriculture more environmentally friendly are increasing (e.g. standards of Good Agricultural and Environmental Conditions) and as a result mitigating negative impacts on landscape and biodiversity (in particular the pressure to reduce the consumption of plant protection products). CitationRumpel et al. (Citation2018) draw attention to the need to halt the loss of soil carbon (organic matter) and restore degraded soils (e.g. through green manure and the cultivation of cover crops), with 10–60 million km2 on Earth (up to 40%). If this soil were restored, it could help to absorb 9–19% of global CO2 emissions (within the period of 25–50 years; CitationRumpel et al., Citation2018).
Knowledge of potentials and limits in the regional context is the key to objectify land use decisions. The need to develop regional strategies for increasing the amount of soil carbon (organic matter) is also highlighted by CitationRumpel et al. (Citation2018) – it is necessary to take into account local soil types, climatic conditions including their changes and socio-economic context. This paper presents a contribution to the topic of land use and soil protection on the example of the Central European country, Czechia.
The map of the optimal use of arable land with regard to food self-sufficiency and soil protection in this article presents a new way of evaluating agricultural land management. It contains information on potential (model) biomass balance on arable land and information on the impact of farming on soil organic matter balance. The resulting map gives a more comprehensive view of biomass production in the context of soil protection. In addition to the information on agriculture (crop production, feed consumption), the map also reflects existing requirements for the use of biomass for energy purposes (biogas plants, biothermal plants).
A similar issue has been addressed in several previous articles. A geographically explicit assessment of the potential of biomass for energy production (in particular switchgrass and short-rotation woody crops) and existing biodiesel and ethanol plants in the United States was made by CitationPorter et al. (Citation2009). The motivation, in this case, was to strengthen the energy security of the country dependent on oil imports from other parts of the world. The geographical context of this article is closer to the second study. CitationVilček and Koco (Citation2018) used point-index value of agricultural land and potential production of biomass/bioenergy to assess production potential of agricultural land in Slovakia. Furthermore, the potential of soil for providing non-production functions as well as the degree of soil vulnerability (and thus the functions provided by this soil) – water erosion, compaction, instability of the humus horizon were evaluated. The result was an integrated evaluation of soil quality in Slovakia, where a similar database to the one in Czechia is available.
2. Material and methods
Data on natural conditions affecting the amount of agricultural production on arable land and thus the ability of this land to contribute to ensuring food self-sufficiency are essential in order to create a map of optimal use of arable land. The source of data is a system of Evaluated Soil-Ecological Units (data as of 1 November 2018), which synthetically expresses the production capacity of the soil. The evaluation system consists of the climate region, the main soil unit, the inclination and exposure, soil stoniness and depth (see CitationNovotný & Vopravil, Citation2013).
Agricultural production (for food, feed and other purposes) is not the only criterion for optimal use of arable land. Emphasis was placed on soil protection, specifically on reducing soil degradation by water erosion. Erosion is quantified using the Universal Soil Loss Equation USLE (CitationWischmeier & Smith, Citation1965, Citation1978) in a modified form (CitationNovotný et al., Citation2015). This equation was used, for example, to evaluate the need for soil protection against water erosion in Czechia (CitationNovotný et al., Citation2016; all its parts are described in detail here).
Data layers of the agricultural parcels (see CitationECA, Citation2016) and their erosion risk (expressed by CPmax, which is the maximum permissible value of the vegetation protection factor and erosion control measures) were used in the map processing. First, the median CPmax for each parcel was calculated using ArcMap 10.4 software.Footnote1 Intersect was then carried out with a layer of Evaluated Soil-Ecological Units – which allowed the assessment of soil production potential and the risk of erosion at the same time.Footnote2
2.1. Crop rotations for optimum use of arable land
A model crop rotation was assigned for each parcel. The crop rotation types: ‘classical’ and ‘soil-protective’, for parcels threatened by water erosion, were developed with regard to soil and climatic conditions, i.e. according to agricultural production areas: maize + beet, cereal, potato, fodder crops (CitationIAEI, Citation1996; see Annex).
In order not to exceed the permissible level of erosion risk, the crop rotation must meet the inequation: , where
is the cover and management factor of the crop rotation,
is the support-practice factor, i.e. the effect of erosion control measures,
is the value of required protective vegetation influence and erosion control measures, in relation to tolerable mean annual soil loss (CitationNovotný et al., Citation2016). Since the application of erosion control measures was not considered, the support-practice factor P equals 1 and in the following inequations (see below) it is no longer included. When selecting the crop rotation, one of three options may occur: (1) A parcel is assigned the classical crop rotation (for soil and climatic conditions concerned) if
, where
is the average annual value of the cover-management factor for the whole crop rotation (classical) and
is the median value of the required protective vegetation influence and erosion control measures (of a given parcel). (2) If it is not possible to assign a classical crop rotation to a parcel, the soil-protective crop rotation is used if
, where
is the average annual value of the cover-management factor for the whole crop rotation (soil-protective). (3) If the erosion risk of the parcel does not allow the use of even the soil-protective crop rotation, the grassing of the parcel is proposed, i.e. the establishment of perennial grasses on arable land.Footnote3
2.2. Biomass balance: production and consumption
Agricultural biomass production is made up of the main and by-product (especially straw) of crops in model crop rotations, which are compiled for individual regions of Czechia according to their soil and climatic conditions (so-called agricultural production areas). Crop yields (see CitationHakl et al., Citation2014) are based on the climate region and the main soil unit – these characteristics form part of the Evaluated Soil-Ecological Units (ESEU; see CitationNovotný & Vopravil, Citation2013) system.Footnote4 These are the yields of the main product (i.e. without straw, etc.) in net mass. Yield data of all crops was assigned to the appropriate ESEU codes. For selected crops (cereals, rapeseed), by-product yields were also calculated as a ratio to the yield of the main product.Footnote5 Subsequently, average annual crop yields (as well as average total annual agricultural production and average annual soil organic matter balance, see below) were calculated for all combinations of crop rotations and ESEU codes. All values are given in t ha−1 year−1 (or t SOM ha−1 year−1).
Consumption of agricultural biomass is determined by a model that identifies consumer groups and quantifies their consumption in each crop group (see ). The consumption model quantifies all known relationships between production and consumption of agricultural biomass. Model biomass consumption consists of the need for food security crops, the provision of feed for existing livestock, the operation of existing biogas stations and biothermal plants, taking into account harvest and processing losses and ensuring the need for seeds.
Figure 1. Agricultural biomass production, consumption and balance in Czechia (net mass). Source: authors’ calculations according to the optimal model utilization of arable land.
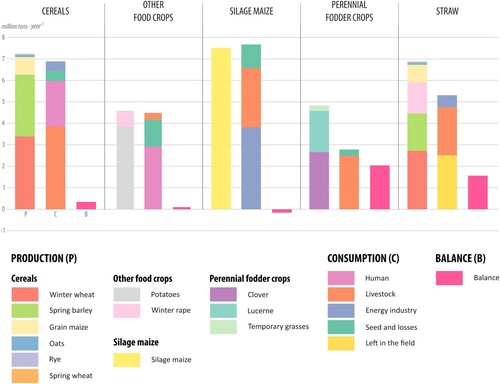
For the production of foodstuffs, only the production of the first two categories of biomass (cereals; potatoes and winter rape) is considered. The amount is determined as a proportion of the total yield of the main product of each crop (e.g. winter wheat – 26%). The total volume of biomass for food self-sufficiency is the sum of the shares of all crops in the relevant categories.
Livestock consume all categories of agricultural biomass. Total consumption is a function of the number of animals (by species and categories of animals) and their feed rations. The number of animals is based on the ‘Central Register of Livestock’.Footnote6 In terms of species, the model considers consumption: cattle (in more detailed breakdown), sheep, goats, pigs and poultry. For all species and categories of animals listed, feed rations per day are set. For straw, the model also considers its use as bedding. The actual straw consumption for bedding is unknown. The model, therefore, assumes that animal husbandry is: 50% litterless (producing liquid manure), 25% on deep bedding and 25% on economical bedding. The value in the represents the total biomass consumption for feed and bedding for all animals per feed year.
Existing technologies that use biomass for energy purposes include biogas plants and biothermal plants. Their actual consumption (quantity and structure) is unknown, so they have been replaced by models. The models determine biomass consumption in dry matter per 1 MW of installed capacity per year. For biogas plants consumption is expected: liquid manure (8% = 11,500 t year−1), wheat (24% = 1400 t year−1) and silage maize (68% = 12,200 t year−1). For biothermal plants, each installed MW is expected to consume 500 tonnes of straw in dry matter per year.
The amount of biomass for seeds and losses is, as in food production, determined by the proportion of the yield of the main product of each crop (e.g. potatoes: 15% seedlings, 17% losses; wheat: 4% seeds, 2% losses). Losses include losses during harvesting and storage. The total amount of biomass for seed and loss coverage is the sum of all crops in the relevant categories.
The biomass balance is based on the quantification of potential production and model consumption. The difference then gives the information on the biomass balance in the region, which can be used e.g. for energy or other purposes.
2.3. Soil organic matter balance
The balance of soil organic matter (SOM) describes how the selection of crops and agricultural technologies affects the SOM content (without additional fertilization). It is determined by a balance estimate according to the methodology of the Crop Research Institute (CitationKlír, Citation2019; based on CitationŠkarda, Citation1989). Laboratory analysis of inputs and outputs has not been performed. It is based only on model crop rotations. The balance is calculated as the difference between the supply and the loss of SOM. It can be positive, balanced, or negative. The methodology makes it possible to take into account the effect of the application of organic fertilizers and green manure but this paper presents the results without fertilization because of the lack of detailed data on its use. The organic matter balance can thus serve as an indicator of the effect of farming on soil quality without taking into account the effect of additional fertilization.
The methodology is based on the knowledge that: (a) growing crops cause the loss of SOM, (b) post-harvest residues and dead parts of plants supply SOM. The values of loss and supply of SOM vary according to the crops and their representation in the crop rotation. From this point of view, crops can be divided into three groups: (1) grains and oilseeds, (2) root crops, vegetables and annual fodder crops, (3) perennial fodder crops. The loss or need for the supply of crop rotation (NSSOM) depends on the share of these crop groups in the crop rotation (CitationKlír, Citation2019).
SCG1,2,3 – share of crop groups in the crop rotation (%).
Grains and oilseeds cause a loss of up to 1.7 t SOM ha−1 year−1 when fully represented in the crop rotation. By leaving by-products (straw) in the field, they can eliminate this loss. Crops with a higher straw yield (rapeseed, triticale, rye and oats) also reach a significantly positive balance. However, straw is used as feed and litter for livestock, or in energy industry. The balance, therefore, depends in particular on the amount of by-product left on the soil surface. The crops in the second group (root crops, vegetables, annual fodder crops) are significantly unfavourable from the point of view of the SOM balance. These are harvested (almost) as a whole and thus leave few post-harvest residues on the soil, which also have a low proportion of SOM. When fully represented in the crop rotation, they cause a loss of up to 3.11 t SOM ha−1 year−1, which they cannot eliminate (except for maize for grain). The SOM balance is thus significantly negative for them. On the contrary, the last group of crops (perennial fodder crops) is very favourable from the point of view of the SOM balance. Even if the crops are harvested as a whole, they do not cause loss of SOM. They achieve the highest effect when represented by above 30%. When fully represented, they are able to supply up to 3.63 t SOM ha−1 year−1. On the contrary, below 13%, their effect is already neutral.
The supply of SOM (SSOM) depends mainly on the amount of by-product and post-harvest residues left on the soil surface (CitationKlír, Citation2019).
ABP – area of crop on which post-harvest residues are left on the soil surface (ha); YBP – by-product yield (t ha−1 year−1); PSOM – proportion of SOM in the by-product (/).
The yield of the by-product depends on the crop and the environmental conditions in the growing season (soil, water, temperature). Grain straw is used in animal production (feed and litter), or in energy (heating plants). Post-harvest residues from potato and sugar beet cultivation usually remain on the soil. However, their amount and SOM content in them is low (0.1). Conversely, the SOM content of grains and oilseeds is significantly higher (0.8).Footnote7
It follows from the above mentioned that the overall balance of SOM depends mainly on the structure of crops in the crop rotation and the ability of the region to use by-products of crop production (straw) outside agricultural land.
3. Results
The model of optimal utilization of arable land presents a new way of farming evaluation. The uniqueness of the map published here lies in its very detailed scale of processing, which allows evaluation at the level of parts of agricultural parcels (in Land Parcel Identification System) defined according to erosion risk. Another important element is the quantification of the effect of farming on the soil organic matter balance, which has not yet been processed to such an extent and in such a great detail in Czechia.
The resulting map shows a state in which the soil is sufficiently protected against water erosion and the biomass production is sufficient to cover all needs. The main map sheet consists of four parts, which logically follow each other. The first part shows which natural conditions (local risk of water erosion; general soil and climatic character – so-called agricultural production areas) were taken into account in the creation of model crop rotations. Classical crop rotations occupy 87.6% of the area of arable land, soil-protective 11% and grassing 1.4%.
The main map window (part 2) shows the average annual crop production of a given optimum crop rotation for each parcel (t ha−1 year−1 in the net mass of biomass of the main products, i.e. without straw, etc.). The benefit of the map is processing of very detailed data. The production potential of each agricultural parcel is linked to the yields of individual crops.
The third part evaluates the production, consumption and biomass balance of crop groups in terms of self-sufficiency. It presents aggregate values for the entire country. By subtracting consumption from production, the resulting biomass balance is obtained. In a similar way, the data for was obtained, which provides detailed information on individual crops represented in optimal crop rotations and the information on biomass consumers. The total annual biomass surplus is 3.91 million tons. However, there is a slight shortage of biomass in silage maize. For the purpose of feeding animals, silage maize may be replaced by perennial fodder crops. The lower production of maize, which is one of the erosion-prone crops, is due to its significantly lower proportion in model crop rotations compared to real sowing areas (see ).
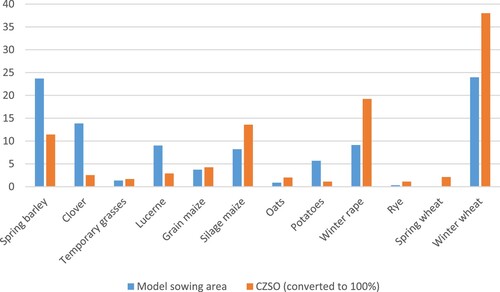
Figure 2. Share of crops on arable land in % (on sowing areas for CZSO data). Source: CitationCZSO (Citation2014–2018).
The impact of biomass production on soil quality, according to the average annual balance of soil organic matter (without fertilization), is shown in Part 4. This returns the cycle to the natural conditions of biomass production. By-product (straw) is included in the organic matter balance according to the agrotechniques used (straw harvested or left in the field). The balance of soil organic matter is evaluated separately for each crop rotation region. Without added fertilization, the average balance of SOM is −0.04 t ha−1 year−1 in Czechia. The negative balance of SOM can be improved by organic fertilization. By applying organic fertilization (manure, slurry, digestate) the SOM balance will be significantly improved, on average to 0.82 t SOM ha−1 year−1.
The biggest differences in biomass production and the balance of soil organic matter are caused by the different structure of crops in individual crop rotations. The individual crops have significantly different average yields of the main product (from 3 to 36 t ha−1 year−1).Footnote8 This should be taken into account when interpreting the results on the map. Different values of the ratio of the main and by-product then enter into the calculation of the balance of soil organic matter which range from 0.2 to 2.2. Differences in the content of organic matter in the by-product play a much smaller role. According to the methodology used, the relatively largest amount of organic matter is supplied to the soil by grain maize (due to very high yields of the main product) and winter rape (due to the high ratio of by-product to main product).
Differences in biomass production (as well as the balance of soil organic matter) within the area of one crop rotation are due to different fertility of agricultural parcels.
4. Conclusion
The map of optimal use of arable land with regard to food self-sufficiency and soil protection will find application in strategic and decision-making processes of public administration at both national (ministries) and regional (e.g. regional energy concepts) level, especially in optimizing the utilization of biomass potential from agricultural land ensuring long-term sustainability of farming. Consumer needs are met according to their priority: (1) people, (2) animals, (3) energy. Thus, food self-sufficiency is not reduced by the potential use of biomass for energy purposes.
The use of model crop rotations (soil-protective as well as classical) leads to a more favourable composition of crops in terms of soil protection. Compared to real sowing areas (CitationCZSO, Citation2014–2018), fodder crops (clover, lucerne) as well as spring barley and potatoes are significantly more represented; on the other hand, silage maize, winter rape and winter wheat account for a significantly smaller share (). The fundamental importance of the use of soil-protective crop rotations (or grassing) is confirmed by a comparison with data on the long-term average annual soil loss (CitationRISWC, Citation2018). These crop rotations are used on soil extremely endangered by water erosion: the long-term average annual soil loss (A) on grassed areas is 40 t ha−1 year−1, on areas with soil-protective crop rotations it is 20 t ha−1 year−1 and on areas with classical crop rotations it is 5 t ha−1 year−1.
However, the map of optimal use of arable land is only one of the possible scenarios, which first of all takes into account soil protection. The created model of biomass production and consumption can also be used upside down, i.e. to assess the impact of various scenarios of agricultural production development on the sustainability of farming. For example, if the proportion of crops changes (the cover-management factor changes), this will affect both the long-term soil erosion and the organic matter (carbon) balance. If the number of livestock changes, this will affect their consumption and consequently the biomass balance. A different number of animals may have an impact on the structure of crops, which in turn will have an impact on the soil. At the ministry level, this will make it possible to objectively compare the different strategies of the direction of the whole agricultural sector, especially in terms of impacts on agricultural land, which is crucial in the long term and neglected in other analyses (e.g. economic). It is also possible to analyse the potential for the use of agricultural biomass for energy purposes, especially at regional levels. The model can answer questions about whether there is enough biomass for energy purposes in the region and whether this use will not have a negative impact on soil. Information on the volume and structure of production, consumption and balance of agricultural biomass thus provides a comprehensive picture of the possibilities of the country and individual regions in its use. An interesting direction of future research may be the evaluation of scenarios for changing natural conditions (climate, soil properties).
The created model of agricultural biomass utilization can be used in addition to the soil organic matter balance to calculate the CO2 savings mentioned in the introduction. The calculation is based on the following considerations: Using the crop structure according to the Czech Statistical Office and standard model consumption, approximately 250 PJ of energy in crops will be retained (including straw and permanent grassland) and approximately 43 PJ of energy in liquid manure. A total of approximately 293 PJ of energy. If we tried to produce this amount of energy by burning coal, we would produce as much as 95.6 million tons of CO2. But if we produced the same amount of energy in biothermal plants (biomass combustion), we would only produce 12 million tons of CO2. The difference represents a potential saving of 83.6 million tons of CO2.
Software
Maps have been created using Inkscape 1.0.1 and ArcGIS 10.4 software. The second software has also been used for calculations and raster data analysis. Some calculations have been performed in Excel 2013.
TJOM_2067010_Supplementary Material
Download PDF (2.5 MB)Disclosure statement
No potential conflict of interest was reported by the author(s).
Data availability statement
The data that support the findings of this study are available from the corresponding author upon reasonable request.
Additional information
Funding
Notes
1 The input raster resolution is 5 × 5 m. The maximum permissible soil loss Gp = 4 t ha−1 year−1 is used on shallow soils and Gp = 17 t ha−1 year−1 on medium and deep soils (in accordance with the Strategy of the Ministry of Agriculture of the Czech Republic with a view to 2030, 2016).
2 If a part of the land parcel is outside the ESEU layer (a slight discrepancy in layer delimitation), this part is assigned the ESEU code of the nearest unit (using the Near tool).
3 It is about 34,000 ha throughout Czechia.
4 The geodatabase is based on maps at a scale of 1:5000.
5 E.g. winter wheat – 1:0.8, or winter rape – 1:2.2 (main product:by-product).
6 All breeders from a certain number of animals are obliged to register (cattle and other members of the genus Bos, sheep, goats, horses, donkeys, pigs from 1 piece). The register thus contains information on the actual number of animals throughout Czechia.
7 It is possible to easily recalculate the content of organic matter on carbon (and vice versa). Carbon accounts for 52.5% of the organic matter content of crop by-product.
8 The highest average annual yield of the main product in net mass is in silage maize (36.4 t ha−1), followed by potatoes (27 t ha−1) and grain maize (8.7 t ha−1). The average yield of fodder crops is 7.4 to 8.4 t ha−1, other cereals 3.8 to 5.7 t ha−1 and the lowest is for rape (3.1 t ha−1).
References
- CZSO. (2014–2018). Areas under crops survey. Czech Statistical Office. Retrieved November 14, 2018, from https://www.czso.cz/csu/czso/areas-under-crops-survey-as-at-31-may-2018
- ECA. (2016). The land parcel identification system: A useful tool to determine the eligibility of agricultural land – But its management could be further improved. European Court of Auditors. Retrieved May 26, 2020, from https://www.eca.europa.eu/Lists/ECADocuments/SR16_25/SR_LPIS_EN.pdf
- Hakl, J., Fuksa, P., Konečná, J., Pacek, L., & Tlustoš, P. (2014). Effect of applied cultivation technology and environmental conditions on lucerne farm yield in the Central Europe. Plant, Soil and Environment, 60(10), 475–480. https://doi.org/10.17221/629/2014-PSE
- IAEI. (1996). Zemědělské výrobní oblasti [Agricultural production areas]. Institute of Agricultural Economics and Information. Retrieved September 3, 2019, from https://metadata.vumop.cz/en/record/basic/5416e821-0178-42d0-baba-1f887f000001
- Jørgensen, S. E. (2010). Global ecology. Academic Press.
- Klír, J. (2019). Orientační bilance živin a organické hmoty v zemědělském závodě [Indicative balance of nutrients and organic matter in agricultural holding]. Crop Research Institute. Retrieved October 17, 2019, from https://www.vurv.cz/index.php?p=aktuality&id=599&site=instituce
- MIT CR. (2015). State energy policy. Ministry of Industry and Trade of the Czech Republic. Retrieved September 17, 2019, from https://www.mpo.cz/dokument161030.html
- Novotný, I., Váňová, V., Smolíková, J., Kristenová, H., & Pírková, I. (2015). Soil conservation in the Czech Republic and implementation of DZES 5 requirements. In M. A. Fullen, J. Famodimu, T. Karyotis, C. Noulas, A. Panagopoulos, J. L. Rubio, & D. Gabriels (Eds.), Advances in geoecology 44: Innovative strategies and policies for soil conservation (pp. 42–49). Catena Verlag.
- Novotný, I., & Vopravil, J. (2013). Metodika mapování a aktualizace bonitovaných půdně ekologických jednotek [Methodology of mapping and updating of evaluated soil-ecological units]. Research Institute for Soil and Water Conservation.
- Novotný, I., Žížala, D., Kapička, J., Beitlerová, H., Mistr, M., Kristenová, H., & Papaj, V. (2016). Adjusting the CPmax factor in the Universal Soil Loss Equation (USLE): Areas in need of soil erosion protection in the Czech Republic. Journal of Maps, 12(sup1), 58–62. https://doi.org/10.1080/17445647.2016.1157834
- Porter, J. R., Howell, F. M., Mason, P. B., & Blanchard, T. C. (2009). Existing biomass infrastructure and theoretical potential biomass production in the U.S. Journal of Maps, 5(1), 206–218. https://doi.org/10.4113/jom.2009.1067
- RISWC. (2018). Long-term average annual soil loss. Research Institute for Soil and Water Conservation. Retrieved September 3, 2019, from https://metadata.vumop.cz/en/record/basic/550019b0-edc4-4b82-a7d2-11c87f000001
- Rumpel, C., Amiraslani, F., Koutika, L.-S., Smith, P., Whitehead, D., & Wollenberg, E. (2018). Put more carbon in soils to meet Paris climate pledges. Nature, 564(7734), 32–34. https://doi.org/10.1038/d41586-018-07587-4
- Škarda, M. (1989). Organické hnojení [Organic fertilization]. In J. Neuberg (Ed.), Komplexní metodika výživy rostlin [Complex methodology of plant nutrition] (pp. 31–55). ÚVTIZ.
- Trnka, M., Brázdil, R., Balek, J., Semerádová, D., Hlavinka, P., Možný, M., Štěpánek, P., Dobrovolný, P., Zahradníček, P., Dubrovský, M., Eitzinger, J., Fuchs, B., Svoboda, M., Hayes, M., & Žalud, Z. (2015). Drivers of soil drying in the Czech Republic between 1961 and 2012. International Journal of Climatology, 35(9), 2664–2675. https://doi.org/10.1002/joc.4167
- Vilček, J., & Koco, Š. (2018). Integrated index of agricultural soil quality in Slovakia. Journal of Maps, 14(2), 68–76. https://doi.org/10.1080/17445647.2018.1428233
- Wischmeier, W. H., & Smith, D. D. (1965). Predicting rainfall-erosion losses from cropland east of the Rocky Mountains: Guide for selection of practices for soil and water conservation. Agricultural Research Service, U.S. Department of Agriculture in cooperation with Purdue Agricultural Experiment Station.
- Wischmeier, W. H., & Smith, D. D. (1978). Predicting rainfall erosion losses: A guide to conservation planning. U.S. Department of Agriculture, Science and Education Administration.
- Zahradníček, P., Trnka, M., Brázdil, R., Možný, M., Štěpánek, P., Hlavinka, P., Žalud, Z., Malý, A., Semerádová, D., Dobrovolný, P., Dubrovský, M., & Řezníčková, L. (2015). The extreme drought episode of August 2011–May 2012 in the Czech Republic. International Journal of Climatology, 35(11), 3335–3352. https://doi.org/10.1002/joc.4211
Annex. Demonstration of model crop rotation plans for maize and beet production areas
| (1) | Classical crop rotation | ||||
| (2) | Soil-protective crop rotation | ||||