
 ?Mathematical formulae have been encoded as MathML and are displayed in this HTML version using MathJax in order to improve their display. Uncheck the box to turn MathJax off. This feature requires Javascript. Click on a formula to zoom.
ABSTRACT
This study presents the map of the external effective annual dose rate (1:200,000 scale) due to terrestrial and cosmic radiation. The terrestrial dose is assessed via gamma ray spectroscopy combining radiometric data from airborne surveys and laboratory measurements. The geostatistical method Collocated CoKriging is used for the spatial interpolation of the sparse gamma ray data, adopting a high-resolution geological map as ancillary information. The obtained numerical map is integrated with the cosmic radiation effective dose rate calculated using the CARI-7 software tool that considers the effects of altitude, latitude, and the solar magnetic activity cycle. The absorbed dose rate due to radioactivity of the main lithological groups is studied and, for the most populated municipalities, the population-weighted average effective dose is also calculated. For future generations, this map will be a reference tool for evaluating radiological effects in case of accidental events like radioactive fallout or environmental contaminations.
1. Introduction
For each individual living on the Earth, the radiation exposure arisen from artificial sources, including medical uses of radiation and nuclear accidents, generally represents a minor contribution. It follows that the assessment of natural radiation background is the most significant step towards a comprehensive understanding of the population exposure and an optimization of good radiation safety practices. Moreover, the knowledge of the natural background permits to discern and detect a possible increase of radiation caused by accidental events linked to nuclear power plant functioning (CitationFuma et al., Citation2017; CitationStrand et al., Citation2014), to the release of radioactive pollutants in the environment (CitationDevi & Chauhan, Citation2020; CitationSalmani-Ghabeshi et al., Citation2016) or to the enhancement of naturally occurring radioactive materials (CitationAli et al., Citation2019; CitationXhixha et al., Citation2015).
In the health physics, the effective dose is an approximate measure of the stochastic risk applied to a reference person (CitationFisher & Fahey, Citation2017) introduced with the purpose of setting limits for radiation protection (CitationICRP, Citation1977). From the physics point of view, the effective dose is the energy deposited in the matter by ionizing radiation weighted for the type of radiation and radiosensitivity of organs and tissues. Since these weighting factors are affected by considerable uncertainties (i.e., age and gender of individual), the effective dose should not be used to estimate cancer incidence, in particular for low dose rates.
The annual committed dose from natural radiation includes the sum of internal dose (EINT), due to the inhalation or ingestion of naturally occurring radionuclides in food and gases, and the external dose (EEXT) generated by cosmic rays and terrestrial radionuclides and absorbed by an individual living both outdoor and indoor. In the last decades, diverse attempts were made to investigate the outdoor dose rate through maps of the cosmic and terrestrial doses at regional (CitationSzabo et al., Citation2017; CitationYesilkanat et al., Citation2015), national (CitationChen et al., Citation2009; CitationQuindós Poncela et al., Citation2004) or continental (CitationCinelli et al., Citation2017; CitationSzegvary, Conen, et al., 2007) scale. While the cosmic contribution can be computed by utilizing analytical models implemented in dosimetry software tools (CitationFAA, Citation2021; CitationSato, Citation2015), the terrestrial component can be retrieved by the measurement of radionuclides abundances through gamma ray measurements (CitationCinelli et al., Citation2020; CitationVerdoya et al., Citation2009).
The cosmic dose (EC), on average, contributes for about 50% of EEXT and it can considerably vary in time and space, being mainly dependent on the altitude and, secondly, on the geomagnetic latitude and the solar activity (CitationOmori et al., Citation2020). The terrestrial dose (ET) depends on the amount of the terrestrial radionuclides (238U, 232Th and 40K) in the environment, whose spatial distribution is mainly driven by local geological features (CitationAközcan, Citation2014; CitationTorres et al., Citation2018). The investigation of ET has also indirect implications for predicting the concentration of geogenic radon, a noble gas produced by the uranium decay series, which plays a starring role in the origin of inhalation dose (CitationKropat et al., Citation2017; CitationSzegvary, Leuenberger, et al., 2007). The presence of natural radioactivity in rocks employed as building materials is also the main source of the indoor exposure (Puccini et al., Citation2014).
In this study, we present the map of the external effective dose from natural radiation in the Umbria region (Italy). Thanks to the great variety of lithotypes and to the distribution of the population in a relatively wide range of altitudes, this region represents an ideal case for testing the effective dose mapping. The map includes the contributions from cosmic radiations, calculated using data from the CARI-7 software tool, and from terrestrial sources, evaluated on the basis of gamma ray spectroscopy measurements on rock and soil samples performed in laboratory and through Airborne Gamma Ray Spectroscopy (AGRS) surveys.
2. Material and methods
2.1. Study area
Umbria is a region of Central Italy not bordering with any geographical or political boundary and is called, for this reason and for the color of its lush meadows and hills, the ‘green heart of Italy’. Its territory hosts a total of 865,013 inhabitants (CitationISTAT, Citation2021) distributed in 2 provinces (Perugia and Terni) and 92 municipalities. The region extends for 8474 km2, offering a wide variety of geomorphological features through the succession of valleys, mountain ranges, highlands, and plains. Partly hilly and mountainous, and partly flat and fertile, its topography includes a portion of the central Apennines, with the highest point at Mt. Vettore (2476 m a.s.l.) on the northern border with the Marche region, then gently descending towards its western part, reaching its lowest point at Attigliano village (96 m a.s.l.), on the southern border with Lazio. Umbria hosts sedimentary rocks (limestone, sandstone), igneous rocks (lava, tuff) and deposits of unconsolidated quaternary sediments (less than 2.6 My old). Accurate information on surfacing lithologies and on the morphology of the territory are of fundamental importance in view of planning and performing an effective sampling campaign aimed at a meticulous dose assessment.
Adopting the geological information contained in the 1:10,000 scale map of the Umbrian Regional Geological Database (CitationMotti & Natali, Citation2016; CitationRegione Umbria – Servizio Geologico, Citation2014), the 215 cartographic units of the region were grouped in two distinct categories, (i) Rocky Formations and (ii) Quaternary Deposits, investigated following different approaches ( and ).
Figure 1. Map of the Rocky Formations (RF, in violet) and Quaternary Deposits (QD, in pink) of Umbria, together with the flight track followed by the AGRS aircraft (in grey) and the points in which samples were collected on rocks (in red) and soils (in green). Cartographic reference system WGS 84, UTM Zone 32N.
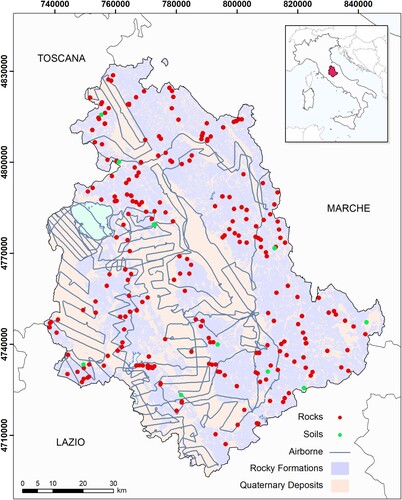
Table 1. Surface area (in km2 and in percentage with respect to the total area of the region) and number of cartographic units of Quaternary Deposits (QD) and Rocky Formations (RF) together with the information about the rock and soil sampling campaign and the airborne data taking.
Following the sampling strategy of CitationCallegari et al. (Citation2013) and CitationStrati et al. (Citation2015) the cartographic units of Rocky Formations (RF), relatively homogeneous in composition and geological history, were characterized via an extensive sampling campaign during which were collected 272 rock samples from fresh outcrops ((a)) belonging to 99 different cartographic units. The samples were analysed through high-resolution gamma ray spectroscopic techniques via High Purity Germanium (HPGe) detectors ((b)). In addition, 14 soil samples were collected in areas undisturbed and morphologically suitable for pedogenesis and similarly analysed ().
Figure 2. (a) Outcrop of a Rocky Formation (RF) where a rock sample was collected and then measured in laboratory with the (b) MCA_Rad system comprised of two HPGe detectors, an automatic sample changer, and a copper and lead shielding. (c) Aerial photo of a Quaternary Deposit (QD), investigated through airborne gamma measurements performed by (d) the Radgyro aircraft, equipped with NaI(Tl) detectors.
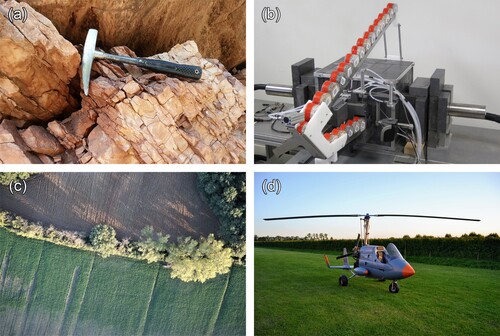
The Quaternary Deposits (QD) comprise (i) the sediments resulting from landslides and groundwater debris deposits, (ii) alluvial and terraced deposits and (iii) the successions of the smaller basins characterizing the valley areas ((c)). The cartographic units QD are usually heterogeneous and possibly subject of high spatial variability not imputable to their classification according to the cartographic units. For this reason, these deposits were investigated via AGRS surveys with a custom-equipped aircraft ((d)), collecting a total of 5614 spectra during the overflights. Additionally, 11 QD rock samples were collected to compare the two different analyses employed for RF and QD measurements. Complementary, 1528 AGRS measurements were performed on RF units ().
2.2. Gamma ray measurements
The measurements of the specific activity of U, Th and K of the rock samples were performed using the MCA_Rad ((b)), an equipment comprised of two coaxial p-type HPGe detectors specifically designed and calibrated for natural radioactivity measurements (CitationXhixha et al., Citation2016). A copper and lead shielding enables the suppression of laboratory background by approximately two orders of magnitude, permitting to reach an overall (statistical and systematic) uncertainty of U, Th and K activity less than 5% (Xhixha et al., Citation2013).
The AGRS surveys were performed via the Radgyro (CitationBaldoncini et al., Citation2017; CitationBaldoncini et al., Citation2018) ((d)), an aircraft expressly engineered to be a flying multisensorial platform devoted to gamma ray spectroscopic measurements. The Radgyro features three u-blox EVK-6T GPS antennas for the logging of the geographic latitude and longitude and seven altimetric sensors for the estimation of the flight altitude (CitationAlberi et al., Citation2017). The AGRS measurements are performed with the AGRS_16L, a modular NaI(Tl) scintillation detector composed of four 4L–crystals and placed in the middle of the Radgyro hull. The acquired gamma spectra are then processed offline to obtain information on U, Th and K specific activities with a time resolution of 10 s, comparable to a measurement every 300 m of flight at typical speed (100 km/h) and altitude (100 m) for AGRS surveys (CitationIAEA, Citation2003).
2.3. Mapping radiometric data
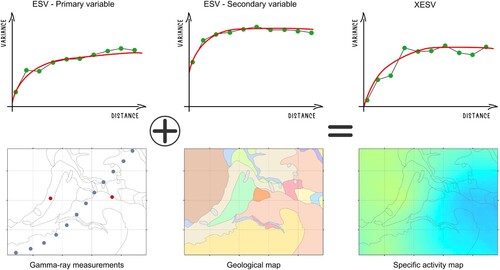
Combining AGRS, rock and soil samples, a total of 7142 gamma measurements were collected during the data-taking campaign. The Collocated CoKriging, a geostatistical interpolation algorithm (CitationGuastaldi et al., Citation2013), was used to map the collected sparse and heterogeneous specific activity data over the entire Umbria region. This algorithm predicts the spatial distributions by characterizing the coregionalization between primary under-sampled variables wherein a secondary correlated variable is available at all prediction locations. In this case, the secondary variable, built by assigning a numeric value to each cartographic unit of the 1:10,000 geological map of Umbria (CitationMotti & Natali, Citation2016; CitationRegione Umbria – Servizio Geologico, Citation2014), steers the spatial estimation of the specific activities (primary variable) of U, Th and K in the entire territory (). The result was a 50m–resolution specific activity map of the Umbria region for each of the three radioelements.
Figure 3. Schematic sketch explaining the rationale of the Collocated CoKriging interpolation algorithm. The experimental semi-variograms (ESV) describing the spatial correlation of the under-sampled primary variables (specific activities of U, Th and K) and the ESV of the secondary variable (the geological information) are calculated and modelled. The two ESVs are combined to calculate and model the cross-semi-variogram (XESV), permitting the prediction of the value of the primary variable in all points of the output grid in which the secondary variable is available.
2.4. Mapping dosimetric data
The spatial information on the specific activities was used to derive the terrestrial absorbed dose rate according to:
(1)
(1) where AK, AU and ATh are the specific activities of the three radioelements, in Bq/kg, in the outdoor soil,
,
,
are the dose conversion factors in (nGy/h)/(Bq/kg) for K, U and Th, respectively (CitationUNSCEAR, Citation2008). The terrestrial effective dose
received by an adult spending the whole year living outdoor is calculated as:
(2)
(2) where
is the conversion factor from absorbed dose in air to the effective dose received by adults and
are the hours in a year.
The cosmic flux depends mainly on the 11-year solar modulation, the altitude, and the geomagnetic coordinates. The cosmic effective dose in a specific location and datetime can be calculated using software dedicated to its modeling. For this purpose, we use CARI-7, a dosimetry program developed by the USA Federal Aviation Administration’s (CitationFAA, Citation2021).
Neglecting the seasonal variations due to atmospheric conditions producing a fluctuation of ∼ ± 2.5%, the main factor affecting the time variability of
is the solar cycle causing a full-range variation of ∼10% between its maximum and its minimum. Since solar activity is inversely correlated to cosmic radiation intensity at ground, the mean value of the cosmic effective dose was calculated by averaging the estimates obtained in correspondence of the last maximum (April 2014) and last minimum (December 2019) of solar activity.
An assessment of the latitudinal variability of the showed that, for the Umbria region, the discrepancy between the northernmost and the southernmost point at the same altitude is lower than 3%. It was therefore chosen to set in the software the geographical coordinates to Perugia (43.1167 N, 12.3833 E), situated in the middle of the region.
The dose in the 0–3000 m altitude range was modeled averaging calculated with CARI-7 in the above-mentioned maximum and minimum solar conditions and then fitting these values with an exponential curve. The obtained best fit function was used to parametrize the effective cosmic dose received by an adult spending the whole year living outdoor
according to the altitude h [m] a.s.l.:
(3)
(3) The
map of the Umbria region was therefore reconstructed by employing the altitude obtained from a 10m-resolution Digital Elevation Model (DEM) of Umbria (CitationTarquini et al., Citation2007).
2.5. Building the external effective dose map
The annual external effective dose is the sum of the effective terrestrial dose (
) and the effective cosmic dose (
), each including an outdoor contribution (
and
) and an indoor contribution (
and
):
(4)
(4)
The outdoor terrestrial effective dose received by an adult in a year is calculated as:
(5)
(5) where
(CitationUNSCEAR, Citation2000) is the annual indoor Occupancy Factor and
is the terrestrial effective dose calculated according to Equation (2).
The indoor terrestrial effective dose () is originated by the radionuclides in building materials as well as the radiation produced by the outdoor soil penetrating the dwellings. It can be evaluated on the basis of the average value ratio of indoor to outdoor absorbed dose rate
(CitationUNSCEAR, Citation2000). It follows that
is calculated as:
(6)
(6) The outdoor (
) and indoor (
) contributions to the annual cosmic effective dose (
) are calculated as:
(7)
(7)
(8)
(8) where
is the cosmic effective dose calculated according to Equation (3) and
, the Shielding Factor, is the fraction of cosmic dose not shielded by dwellings (CitationUNSCEAR, Citation2000).
Combining Equation (4) with Equations (5–8) and adopting ,
and
, the external effective dose is calculated as:
(9)
(9)
3. Results and discussion
In quantitative mapping, the huge effort put in data collection and in spatial interpolation methods has to be accompanied by equal care in the map production. The representation of results has to be achieved avoiding loss of information and featureless maps (CitationReimann, Citation2005). In this study, the chromatic variations in the Main Map of the legends of EEXT, ET and EC were assigned to specific values of dose rate corresponding to specific percentiles of the data distribution (). Since the use of order statistics does not assume any underlying data distribution, this strategy appears particularly suitable for the observed positive skewed distributions. The frequency histogram of ET ((b)) suggests a bimodal distribution with a tail on high values which can be explained by the strong relationship between terrestrial dose and the feature of the three main lithologies (carbonates, sandstones, and volcanic rocks) of the geological map.
Figure 4. Relative frequency distributions of the data obtained for (a) the total outdoor effective dose (EEXT), (b) terrestrial effective dose (ET) and (c) cosmic effective dose (EC) together with the percentiles chosen for the chromatic variations of the legend colour bars in the Main Map. For graphical needs, the tails of the histograms corresponding to the 1.6% of data for EEXT, to the 1.8% for ET and to the 0.1% for EC are not reported.
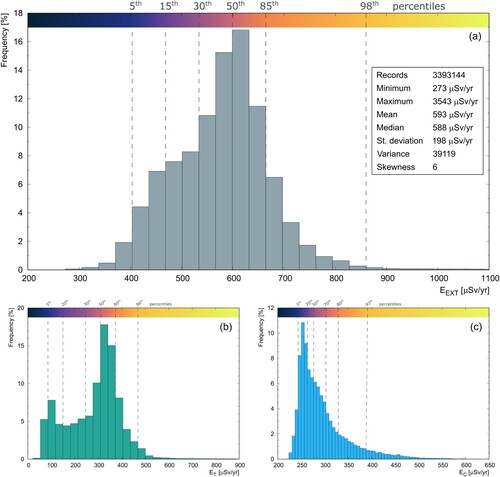
The lognormal tendency of the frequency histogram of EC values ((c)) reflects the exponential dependency of cosmic dose on the altimetric values of the investigated area. As a consequence of these peculiarities, the percentiles used for the three maps are different, aiming to show the spatial distribution of the data structures. Moreover, the percentiles used as lower limits for the highest classes of EEXT, ET and EC correspond to the global averaged values reported in (CitationUNSCEAR, Citation2008) for the external (870 µSv/yr), terrestrial (480 µSv/yr) and cosmic (390 µSv/yr) effective dose rates.
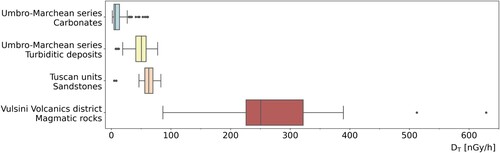
The terrestrial absorbed dose rate (DT, see Equation (1)) in the RF of the Umbria region can be studied in a propaedeutic way for the evaluation of the radiological implications coming from the use of these rocks as building materials. About 90% of the Umbrian production in the mining sector concerns the extraction of inert materials from limestones, clays, and sandstones for civil and industrial uses. The remaining market sector is represented by the extraction of tuff employed as ornamental stone for civil use. In this perspective, four different groups of rocks are identified on the basis of lithological and tectonic arguments: (i) carbonates (CitationCoccioni et al., Citation2013; CitationDi Naccio et al., Citation2005) and (ii) turbiditic deposits of the Umbro-Marchean series (CitationBarsella et al., Citation2009; CitationTinterri & Muzzi Magalhaes, Citation2011), (iii) sandstones of Tuscan units (CitationAmendola et al., Citation2016; CitationBarsella et al., Citation2009) and (iv) magmatic rocks of the Vulsini volcanic districts (CitationPalladino & Simei, Citation2002).
The boxplots of DT (), obtained starting from the activity concentrations measured from rock samples, show a clear distinction between sedimentary and magmatic rocks. The carbonates (limestone and marls, Triassic – Paleogene) of the Umbro-Marchean series, which occupies 45% of the RF surface area, present the lowest values of DT with a median of 7 nGy/h; the high outliers represent samples having a siliciclastic component (marly mudstones). Despite the similar deposition environment, the sandstones of the Tuscan units (Macigno formation, Paleogene – Miocene) show a slightly increasing trend with respect to the turbiditic deposits of the Umbro-Marchean series (sandstone and marly mudstones, Miocene); for both cases, the low outliers refer to the most carbonate portions of the sequences. The magmatic rocks (tuffs and porphyritic basalts, Pleistocene), corresponding to 3% of the RF surface area, are characterized by a wide range of values (86–389 nGy/h) with two high outliers from tephritic rocks.
Figure 5. Boxplots of the absorbed dose rate DT (in nGy/h) calculated according to Equation (1) starting from the activity concentrations measured in the rock samples of the (i) carbonates (127 samples, 45% of the RF area) and (ii) turbiditic deposits of the Umbro-Marchean series (95 samples, 33% of the RF area), (iii) sandstones of Tuscan units (31 samples, 13% of the RF area) and (iv) magmatic rocks of the Vulsini volcanic districts (14 samples, 3% of the RF area).
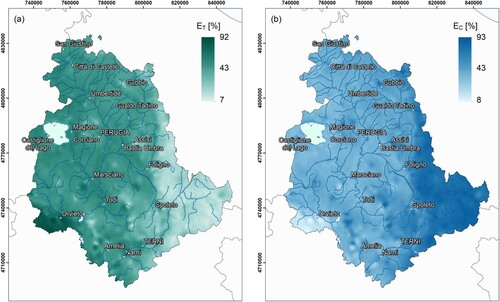
The relative contributions of the terrestrial (ET) and cosmic (EC) components to the external effective doses () reproduce the effect of two concurrent causes: from one side the most elevated areas (high cosmic doses) in the eastern region are dominated by the presence of limestones and marls (low terrestrial doses), on the other side the outcrops of magmatic rocks (high terrestrial doses) are in relatively low altitudes (low cosmic doses) in the area south-west of Orvieto. In the alluvial plains and the hills in the central zone of the region, where the main rocks are the turbiditic deposits of the Umbro-Marchean series and quaternary deposits, the terrestrial and cosmic contributions are approximately equivalent.
Figure 6. Annual (a) terrestrial (ET) and (b) cosmic (EC) effective dose rate of the Umbria region expressed as a relative contribution in percentage of the external effective dose rate (EEXT). Cartographic reference system WGS 84, UTM Zone 32N.
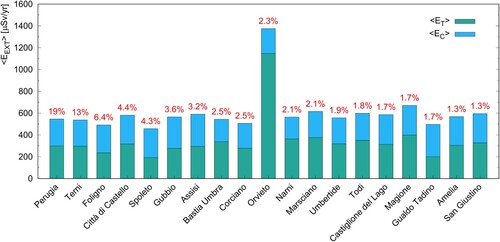
In , the population-weighted average of the external effective dose (<EEXT>), together with its terrestrial (<ET>) and cosmic (<EC>) components, is reported for the most populated (>10,000 inhabitants) municipalities of the Umbria region hosting globally 80% of its population. EEXT normally ranges between 457 and 671 µSv/yr with approximately equal terrestrial and cosmic components. A separate mention has to be dedicated to Orvieto, where the terrestrial component is dominant (83%) since this city is located in the south-west of the region and on the flat summit of a large butte of volcanic tuff at a relatively low altitude (325 m a.s.l.).
Figure 7. Population-weighted average external effective dose rate (<EEXT>) for the municipalities of the Umbria region with more than 10,000 inhabitants; the terrestrial (<ET>) and the cosmic (<EC>) contribution are reported respectively with green and blue filling. The number in red for each bar indicates the percentage of the population of the municipality with respect to the total regional population.
4. Final remarks
In this study, the map of the annual external effective dose rate (EEXT) of the Umbria region (Italy), including the terrestrial and cosmic components, is presented. For the terrestrial contribution, the starting points are the specific activities of U, Th and K measured by means of gamma ray spectroscopy (airborne and in laboratory) and spatialized in the entire territory by applying the Collocated CoKriging. The terrestrial effective dose (ET) is calculated assuming that an adult spends 80% of their time inside dwellings (OF = 0.8) and a ratio R = 1.4 between the indoor and outdoor terrestrial dose. The cosmic effective dose (EC) is calculated using the CARI-7 software tool and considering that 80% of the cosmic radiation is not shielded indoor (SF = 0.8).
Comparing the estimates obtained for the Umbria region with the global estimates reported in UNSCEAR (Citation2008), it is possible to infer that only for the 2% of its territory the external effective dose is higher than the global average (870 µSv/yr), while the population-weighted effective dose of the region is 566 µSv/yr. In the investigated municipalities (), EEXT is always lower than the global average value except for Orvieto, where the average value of EEXT = 1375 µSv/yr is dominated by the high terrestrial dose of the surrounding volcanic rocks.
As it is easy to guess, the values of OF, SF and R depend on multiple features, e.g., people life style from one side and materials of the buildings on the other. Omori et al., (Citation2020) measured a value of R ranging between 0.72 (light-gauge steel houses) and 2.8 (concrete houses). According to UNSCEAR, (Citation2000), SF can be 1 for wooden houses and 0.4 for concrete buildings leading to the universal representative value of 0.8. Sato (Citation2016) calculates the SF as a function of the wall thickness and proposes a slightly higher representative value (SF = 0.91). The variability of these coefficients is an additional source of uncertainty associated with effective dose estimates.
In conclusion, with the caveat that the external effective dose is calculated using reference coefficients affected by intrinsic variabilities, the presented map represents an instrument for understanding the environment hosting approximately 865,000 people and for optimizing radiation protection procedures. Because it is an imperfect tool, this map should not be used for epidemiological studies since more biological and statistical factors must be considered for a more appropriate evaluation of health effects on the population. This cartographic result informs the population that ionizing radiation from its own territory is under control since it was properly measured. Moreover, the public source radiometric data can be used for further studies (e.g. building materials characterization). For the future generations, the map of external effective dose from natural radiation can be used as a reference by the Umbria region community in case of accidental events like radioactive fallout or environmental contaminations.
Software
The geostatistical analysis was performed using Geovariances ISATIS®. The cosmic dose was calculated using the CARI-7 software tool. The map was produced using Esri ArcGIS 10.7. The radiometric data can be downloaded here: https://www.regione.umbria.it/geologia/carta-della-radioattivita-naturale-dell-umbria
Supplementary material
Download PDF (24.2 MB)Acknowledgments
The authors thank Maurino Antongiovanni, Paola Fabbri, Giovanni Fiorentini, Vincenzo Guidi, Claudio Pagotto and Emanuele Tufarolo for their valuable support.
Disclosure statement
No potential conflict of interest was reported by the authors.
Data availability statement
The data that support the findings of this study are available from the corresponding author, K.G.C.R., upon reasonable request.
Additional information
Funding
References
- Aközcan, S. (2014). Annual effective dose of naturally occurring radionuclides in soil and sediment. Toxicological & Environmental Chemistry, 96(3), 379–386. https://doi.org/10.1080/02772248.2014.939177
- Alberi, M., Baldoncini, M., Bottardi, C., Chiarelli, E., Fiorentini, G., Raptis, K. G. C., Realini, E., Reguzzoni, M., Rossi, L., Sampietro, D., Strati, V., & Mantovani, F. (2017). Accuracy of flight altitude measured with low-cost GNSS, radar and barometer sensors: Implications for airborne radiometric surveys. Sensors (Basel), 17(8). https://doi.org/10.3390/s17081889
- Ali, M. M. M., Zhao, H., Li, Z., & Maglas, N. N. M. (2019). Concentrations of TENORMs in the petroleum industry and their environmental and health effects. RSC Advances, 9(67), 39201–39229. https://doi.org/10.1039/C9RA06086C
- Amendola, U., Perri, F., Critelli, S., Monaco, P., Cirilli, S., Trecci, T., & Rettori, R. (2016). Composition and provenance of the Macigno formation (late Oligocene–early Miocene) in the Trasimeno Lake area (northern Apennines). Marine and Petroleum Geology, 69, 146–167. https://doi.org/10.1016/j.marpetgeo.2015.10.019
- Baldoncini, M., Albéri, M., Bottardi, C., Minty, B., Raptis, K. G. C., Strati, V., & Mantovani, F. (2017). Exploring atmospheric radon with airborne gamma-ray spectroscopy. Atmospheric Environment, 170, 259–268. https://doi.org/10.1016/j.atmosenv.2017.09.048
- Baldoncini, M., Alberi, M., Bottardi, C., Minty, B., Raptis, K. G. C., Strati, V., & Mantovani, F. (2018). Airborne gamma-ray spectroscopy for modeling cosmic radiation and effective dose in the lower atmosphere. IEEE Transactions on Geoscience and Remote Sensing, 56(2), 823–834. https://doi.org/10.1109/TGRS.2017.2755466
- Barsella, M., Boscherini, A., Botti, F., Marroni, M., Meneghini, F., Motti, A., Palandri, S., & Pandolfi, L. J. B. d. S. G. I. (2009). Oligocene-Miocene foredeep deposits in the Lake Trasimeno area (central Italy): Insights into the evolution of the northern Apennines. Italian Journal of Geosciences, 128(2), 341–352. https://doi.org/10.3301/IJG.2009.128.2.341.
- Callegari, I., Bezzon, G. P., Broggini, C., Buso, G. P., Caciolli, A., Carmignani, L., Colonna, T., Fiorentini, G., Guastaldi, E., Xhixha, M. K., Mantovani, F., Massa, G., Menegazzo, R., Mou, L., Pirro, A., Alvarez, C. R., Strati, V., Xhixha, G., & Zanon, A. (2013). Total natural radioactivity, Tuscany, Italy. Journal of Maps, 9(3), 438–443. https://doi.org/10.1080/17445647.2013.802999
- Chen, J., Timmins, R., Verdecchia, K., & Sato, T. (2009). An estimation of Canadian population exposure to cosmic rays. Radiation and Environmental Biophysics, 48(3), 317–322. https://doi.org/10.1007/s00411-009-0226-z
- Cinelli, G., Brattich, E., Coletti, C., De Ingeniis, V., Mazzoli, C., Mostacci, D., Sassi, R., & Tositti, L. (2020). Terrestrial gamma dose rate mapping (Euganean Hills, Italy): Comparison between field measurements and HPGe gamma spectrometric data. Radiation Effects and Defects in Solids, 175(1–2), 54–67. https://doi.org/10.1080/10420150.2020.1718131
- Cinelli, G., Gruber, V., De Felice, L., Bossew, P., Hernandez-Ceballos, M. A., Tollefsen, T., Mundigl, S., & De Cort, M. (2017). European annual cosmic-ray dose: Estimation of population exposure. Journal of Maps, 13(2), 812–821. https://doi.org/10.1080/17445647.2017.1384934
- Coccioni, R., Sideri, M., Bancalà, G., Catanzariti, R., Frontalini, F., Jovane, L., Montanari, A., & Savian, J. (2013). Integrated stratigraphy (magneto-, bio- and chronostratigraphy) and geochronology of the palaeogene pelagic succession of the Umbria–Marche basin (central Italy). Geological Society, London, Special Publications, 373(1), 111–131. https://doi.org/10.1144/SP373.4
- Devi, V., & Chauhan, R. P. (2020). Estimation of natural radionuclide and exhalation rates of environmental radioactive pollutants from the soil of northern India. Nuclear Engineering and Technology, 52(6), 1289–1296. https://doi.org/10.1016/j.net.2019.11.016
- Di Naccio, D., Boncio, P., Cirilli, S., Casaglia, F., Morettini, E., Lavecchia, G., & Brozzetti, F. (2005). Role of mechanical stratigraphy on fracture development in carbonate reservoirs: Insights from outcropping shallow water carbonates in the Umbria–Marche Apennines, Italy. Journal of Volcanology and Geothermal Research, 148(1–2), 98–115. https://doi.org/10.1016/j.jvolgeores.2005.03.016
- FAA. (2021). Program to calculate galactic cosmic radiation https://www.faa.gov/data_research/research/med_humanfacs/aeromedical/radiobiology/cari7/
- Fisher, D. R., & Fahey, F. H. J. H. P. (2017). Appropriate use of effective dose in radiation protection and risk assessment. Health Physics, 113(2), 102–109. https://doi.org/10.1097/HP.0000000000000674.
- Fuma, S., Ihara, S., Takahashi, H., Inaba, O., Sato, Y., Kubota, Y., Watanabe, Y., Kawaguchi, I., Aono, T., Soeda, H., & Yoshida, S. (2017). Radiocaesium contamination and dose rate estimation of terrestrial and freshwater wildlife in the exclusion zone of the Fukushima Dai-ichi Nuclear power plant accident. Journal of Environmental Radioactivity, 171, 176–188. https://doi.org/10.1016/j.jenvrad.2017.02.013
- Guastaldi, E., Baldoncini, M., Bezzon, G., Broggini, C., Buso, G., Caciolli, A., Carmignani, L., Callegari, I., Colonna, T., Dule, K., Fiorentini, G., Kaçeli Xhixha, M., Mantovani, F., Massa, G., Menegazzo, R., Mou, L., Rossi Alvarez, C., Strati, V., Xhixha, G., & Zanon, A. (2013). A multivariate spatial interpolation of airborne γ-ray data using the geological constraints. Remote Sensing of Environment, 137(0), 1–11. https://doi.org/10.1016/j.rse.2013.05.027
- IAEA. (2003). Guidelines for radioelement mapping using gamma ray spectrometry data. International Atomic Energy Agency. Technical Report Series No. 323.
- ICRP. (1977). International commission of radiological protection. Recommendations of the international commission on radiological protection. Elsevier Science & Technology.
- ISTAT. (2021). http://dati.istat.it/Index.aspx?QueryId=18542
- Kropat, G., Bochud, F., Murith, C., Palacios Gruson, M., & Baechler, S. (2017). Modeling of geogenic radon in Switzerland based on ordered logistic regression. Journal of Environmental Radioactivity, 166(Pt 2), 376–381. https://doi.org/10.1016/j.jenvrad.2016.06.007
- Motti, A., & Natali, N. (2016). Geothematic open data in Umbria region. 2167-9843, PeerJ Preprints.
- Omori, Y., Hosoda, M., Takahashi, F., Sanada, T., Hirao, S., Ono, K., & Furukawa, M. (2020). Japanese population dose from natural radiation. Journal of Radiological Protection, 40(3), R99–R140. https://doi.org/10.1088/1361-6498/ab73b1
- Palladino, D. M., & Simei, S. (2002). Three types of pyroclastic currents and their deposits: Examples from the Vulsini volcanoes, Italy. Journal of Volcanology and Geothermal Research, 116(1–2), 97–118. https://doi.org/10.1016/S0377-0273(02)00213-5
- Puccini, A., Xhixha, G., Cuccuru, S., Oggiano, G., Xhixha, M., Mantovani, F., Alvarez, C., & Casini, L. (2014). Radiological characterization of granitoid outcrops and dimension stones of the Variscan Corsica-Sardinia Batholith. Environmental Earth Sciences, 71, 393–405.https://doi.org/10.1007/s12665-013-2442-8.
- Quindós Poncela, L. S., Fernández, P. L., Gómez Arozamena, J., Sainz, C., Fernández, J. A., Suarez Mahou, E., Martin Matarranz, J. L., & Cascón, M. C. (2004). Natural gamma radiation map (MARNA) and indoor radon levels in Spain. Environment International, 29(8), 1091–1096. https://doi.org/10.1016/S0160-4120(03)00102-8
- Regione Umbria – Servizio Geologico. (2014). Cartografia Geologica informatizzata vettoriale. Cartografia geologica informatizzata vettoriale – Regione Umbria, Carta geologica dell’Umbria – Dataset – dati.umbria.it.
- Reimann, C. (2005). Geochemical mapping: Technique or art? Geochemistry: Exploration, Environment, Analysis, 5(4), 359–370. https://doi.org/10.1144/1467-7873/03-051
- Salmani-Ghabeshi, S., Palomo-Marin, M. R., Bernalte, E., Rueda-Holgado, F., Miro-Rodriguez, C., Cereceda-Balic, F., Fadic, X., Vidal, V., Funes, M., & Pinilla-Gil, E. (2016). Spatial gradient of human health risk from exposure to trace elements and radioactive pollutants in soils at the Puchuncavi-Ventanas industrial complex, Chile. Environmental Pollution, 218, 322–330. https://doi.org/10.1016/j.envpol.2016.07.007
- Sato, T. (2015). Analytical model for estimating terrestrial cosmic Ray fluxes nearly anytime and anywhere in the world: Extension of PARMA/EXPACS. Plos One, 10(12), e0144679. https://doi.org/10.1371/journal.pone.0144679.
- Sato, T. (2016). Evaluation of world population-weighted effective dose due to cosmic ray exposure. Scientific Reports, 6(1), 1–7. https://doi.org/10.1038/srep33932.
- Strand, P., Aono, T., Brown, J. E., Garnier-Laplace, J., Hosseini, A., Sazykina, T., Steenhuisen, F., & Vives i Batlle, J. (2014). Assessment of Fukushima-derived radiation doses and effects on wildlife in Japan. Environmental Science & Technology Letters, 1(3), 198–203. https://doi.org/10.1021/ez500019j
- Strati, V., Baldoncini, M., Bezzon, G. P., Broggini, C., Buso, G. P., Caciolli, A., Callegari, I., Carmignani, L., Colonna, T., Fiorentini, G., Guastaldi, E., Kaçeli Xhixha, M., Mantovani, F., Menegazzo, R., Mou, L., Rossi Alvarez, C., Xhixha, G., & Zanon, A. (2015). Total natural radioactivity, Veneto (Italy). Journal of Maps, 11(4), 545–551. https://doi.org/10.1080/17445647.2014.923348
- Szabo, K. Z., Jordan, G., Petrik, A., Horvath, A., & Szabo, C. (2017). Spatial analysis of ambient gamma dose equivalent rate data by means of digital image processing techniques. Journal of Environmental Radioactivity, 166(Pt 2), 309–320. https://doi.org/10.1016/j.jenvrad.2016.07.013
- Szegvary, T., Conen, F., Stöhlker, U., Dubois, G., Bossew, P., & de Vries, G. (2007). Mapping terrestrial dose rate in Europe based on routine monitoring data. Radiation Measurements, 42(9), 1561–1572. https://doi.org/10.1016/j.radmeas.2007.09.002
- Szegvary, T., Leuenberger, M., & Conen, F. J. A. C. (2007). Predicting terrestrial 222 Rn flux using gamma dose rate as a proxy. Atmospheric Chemistry and Physics, 7(11), 2789–2795. https://doi.org/10.5194/acp-7-2789-2007
- Tarquini, S., Isola, I., Favali, M., Mazzarini, F., Bisson, M., Pareschi, M. T., & Boschi, E. (2007). TINITALY/01: A new triangular irregular network of Italy. Annals of Geophysics, 50(3), 407–425. https://doi.org/10.13127/TINITALY/1.0.
- Tinterri, R., & Muzzi Magalhaes, P. (2011). Synsedimentary structural control on foredeep turbidites: An example from Miocene Marnoso-Arenacea formation, Northern Apennines, Italy. Marine and Petroleum Geology, 28(3), 629–657. https://doi.org/10.1016/j.marpetgeo.2010.07.007
- Torres, S. B., Petrik, A., Szabo, K. Z., Jordan, G., Yao, J., & Szabo, C. (2018). Spatial relationship between the field-measured ambient gamma dose equivalent rate and geological conditions in a granitic area, Velence Hills, Hungary: An application of digital spatial analysis methods. Journal of Environmental Radioactivity, 192, 267–278. https://doi.org/10.1016/j.jenvrad.2018.07.001
- UNSCEAR. (2000). Exposures from natural radiation sources. United Nations Scientific Committee on the Effects of Atomic Radiation.
- UNSCEAR. (2008). Health effects due to radiation from the Chernobyl accident. United Nations Scientific Committee on the Effects of Atomic Radiation.
- Verdoya, M., Chiozzi, P., De Felice, P., Pasquale, V., Bochiolo, M., & Genovesi, I. (2009). Natural gamma-ray spectrometry as a tool for radiation dose and radon hazard modelling. Applied Radiation and Isotopes, 67(5), 964–968. https://doi.org/10.1016/j.apradiso.2009.01.066
- Xhixha, G., Alberi, M., Baldoncini, M., Bode, K., Bylyku, E., Cfarku, F., Callegari, I., Hasani, F., Landsberger, S., Mantovani, F., Rodriguez, E., Shala, F., Strati, V., & Kaçeli, M. (2016). Calibration of HPGe detectors using certified reference materials of natural origin. Journal of Radioanalytical and Nuclear Chemistry, 307(2), 1507–1517. https://doi.org/10.1007/s10967-015-4360-6
- Xhixha, G., Baldoncini, M., Callegari, I., Colonna, T., Hasani, F., Mantovani, F., Shala, F., Strati, V., & Xhixha Kaceli, M. (2015). A century of oil and gas exploration in Albania: Assessment of naturally occurring radioactive materials (NORMs). Chemosphere, 139, 30–39. https://doi.org/10.1016/j.chemosphere.2015.05.018
- Xhixha, G., Bezzon, G. P., Broggini, C., Buso, G. P., Caciolli, A., Callegari, I., Bianchi, S., Fiorentini, G., Guastaldi, E., Kaçeli Xhixha, M., Mantovani, F., Massa, G., Menegazzo, R., Mou, L., Pasquini, A., Alvarez, C. R., & Shyti, M. (2013). The worldwide NORM production and a fully automated gamma-ray spectrometer for their characterization. Journal of Radioanalytical and Nuclear Chemistry, 295(1), 445–457. https://doi.org/10.1007/s10967-012-1791-1
- Yesilkanat, C. M., Kobya, Y., Taskin, H., & Cevik, U. (2015). Dose rate estimates and spatial interpolation maps of outdoor gamma dose rate with geostatistical methods; A case study from Artvin, Turkey. Journal of Environmental Radioactivity, 150, 132–144. https://doi.org/10.1016/j.jenvrad.2015.08.011