
 ?Mathematical formulae have been encoded as MathML and are displayed in this HTML version using MathJax in order to improve their display. Uncheck the box to turn MathJax off. This feature requires Javascript. Click on a formula to zoom.
ABSTRACT
We applied a deep learning terrain classification system, the ‘Novelty or Anomaly Hunter – HiRISE’ (NOAH-H), originally developed for the ExoMars landing sites in Oxia Planum and Mawrth Vallis, to the Mars 2020 Perseverance rover landing site in Jezero crater. NOAH-H successfully classified the terrain in four HiRISE images of Jezero even though the landforms in the Jezero study area were slightly different from those in the training dataset. We mosaicked the NOAH-H classified rasters and compared them with a manually generated photogeological map, and with Perseverance rover and Ingenuity helicopter images. We find that grouped NOAH-H classes correspond well with the humanmade map and that individual classes are corroborated by the available ground-truth images. We conclude that our NOAH-H products can be refined for feeding into traversability analysis of the ExoMars Rosalind Franklin rover landing site at Oxia Planum and that they can also be used to aid the photogeological mapping process.
1. Introduction
The Novelty and Anomaly Hunter – HiRISE (NOAH-H: CitationBarrett et al., 2022) is a deep learning terrain classification system that was developed to support the European Space Agency’s ExoMars Rosalind Franklin rover mission to Mars (CitationVago et al., 2017). Briefly, CitationBarrett et al. (2022) manually assigned one of 14 human-defined terrain ‘descriptive classes’ to pixels within 1,504 128 × 128 m framelets in 25 cm/pixel red band High Resolution Imaging Science Experiment (HiRISE: CitationMcEwen et al., 2007) images of Oxia Planum (CitationQuantin-Nataf et al., 2021) and Mawrth Vallis (CitationPoulet et al., 2020) to form the NOAH-H training dataset. After training, NOAH-H could then autonomously apply the descriptive classes to entire HiRISE images in those regions. Together with topographic data and the engineering specifications of the rover, NOAH-H terrain classifications are intended to form a key component of traversability analyses. CitationBarrett et al. (2022) also assembled related descriptive classes into thematic ‘interpretive groups’ conceived to emulate how a geomorphologist would interpret the landscape.
Here, we have applied NOAH-H to the interior of Jezero crater, Mars, to create terrain classification mosaics of the landing site of NASA’s Mars 2020 Perseverance rover proximal to the crater’s putative delta (: CitationFarley et al., 2020). Applying the NOAH-H model to Jezero serves as a test of its transferability. Our preliminary analysis of Jezero revealed terrains that fall within the descriptive classes defined by CitationBarrett et al. (2022) for Oxia Planum and Mawrth Vallis (unlike the Gale crater NASA Curiosity rover site, which contains landforms such as large dark dunes not seen in the training dataset). We wanted to assess how well the model would classify morphologies that might deviate from the examples in the training dataset because of their different geographical setting.
Figure 1. A 6 m/pixel Context Camera mosaic (CitationFergason et al., 2021; CitationMalin et al., 2007) of the Jezero crater delta showing the location of the Mars 2020 Perseverance rover landing site. This view is a plate carrée projection. The inset in the lower-left shows the location of Jezero crater on Mars using an orthographic projection of the Mars Orbiter Laser Altimeter (MOLA: CitationSmith et al., 2001) digital elevation model overlain on the MOLA hillshade.
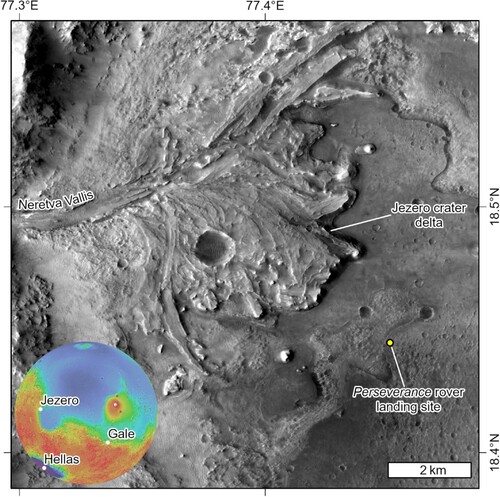
The Mars 2020 team has produced a geological map of Jezero crater (CitationStack et al., 2020), which we compare our NOAH-H results against. Furthermore, Perseverance and the Ingenuity helicopter are actively returning images from Jezero. This means we can ground-truth NOAH-H before the ExoMars Rosalind Franklin rover’s landing in Oxia Planum.
2. Materials and methods
We used four 25 cm/pixel red band HiRISE images (PSP_003798_1985, ESP_042315_1985, ESP046060_1985, and ESP_048908_1985) to generate NOAH-H classified rasters of Jezero. Publicly available HiRISE images do not automatically project onto their correct positions on Mars when loaded into a Geographic Information System. To mosaic the NOAH-H rasters, we used the 25 cm/pixel Mars 2020 Terrain Relative Navigation HiRISE Orthorectified Image Mosaic (‘the orthomosaic’) produced for the Mars 2020 mission (CitationFergason et al., 2021) as the co-registration base for our HiRISE images. We then applied those co-registration transformations to the corresponding NOAH-H rasters. We illustrate some figures in this work with the 6 m/pixel Context Camera (CTX: CitationMalin et al., 2007) mosaic (CitationFergason et al., 2021), but we did not use this product for analysis purposes.
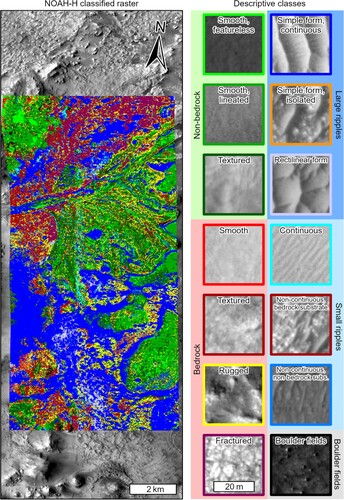
shows a NOAH-H raster where each pixel value corresponds to one of the 14 descriptive classes. For full details about how the NOAH-H rasters were produced, see CitationBarrett et al. (2022).
Figure 2. NOAH-H output. Left: the NOAH-H terrain-classified raster (25 cm/pixel) created from HiRISE image ESP_042315_1985 (25 cm/pixel) overlain on the CTX mosaic of Jezero. This frame has been rotated 5° clockwise (see north arrow). Right: examples of the 14 descriptive classes, shown in their interpretive groups and at the same scale, with coloured outlines as the key for the classified raster. All panels show plate carrée projections.
We co-registered the raw HiRISE images to the orthomosaic using ArcGIS Pro 2.8 software by manually placing a trigonal grid of control points across each image. We placed additional control points around the margins of Jezero crater’s delta front and impact crater rims to improve the co-registration of these topographic features. We also placed control points linking the current image being co-registered to previously co-registered images, where they overlap, to produce as seamless a mosaic as possible. We applied spline transformations to each HiRISE image so that each control point was co-registered exactly with the target mosaic. Then, for each HiRISE image, we applied the same control points and spline transformation to the corresponding NOAH-H raster. NOAH-H created the Jezero crater classified rasters in late 2019, before the orthomosaic was made publicly available (July 2020), which meant the orthomosaic was unavailable as a direct input for NOAH-H. Naturally there are offsets between our co-registered HiRISE and NOAH-H rasters and the orthomosaic in the spaces between control points. These offsets are most pronounced where there is a topographic offset between control points, such as the delta front. In such places the offset can be as much as 50 m, but such high-relief regions are lower priority for characterisation by NOAH-H since they are most likely already rover no-go zones based on their topography alone. On flatter ground, pixel offsets distant from control points are typically ∼1 m.
Neighbouring co-registered NOAH-H rasters partially overlap each other. When classifying a given pixel, NOAH-H uses contextual information in the nearby pixels in the host HiRISE only. Consequently, NOAH-H has less contextual information to classify image-edge pixels. Furthermore, pixels in regions of NOAH-H overlap are often not classified consistently. To create the NOAH-H mosaics, we cropped each raster edge by ∼120 pixels (30 m), and determined a priority order to resolve pixel classification conflicts. Where pixel conflicts occurred, we wanted the final mosaic to include the most reliable classifications and more hazardous classifications for rover traversability. CitationBarrett et al. (2022) summarise NOAH-H class identification reliability with three statistics: Precision, Recall, and Intersection over Union (IoU), a combination of the prior. Precision, Recall, and IoU are given by the following formulae:
(1)
(1)
(2)
(2)
(3)
(3) where TP (true positive) equals the number of pixels correctly classified, FP (false positive) equals the number of pixels incorrectly classified, and FN (false negative) equals the number of pixels incorrectly not classified.
Briefly, classes with high Precision are correctly identified (few false positives). If a class is present and NOAH-H finds a high fraction of it, then the class has high recall (few false negatives). Classes with high IoU have few false positives and false negatives. We converted NOAH-H Precision, Recall, and IoU values for each descriptive class into unique scores from 1 to 14, with higher values yielding higher scores. We also converted the seven qualitative hazard assessments in CitationBarrett et al. (2022) for each descriptive class into scores from 1 to 7. We added the scores for each descriptive class together to determine their mosaicking pixel priority, with higher overall scores having higher priority (). Interpretive groups have internally variable hazard levels and higher, less variable Precision, Recall, and IoU than descriptive classes, which meant we could not apply the same pixel prioritisation strategy. Instead, we prioritised the ‘distributed’ interpretive groups, which generally do not conflict with each other, over the ‘surface’ interpretive groups ().
Table 1. Pixel values (descending priority) used when making the NOAH-H descriptive classes mosaic.
Table 2. Pixel values (descending priority) used when constructing the NOAH-H interpretive groups mosaic.
We used the ArcGIS Pro ‘Lookup’ and ‘Mosaic to New Raster’ tools to create NOAH-H descriptive class and interpretive group mosaics of Jezero, setting the ‘Mosaic Operator’ parameter to ‘maximum’ to ensure that where pixel classification conflicts occurred the pixel with the highest value, and hence the highest pixel priority, was included in the final mosaic.
The interpretive groups mosaic provides an overview of Jezero’s terrain types, whereas the descriptive class mosaic is useful for studies of the details of the area. The interpretive groups are identified with higher Precision and Recall than the descriptive classes but lack the granularity of the descriptive classes. The use of both provides a more complete analysis of the site.
3. Results
The descriptive class and interpretive group NOAH-H mosaics for Jezero crater are shown in and , respectively. Overall, the model classified the terrain well despite not having been trained using HiRISE images of Jezero. The variety of training examples for the descriptive classes in Arabia Terra appears to have been broad enough to produce a generic model that repeatably identifies similar textures at Jezero (a,b). Where errors occur, these are typically because of textures with characteristics of multiple classes in the transitional regions between distinct classes, for example between rugged, textured, and fractured bedrock. Such errors were described for Arabia Terra (CitationBarrett et al., 2022), and would probably occur wherever the model would be applied.
Figure 3. The 25 cm/pixel NOAH-H descriptive class mosaic of Jezero crater overlain on the 6 m/pixel CTX basemap. The locations of several subsequent figures are shown. See Main Map 1 for the full version of this product.
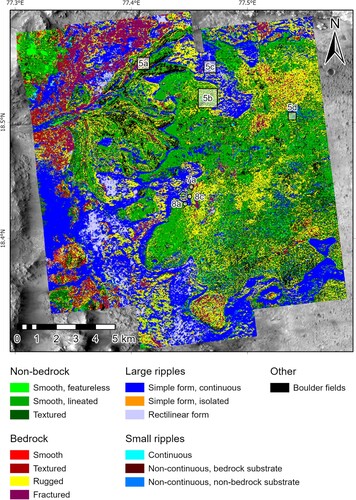
Figure 4. The 25 cm/pixel NOAH-H interpretive group mosaic of Jezero crater overlain on the 6 m/pixel CTX basemap. See Main Map 2 for the full version of this product.
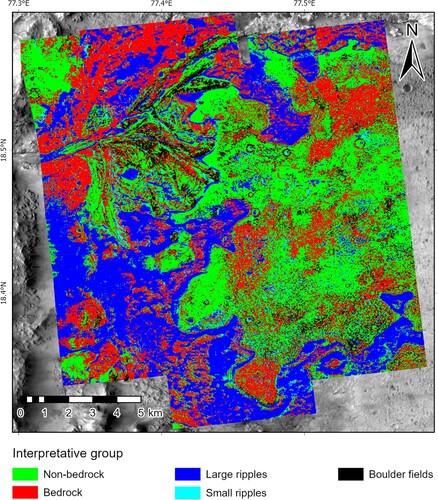
Figure 5. Case studies of NOAH-H classifications in Jezero. North is at the top of all the panels. (a) and (b) show examples where NOAH-H has performed well. (c) and (d) show examples where NOAH-H has performed less well. All panels show the Jezero descriptive class mosaic overlain on the HiRISE orthomosaic in a plate carrée projection. See the legend in to interpret the colours in this figure. (a) NOAH-H accurately reproduces sharp contacts between different terrain types. (b) NOAH-H accurately identifies bedrock ridges protruding from non-bedrock cover. (c) NOAH-H occasionally misclassifies ripples with complex ridge crest morphologies as bedrock – rugged. (d) NOAH-H has correctly classified large ripples – continuous in the east of this impact crater, but smaller ripples in the centre and west are instead classified as non-bedrock – smooth, lineated material.
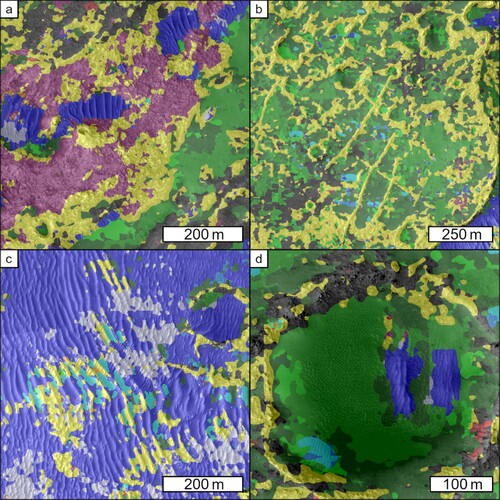
While transverse aeolian ridges (TARs: CitationBalme et al., 2008) at Jezero and Arabia Terra have similar endmember morphologies, Oxia Planum TARs are typically oriented NE–SW (CitationFavaro et al., 2021), whereas large TARs at Jezero are primarily oriented N–S (: CitationDay & Dorn, 2019). Despite this, the large ripples descriptive classes (synonymous with TARs) were readily identified, meaning the model can recognise such textures irrespective of their orientation.
However, Jezero TARs also differ from those in Arabia Terra in terms of their relative abundances of the endmember morphologies. In the training dataset, rectilinear ripples are rare and occurred only in small patches isolated from other ripple types. In Jezero, fields of parallel TARs occasionally contain patches of rectilinear ripples, which NOAH-H can correctly identify, but the model can make misclassifications where TAR morphologies appear intermediate between simple and rectilinear forms. For example, Jezero TAR ridge crests can have small, oblique or perpendicular, superposing ripples, giving the ridge crest a herringbone pattern absent in the training dataset. This is different enough from a sharp ridge that the model cannot identify such TARs as simple form ripples, however, they also lack the cell-like morphology of rectilinear ripples. Therefore, NOAH-H interprets the terrain based on its irregular pattern of high-relief material, without factoring in the aeolian context for such herringbone ridges that would lead a human to conclude they are simply a different expression of large continuous ripples. The result is that the model often incorrectly classifies such ripple crests as bedrock – rugged (c). While rugged bedrock and herringbone ripple crest textures are similar on a purely descriptive level, they belong to different interpretive groups, making this a major misclassification.
We observe a less drastic error where NOAH-H misclassifies very small aeolian bedforms (d). This texture is absent from the training dataset. A human geomorphologist can see, based on the context, that these bedforms are merely smaller than the type examples in the training dataset. However, it seems that the textural characteristics that the NOAH-H relies on to identify aeolian bedforms are larger in scale than the wavelength of these ripples. Instead, the model classifies these features as non-bedrock – smooth, lineated, a class that also consists of relatively smooth material, with lineated patterns at or near the image resolution. We consider this a mistake, but it is encouraging that the model has classified this terrain unknown to it as a non-bedrock class, with an interpretation close to the truth.
4. Discussion
4.1. Improving NOAH-H classifications at Jezero
While the model can distinguish complex patterns on a textural basis, its occasional errors show that it lacks the contextual understanding that human geomorphologists have. To produce a more reliable classification of Jezero, examples of its terrain variants would need to be included in the training dataset. However, this would both require more labelling work and would further complicate the classification scheme.
CitationBarrett et al. (2022) showed that the model can find rectilinear ripples with very high Precision and Recall. This was surprising, since these features are extremely rare in Arabia Terra, and so had very little support in the training dataset. If examples from Jezero had been included, then higher support for this class could have been achieved. However, this would not necessarily improve the classification accuracy of rectilinear ripples. Almost all of the examples in the Arabia Terra training dataset conform to a very similar morphology, making rectilinear ripples a very distinct class. A representative suite of examples from Jezero would include a far wider variety of transitional morphologies. This would allow these morphologies to be classified but could also dilute the presently very distinct class that represents the well-defined rectilinear pattern, potentially reducing the reliability overall. Such considerations should be made when deciding how broad to make a class, and where to draw the lines between different textures.
As a further example, the misclassification of small ripples as non-bedrock – smooth, lineated could be remedied with more training, with the probable result of expanding the small ripples classes at the expense of the non-bedrock classes. The important thing to judge for such a minor misclassification is whether the model performance improvement, if any, will be worth the time and effort involved in additional training.
4.2. NOAH-H comparison with human-made photogeological map
In preparation for Perseverance’s landing, the Mars 2020 Science Team produced a photogeological map of the bedrock and surficial units in Jezero crater (CitationStack et al., 2020). The mapping area was divided into 166 1.2 × 1.2 km quads, which were shared among 63 mappers. The whole mapping process, from initial training, to quad mapping, to final map unification was carried out between May 2019 and April 2020. Arguably, the most important product of this mapping process is the understanding of the sequence of geological events that occurred in the mapping area, which is communicated by the map. This understanding of the geological history of Jezero crater, which could only be realised over the course of numerous discussions, will be vital to scientific hypothesis development and strategic planning of the Mars 2020 mission (CitationStack et al., 2020). Although developing and refining the NOAH-H descriptive classes in Arabia Terra took six months (April–September 2018), no additional training was required before the model was transferred to Jezero crater. The typical classification time for a HiRISE image was ∼15 min. Mosaicking of the four Jezero NOAH-H rasters took less than one day. Therefore, NOAH-H products might be useful baseline products to create in advance of human-led geological mapping to expediate landing site characterisation. However, NOAH-H cannot replicate the most important functions of creating a geological map, such as determining the origin, formation sequence, evolution, and subsurface relationships of rock units. This is because NOAH-H merely classifies surface textures where they occur, without incorporating contextual information available to human geologists. Therefore, NOAH-H products are designed as inputs for traversability analyses and might also contribute to, but cannot replace, the conventional photogeological mapping process.
By using NOAH-H, we have produced a terrain classification map of Jezero crater, which is comparable in some ways to the Mars 2020 photogeological map. NOAH-H classifies surface textures, so the best CitationStack et al. (2020) product for a first-order comparison with NOAH-H is their surficial unit map, whose units are listed in . CitationStack et al. (2020) employed a level of surficial unit subdivision approximately equivalent to NOAH-H’s interpretive groups.
Table 3. CitationStack et al. (2020) surficial units and approximately equivalent NOAH-H interpretive groups.
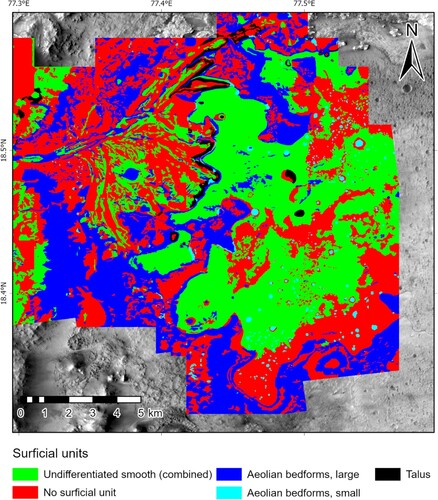
CitationBarrett et al. (2022) derived the NOAH-H groups independently from the CitationStack et al. (2020) surficial units, so naturally they do not precisely correspond with each other. The CitationStack et al. (2020) map summarises HiRISE-scale information, and so they mapped the ‘undifferentiated smooth’ surficial unit according to its general coverage level. NOAH-H classified on a pixel-by-pixel basis, so a given interpretive group is either present in a pixel or not. To improve the correspondence between NOAH-H interpretive groups and the CitationStack et al. (2020) surficial units, we combined the three ‘undifferentiated smooth’ surficial units into one. CitationBarrett et al. (2022) used a threshold across-crest width of 5 m to train NOAH-H to distinguish between small and large ripples. CitationStack et al. (2020) large aeolian bedforms are ∼10s to several 100s of metres long and <1 to ∼10 m across and small aeolian bedforms are a few 10s of metres long and ∼3 m across. Talus and boulder fields are not equivalent, but talus deposits in Jezero crater have been shown to host boulders (CitationSinha et al., 2020), so in our comparison large boulder fields on slopes are probably good proxies for talus. Where CitationStack et al. (2020) map no surficial unit, we assume exposed bedrock units are found in such areas, so we equate the absence of surficial units with the NOAH-H bedrock interpretive group.
shows our simplified version of the CitationStack et al. (2020) surficial units map with the same symbology used for the NOAH-H interpretive group mosaic shown in . Using NOAH-H we have created a remarkably similar product to CitationStack et al. (2020). NOAH-H has accurately reproduced the distribution of large aeolian bedforms across the area. Small aeolian bedforms have low areal coverage in both products. Boulder fields appear to be a good proxy for talus around the fringes of the Jezero delta. NOAH-H and the CitationStack et al. (2020) map broadly agree about the exposure of bedrock in Jezero. Many differences between the products result from the fact that NOAH-H classifies each pixel, whereas the CitationStack et al. (2020) map summarises information over areas.
Figure 6. Simplified surficial unit photogeological map of Jezero crater from CitationStack et al. (2020). We have symbolised units in this map to match similarly defined NOAH-H interpretive groups to ease comparison between these products (see ).
We have quantified our comparison between NOAH-H terrain classifications and the Stack et al. (Citation2020) surficial unit map by creating a confusion matrix for where the two datasets overlap (). The confusion matrix shows how many pixels NOAH-H classified into each interpretive group within areas mapped as surficial units by CitationStack et al. (2020). If the NOAH-H interpretive groups and the CitationStack et al. (2020) surficial units had the same definitions and no misclassifications occurred then all the pixel counts off the table diagonal (highlighted) would be zero, and Precision, Recall, and IoU would be 100%. In practice, misclassifications occur mainly because the NOAH-H interpretive groups and CitationStack et al. (2020) units do not correspond exactly, in addition to the kinds of misclassifications discussed in section 3. As is apparent from a qualitative comparison between and , large ripples is the best performing interpretive group with high Precision, Recall, and IoU. The most common misclassification of large ripples is as bedrock, an example of which is shown in c, but this accounts for only ∼9% of classifications. Non-bedrock also performed well, with bedrock being its most common misclassification accounting for ∼23% of classifications. Bedrock has high recall but low precision, meaning that NOAH-H found much of the bedrock designated by CitationStack et al. (2020), but misclassified many other areas, particularly non-bedrock, as bedrock. As expected, the statistics for the spatially discontinuous groups small ripples and boulder fields are poor, since these classes could be offset by co-registrations errors or because NOAH-H classifies at the pixel scale, whereas in the CitationStack et al. (2020) much pixel-scale detail is lumped in with surrounding units. Additionally, small ripples are more often misclassified as non-bedrock, as seen in d. The boulder fields group performed somewhat better, despite not being equivalent in definition to talus mapped by CitationStack et al. (2020).
Table 4. Confusion matrix showing NOAH-H pixel misclassifications as well as interpretive group Precision, Recall, and IoU statistics.
The CitationStack et al. (2020) map corroborates NOAH-H terrain classifications at the interpretive group level. Ground-truth observations from Perseverance and Ingenuity are needed to test NOAH-H at the descriptive class level.
4.3. NOAH-H comparison with images from Perseverance and Ingenuity
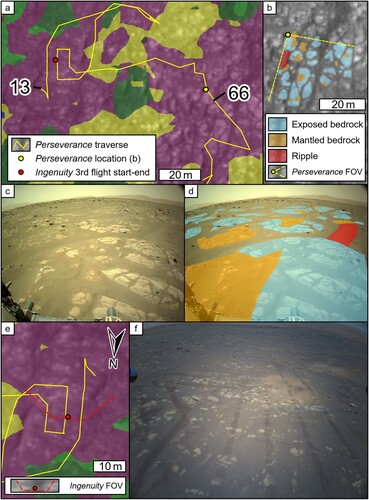
Perseverance landed in terrain classified by NOAH-H as bedrock – fractured (a). To impart a sense of scale, we have correlated the polygonal fracture pattern visible in HiRISE (b) with a Perseverance NavCam image (c,d). While HiRISE images can give the impression that fractured bedrock would be difficult for a rover to traverse because of apparent deep troughs between upstanding patches of bedrock, NavCam images confirm fractured bedrock is generally flat. The amount of non-bedrock material superposing fractured bedrock varies across the area of Perseverance’s early traverse (a), but Ingenuity images taken during the third flight corroborate NOAH-H’s fractured bedrock classification near the landing zone (e,f) despite the poorer exposure compared with the fractured bedrock seen by Perseverance on sol 66 (b–d).
Figure 7. Comparison of the Jezero NOAH-H descriptive class mosaic and Mars 2020 ground observations. North is at the top of each panel unless otherwise indicated. See the legend in to interpret the colours in panels (a) and (e). (a) Perseverance traverse overlain on the semi-transparent NOAH-H mosaic with the HiRISE orthomosaic underneath. The numbers show Perseverance’s final location during the indicated mission sol. (b) HiRISE map of what can be seen in the Perseverance NavCam image shown in (c). (c) Southeast-facing Perseverance NavCam image captured on Sol 66. (d) The NavCam image from (c) annotated to match (b). (e) Approximate takeoff and landing location (red dot) of Ingenuity’s third flight (Sol 64), overlain on the semi-transparent NOAH-H mosaic with the HiRISE orthomosaic underneath. This view has been rotated (note the north arrow), and an approximate field of view indicator added (red dashed line), to make correlation with the Ingenuity image shown in (f) easier. (f) South-facing Ingenuity image taken near the end of its third flight. Perseverance’s tracks visible in this image have a ∼2 m separation.
Ingenuity’s ninth flight covered several NOAH-H terrain classifications (). Toward the end of the ninth flight (a), Ingenuity photographed rugged bedrock, which appears to be similar to fractured bedrock, but with higher relief (b). NOAH-H has identified boulder fields within the rugged bedrock, few of which are apparent in the Ingenuity image. This problem arises because boulder fields, even in the Arabia Terra training areas, are not a surface texture (such as bedrock) but are areas characterised by isolated boulders superposing a surface texture (CitationBarrett et al., 2022). The more rugged the surface texture, the more likely NOAH-H is to classify the texture instead as a boulder field. Still, some loose-looking clasts in the foreground of b are classified correctly as a boulder field.
Figure 8. Comparison of the Jezero NOAH-H descriptive class mosaic and labelled Ingenuity images from the ninth flight (Sol 133). We have rotated the map views in (a) and (c: see respective north arrows) to aid comparison with the Ingenuity images in (b), (d), and (e). (a) The Jezero NOAH-H descriptive class mosaic at an area toward the end of Ingenuity’s flight (red line, direction of travel from bottom to top). (b) Ingenuity Colour Camera image. (c) The Jezero NOAH-H descriptive class mosaic at the start (red dot) of Ingenuity’s ninth flight (red line). Perseverance’s path (yellow line) is shown and its final positions on indicated sols are labelled. (d) Ingenuity Colour Camera image. (e) Ingenuity Colour Camera image. Perseverance rover tracks (separation ∼2 m) give a sense of scale in this image, which applies to the other Ingenuity images in and .
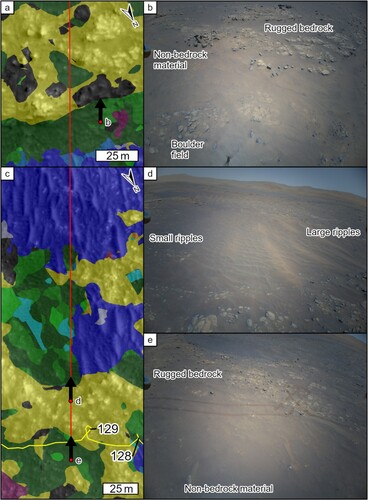
c shows the start of Ingenuity’s ninth flight, which, according to NOAH-H, began on textured non-bedrock material, and successively crossed rugged bedrock, the boundary between non-bedrock material to the left and a field of large ripples to the right, and an expansive large ripple field. Ingenuity images corroborate these terrain classifications. d reveals that the finely textured non-bedrock is in fact a field of small ripples. The fact that NOAH-H partially classified this region as small ripples – continuous, and classified the rest mostly as either lineated or textured non-bedrock, corroborates our hypothesis that at the limit of HiRISE spatial resolution small ripples lose their defining geomorphic characteristics that NOAH-H requires for that terrain classification, resulting in a more generic non-bedrock classification.
From e we interpret that the texture of the non-bedrock material NOAH-H identified at the takeoff zone is probably caused by underlying rugged bedrock and superposing ripples too small for NOAH-H to recognise. The rugged bedrock exposed here resembles the fractured bedrock at Perseverance’s landing zone (), but apparently has a greater density of float rocks.
5. Conclusions
We have used NOAH-H to create terrain classification maps of Jezero crater. Perseverance and Ingenuity images corroborate NOAH-H terrain classifications, despite Jezero landforms never having been incorporated into the model’s training dataset. This demonstrates NOAH-H being used as a generic model that can be transferred to other geographical settings with similar landform assemblages. NOAH-H is not intended to replace the planetary geological mapping process, as its focus was designed to be rover traversability assessment. Nevertheless, it clearly has an application as a tool to aid the mapping process, particularly when a map is needed for mission purposes and there is a strict timeframe for delivery. We are now creating NOAH-H products of the ExoMars Rosalind Franklin rover Oxia Planum landing site to feed into terrain traversability planning, in combination with topographic and rover engineering parameters.
Software
We used ESRI ArcGIS Pro 2.8 for co-registration of HiRISE and NOAH-H rasters, NOAH-H pixel prioritisation, and generation of the NOAH-H terrain classification maps of Jezero crater. NOAH-H is a deep learning semantic segmentation software developed by SciSys Ltd for the European Space Agency to aid preparation for the ExoMars Rosalind Franklin rover mission.
Open Scholarship
 This article has earned the Center for Open Science badge for Open Data. The data are openly accessible at https://doi.org/10.21954/ou.rd.17121482.v1.
Supplemental Material
Download Zip (78.7 MB)Acknowledgements
JW acknowledges support from the European Space Agency (ESA) as an ESA Research Fellow received during the write-up of this work. The authors wish to thank the three reviewers, Heike Apps, Gerhard Paar, and Adrian J. Brown for their thoughtful reviews, which helped us improve the clarity of the map and the quantitative rigour of the manuscript.
Disclosure statement
No potential conflict of interest was reported by the author(s).
Data availability statement
The NOAH-H mosaics presented in this work, their constituent georeferenced NOAH-H classified rasters, and the control points are freely available through the Open University Open Research Data Online data repository (https://doi.org/10.21954/ou.rd.17121482.v1). The mosaics and rasters can be freely resymbolised to meet the colour needs of users. The Mars 2020 mission data are freely available at https://mars.nasa.gov/mars2020/multimedia/raw-images/. The HiRISE images discussed in this work are freely available from https://www.uahirise.org/ The HiRISE and CTX mosaics used in this work are freely available from https://astrogeology.usgs.gov/search/map/Mars/Mars2020/JEZ_hirise_soc_006_orthoMosaic_25cm_Eqc_latTs0_lon0_first and https://astrogeology.usgs.gov/search/map/Mars/Mars2020/JEZ_ctx_B_soc_008_orthoMosaic_6m_Eqc_latTs0_lon0, respectively.
Additional information
Funding
Related Research Data
References
- Balme, M. R., Berman, D. C., Bourke, M. C., & Zimbelman, J. R. (2008). Transverse Aeolian Ridges (TARs) on Mars. Geomorphology, 101(4), 703–720. https://doi.org/10.1016/j.geomorph.2008.03.011
- Barrett, A. M., Balme, M. R., Woods, M. J., Karachalios, S., Petrocelli, D., Joudrier, L., & Sefton-nash, E. (2022). NOAH-H, a deep-learning, terrain classification system for Mars: Results for the ExoMars Rover candidate landing sites. Icarus, 371, 114701. https://doi.org/10.1016/j.icarus.2021.114701
- Day, M., & Dorn, T. (2019). Wind in Jezero Crater, Mars. Geophysical Research Letters, 46(6), 3099–3107. https://doi.org/10.1029/2019GL082218
- Farley, K. A., Williford, K. H., Stack, K. M., Bhartia, R., Chen, A., de la Torre, M., Hand, K., Goreva, Y., Herd, C. D. K., Hueso, R., Liu, Y., Maki, J. N., Martinez, G., Moeller, R. C., Nelessen, A., Newman, C. E., Nunes, D., Ponce, A., Spanovich, N., … Wiens, R. C. (2020). Mars 2020 mission overview. Space Science Reviews, 216(8), https://doi.org/10.1007/s11214-020-00762-y
- Favaro, E. A., Balme, M. R., Davis, J. M., Grindrod, P. M., Fawdon, P., Barrett, A. M., & Lewis, S. R. (2021). The Aeolian environment of the landing site for the ExoMars Rosalind Franklin Rover in Oxia Planum, Mars. Journal of Geophysical Research: Planets, 126(4), https://doi.org/10.1029/2020JE006723
- Fergason, R. L., Hare, T. M., Mayer, D. P., Galuszka, D. M., Redding, B. L., Smith, E. D., Shinaman, J. R., Cheng, Y., & Otero, R. E. (2021). Mars 2020 terrain relative navigation flight product generation: Digital terrain model and orthorectified image mosaics. 51st Lunar Planet. Sci. Conf. Abstract #2020.
- Malin, M. C., Bell, J. F., Cantor, B. A., Caplinger, M. A., Calvin, W. M., Clancy, R. T., Edgett, K. S., Edwards, L., Haberle, R. M., James, P. B., Lee, S. W., Ravine, M. A., Thomas, P. C., & Wolff, M. J. (2007). Context camera investigation on board the Mars Reconnaissance Orbiter. Journal of Geophysical Research, 112(E5). https://doi.org/10.1029/2006JE002808
- McEwen, A. S., Eliason, E. M., Bergstrom, J. W., Bridges, N. T., Hansen, C. J., Delamere, W. A., Grant, J. A., Gulick, V. C., Herkenhoff, K. E., Keszthelyi, L., Kirk, R. L., Mellon, M. T., Squyres, S. W., Thomas, N., & Weitz, C. M. (2007). Mars reconnaissance orbiter’s high resolution imaging science experiment (HiRISE). Journal of Geophysical Research, 112(E5), E05S02. https://doi.org/10.1029/2005JE002605
- Poulet, F., Gross, C., Horgan, B., Loizeau, D., Bishop, J. L., Carter, J., & Orgel, C. (2020). Mawrth Vallis, Mars: A fascinating place for FutureIn SituExploration. Astrobiology, 20(2), 199–234. https://doi.org/10.1089/ast.2019.2074
- Quantin-Nataf, C., Carter, J., Mandon, L., Thollot, P., Balme, M. R., Volat, M., Pan, L., Loizeau, D., Millot, C., Breton, S., Dehouck, E., Fawdon, P., Gupta, S., Davis, J. M., Grindrod, P. M., Pacifici, A., Bultel, B., Allemand, P., Ody, A., … Broyer, J. (2021). Oxia Planum: The landing site for the ExoMars “Rosalind Franklin” rover mission: Geological context and prelanding interpretation. Astrobiology, 21(3), 345–366. https://doi.org/10.1089/ast.2019.2191
- Sinha, R. K., Rani, A., Conway, S. J., Vijayan, S., Basu Sarbadhikari, A., Massé, M., Mangold, N., & Bhardwaj, A. (2020). Boulder fall activity in the Jezero Crater, Mars. Geophysical Research Letters, 47(23), 1–10. https://doi.org/10.1029/2020GL090362
- Smith, D. E., Zuber, M. T., Frey, H. V., Garvin, J. B., Head, J. W., Muhleman, D. O., Pettengill, G. H., Phillips, R. J., Solomon, S. C., Zwally, H. J., Banerdt, W. B., Duxbury, T. C., Golombek, M. P., Lemoine, F. G., Neumann, G. A., Rowlands, D. D., Aharonson, O., Ford, P. G., Ivanov, A. B., … Sun, X. (2001). Mars Orbiter laser altimeter: Experiment summary after the first year of global mapping of Mars. Journal of Geophysical Research: Planets, 106(E10), 23689–23722. https://doi.org/10.1029/2000JE001364
- Stack, K. M., Williams, N. R., Calef, F., Sun, V. Z., Williford, K. H., Farley, K. A., Eide, S., Flannery, D., Hughes, C., Jacob, S. R., Kah, L. C., Meyen, F., Molina, A., Quantin-Nataf, C., Rice, M., Russell, P., Scheller, E., Seeger, C. H., Abbey, W. J., … Aileen Yingst, R. (2020). Photogeologic map of the perseverance Rover field site in Jezero Crater constructed by the Mars 2020 science team. Space Science Reviews, 216(8), 1–47. https://doi.org/10.1007/s11214-020-00739-x
- Vago, J. L., Westall, F., Coates, A. J., Jaumann, R., Korablev, O., Ciarletti, V., Mitrofanov, I., Josset, J. L., De Sanctis, M. C., Bibring, J. P., Rull, F., Goesmann, F., Steininger, H., Goetz, W., Brinckerhoff, W., Szopa, C., Raulin, F., Edwards, H. G. M., Whyte, L. G., … Carreau, C. (2017). Habitability on early Mars and the search for biosignatures with the ExoMars Rover. Astrobiology, 17(6–7), 471–510. https://doi.org/10.1089/ast.2016.1533