
 ?Mathematical formulae have been encoded as MathML and are displayed in this HTML version using MathJax in order to improve their display. Uncheck the box to turn MathJax off. This feature requires Javascript. Click on a formula to zoom.
ABSTRACT
The aim of this article and associate Main Map is to highlight the social and economic diversity of the Ruhr area in Germany through the use of multivariate analysis and visualization. To this end we combine two different datasets. Demographic parameters stemming from the 2011 German census and socioeconomic indicators obtained from the microdialog of the German post service. Due to the different spatial resolution of the two datasets, we aggregated the data at the neighbourhood (Stadtteil) level. The multivariate analysis was carried out at this scale using Self-Organizing Maps (SOM), an artificial neuron network, which uses an unsupervised learning mechanism for projecting multidimensional data in a low (in our case two) dimensional space. First we used a visualization technique to better comprehend the relationship between our observations via reducing the dimensionality or complexity of our input data. At the same time, we established a global statistical relationships between the indicators. Finally, using these results we built clusters for revealing the distribution of socioeconomic profiles over the whole region. Our results demonstrate that structural inequalities resulting from the processes of industrialization/deindustrialization in the region are still widely persistent and result in characteristic patterns along the three main rivers, the Lippe, Emscher and the Ruhr. In close connection with this, three types of societal segregation patterns become clearly evident in the Ruhr area, namely nationality, age and economic power.
1. Introduction
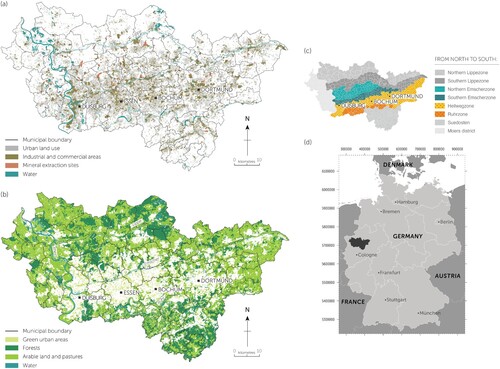
The Ruhr metropolitan region (Ruhrgebiet) in Germany covers an area of 4435 km with a population of just above 5.1 million (2019) and was considered to be the industrial powerhouse of Germany (see also (c)). With 53 cities and towns it is also the most densely populated polycentric urban area and exhibits the strongest socioeconomic diversity not only between but also within cities. Due to its strong industrial past the Ruhr area has received multiple waves of foreign workforce since the second half of the nineteenth century resulting in a multi-ethnic population. It also houses 22 Universities and colleges making it the area with the highest density of further and higher education establishments in Germany. This diversity is usually reflected in official statistics as an urban-rural divide between the four major University cities (Dortmund, Essen/Duisburg, Bochum) and the rest of the region, therefore losing sight of the beautiful social mosaic of this region.
Figure 1. (a) Green and recreational land use. (b) Urban, commercial and industrial land use. (c) Schematic view of the eight historical zones of the Ruhr area (d) The location of the Ruhr area in Germany. Data source: Urban Atlas of the Copernicus Land Monitoring Service (Urban Atlas, Citation2019)
For many decades, the economic dynamism of the Ruhr Area was shaped primarily by the production industry. Since the crisis of the coal and steel industries in the 1950s however, the tertiary sector advanced incrementally to the foreground. Between 1957 and 1999 the Ruhr Area lost 87 % of its employees in the previously imperious coal and steel industries (calculations based on Regionalkunde Ruhrgebiet, Citation2019). Today, the services sector is by far the most dominant in the regional market: In 2015, 78 % of employees worked here exceeding the national average by four per cent. Even though a detailed discussion of latter process that is often referred to as Strukturwandel or structural change is beyond the scope of this article, we will uncover its characteristic traces in the results sections.
We should emphasize here that industrialization took place in several consecutive phases (Wehling, Citation2015) from the southern area along the Ruhr river northwards, leaving definitive territorial and socioeconomic marks behind (Lengyel, Citation2021; Lengyel & Friedrich, Citation2019; Wehling, Citation2015). Their varying profiles can be attributed to resource availability, technological advances and the political and economical whims and interests of the given period in time (Wehling, Citation2015). The scope of this article and associate Main Map is to demonstrate how these zones can be characterized by rather distinctive socioeconomic (and land-use) profiles up until today. The main zones considered here are the fluvial areas next to the Ruhr, Emscher and Lippe rivers, and the socalled Hellwegzone which connects the former large industrial city-centres of Dortmund, Bochum, Essen and Mülheim an der Ruhr (see (c)). As depicted in (a) industrial, commercial and urban land uses are concentrated mainly in the Emscher and Hellweg zones (located in the central parts of the Ruhr region), whereas green and recreational areas dominate the outskirts ((b)).
2. Datasets
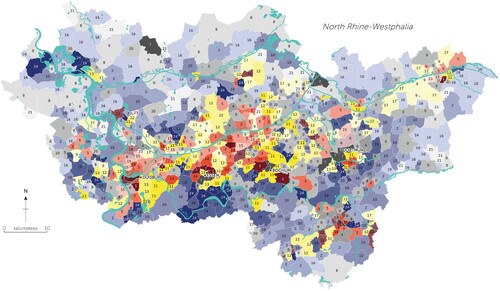
This article brings together two different datasets to characterize the socioeconomic profiles of sub-city areas and identify their spatial distribution. The demographic parameters from the 2011 German census (Zensus, Citation2011) are combined with socioeconomic indicators obtained from the microdialog of the German post service (Microdialog, Citation2017). Thereby indices for purchasing power and net rent price are calculated from the latter, whilst the percentage of foreign and German population, residents under 18 and over 65-year-olds as well as household characteristics are all downloaded from the official census website (Zensus, Citation2011). Small scale census data is provided for 100×100 metre grid whilst microdialog data is delivered at the building level. Due to the different resolution of the two datasets, we aggregated the data at the neighbourhood or Stadtteil scale (in total 732 for the entire region as shown in ) and calculated respective mean values for all the variables. Moreover, we used census data from the Landesdatenbank Nordrhein-Westfalen (Landesdatenbank NRW, Citation2019) and from the Regional Planning Association Ruhr (Regionalstatistik Ruhr, Citation2019) to identify prevailing societal and economic trends for the entire metropolitan region. The advantage is that at the larger city-level variables are available for longer time periods and enriched by additional indicators such as employment, education and economic performance. Temporal resolution is dependent on the observed feature, e.g. population numbers can be retrieved annually from 1976 onward, however GDP and employment data is only available from 1990 to 2000 respectively.
Figure 3. Distribution of the twenty-five socioeconomic SOM clusters over the Ruhr region
3. Methodology
The following results section starts with a short summary of metropolitan scale trends that are based on own calculations using data from the official German statistics office (Federal Statistical Office of Germany, Citation2019; Landesdatenbank NRW, Citation2019) and the Regional Planning Association Ruhr (Regionalstatistik Ruhr, Citation2019), attainable mainly for the cities and administrative districts (Kreis, e.g. Kreis Recklighausen or Ennepe-Ruhr-Kreis). The local multivariate analysis is then carried out at the neighbourhood scale using Self-Organizing Maps (SOM), an artificial neuron network (ANN) developed by Kohonen (Citation1990) which uses a competitive learning mechanism for projecting multidimensional data in a low dimensional space. ANNs in general are capable of both machine learning and pattern recognition. They are a made up of interconnected nodes – or artificial neurons – that communicate with each other via signal-transmission. These signals are numerical values that are received by the neurons and then further processed according to the learning mechanism in question to reach an output. Furthermore, there are weights assigned to both the nodes (or neurons) and to their connections (or edges) which are incrementally adjusted throughout the learning process. In the case of SOM, data projection happens in a way that similar values in the input space are mapped into the same neuron or to its close vicinity in the output space.
Accordingly, let us consider an n dimensional vector x as our input and a set of nodes v with indices i of the model space. Each node is assigned a weight vector . In the training process the node with a weight most similar to the input vector is referred to as the best matching unit (BMU) characterized by its index u (Agarwal & Skupin, Citation2008). The BMU and the nodes in its vicinity are incrementally adjusted according to,
(1)
(1) where t is the current iteration,
a gradually decreasing learning rate and
the so-called neighbourhood function. The latter is dependent on the distance
between the BMU and the respective node v at iteration t. Here, we apply a Gaussian kernel function with an adaptive (Agarwal & Skupin, Citation2008) kernel environment
, which is incrementally decreasing with the number of iterations t as
(2)
(2) To sum up, the output of a SOM can be visualized as a two-dimensional spatial representation of the statistical relations between the observations. Accordingly, the axes of the SOM output (see ) represent measures of statistical dis/similarity expressed as the distance between observations (Kourtit et al., Citation2012).
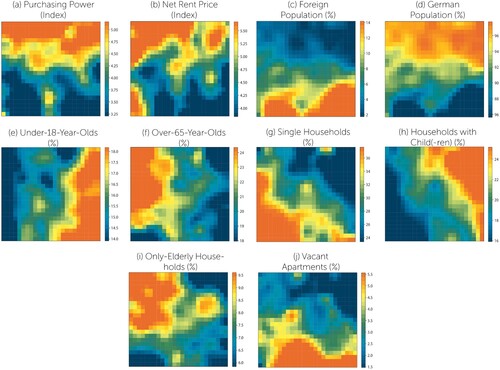
Figure 2. The ten SOM component maps. Values are defined as percentages (%) or indices ranging between 1 (very low) an 6 (very high). Data sources: (Microdialog, Citation2017; Zensus, Citation2011).
In comparison with other dimensionality reduction methods, e.g. Principal Component Analysis (PCA) or t-distributed Stochastic Neighbour Embedding (t-SNE), an important advantage of SOM is that it provides information at each node position of the 2D map topology and as a result allows for detection and visualization of the most characteristic patterns in the dataset (Unglert et al., Citation2016). It has also been shown that SOM is somewhat less robust than PCA in estimating the optimal number of clusters (Unglert et al., Citation2016) but performs better when dealing with nonlinear problems (Aguado et al., Citation2008). In the context of this study, the above mentioned visual clustering feature is ideal for identifying and representing multilevelled segregation phenomena over the observed territory. SOM thus constitutes a natural choice for the detection and mapping of the complex social economic relationships addressed in Section 6.
4. Current trends in the Ruhr area
4.1. Societal dynamics today
As far as current population dynamics are concerned, the single most important trend is the widely prevalent demographic change which is referring to birth rates falling constantly below mortality rates. This culminates in a so-called aging society and decreasing population numbers (Lyberaki et al., Citation2013). The difference between live births and deaths in the Ruhr area has been negative since the mid 1970s (own calculations based on data from Landesdatenbank NRW, Citation2019). In the following years and in some recent cases, net population balance was compensated by migration waves, as was the case between 2014 and 2016, but overall the balance remained negative. The official website of the Regional Planning Association Ruhr estimates an almost 200,000 or four per cent decline of inhabitants between 2014 and 2040. At the same time the number of above 65 year-olds will rise by 310,000 (Regionalstatistik Ruhr, Citation2019). Whilst the Ruhr population is shrinking and getting older (Rienow et al., Citation2014), it is also becoming increasingly heterogeneous. The share of foreign inhabitants was 16.2 % in 2018, which is 3.6 % higher than the year before. The largest group with foreign nationality (in 2018) comes from Turkey with 24.7% followed by Syria with 10.0% and Poland with 7.6% (Regionalstatistik Ruhr, Citation2019). In comparison, at the national level the proportion of foreign nationals was 12.2% (Federal Statistical Office of Germany, Citation2019), which is four per cent lower than in the Ruhr area for the same year. In the Ruhr area, the above described general trends of shrinking and aging population are further amplified by the decline of heavy industry (Strohmeier, Citation2003).
4.2. Economic structural change
The lengthy restructuring process of old industrial areas may follow rather diverging paths (Birch et al., Citation2010). In the Ruhr area, a defining characteristic is the diverging timeline of its zonal development: some spatial units faced restructuring challenges earlier than others (Rehfeld & Nordhause-Janz, Citation2017; Wehling, Citation2014) which ultimately contributed to the exacerbation of intraregional differences discussed in Section 6. For example, in the mid 1960s mines in Emscher agglomerations were still highly productive, therefore priorities of industrial companies determined land use, land availability and accordingly the direction of urban development. This rendered the settling of new businesses and the implementation of urban regeneration projects almost impossible (Wehling, Citation2015). Consequently, the regional competitive ability of Emscher settlements was severely restricted compared to the more favourable urban development path of larger Hellweg cities (Duisburg, Mülheim an der Ruhr, Bochum, Essen, Dortmund) where economic restructuring and urban rehabilitation strategies were already taking roots. In comparison to other industrial regions in Europe, population dynamics of the structural change in the Ruhr area can be considered rather stable, loosing only 0.4 million inhabitants between 1961 and in 2019 (Rehfeld & Nordhause-Janz, Citation2017). Although the dynamic interplay of extensive change and structural persistence did incrementally allow for its economic profile to become more diversified (Berndt, Citation2001), GDP trends in the dusk of the restructuring process between 1996 and 2003 were less favourable than those of most other industrial regions in England and France (Birch et al., Citation2010). However, this can also be partly attributed to unfavourable performance of the German economy following the German reunification (Birch et al., Citation2010).
Similar to other post-industrial agglomerations in Europe, the restructuring process in general has led to high (and lengthy) unemployment rates and to a large share of the population working and living without secure long-term perspectives (Netrdová & Nosek, Citation2016). Latter is strongly indicated for-instance by the high and continuously growing share of people living on social subsidies. The 15.3 % minimum hedging rate in the Ruhr region in 2015 was more than three per cent higher than of its federal state of North Rhine-Westphalia with 12.0 %(own calculations based on data from the Federal Statistical Office of Germany, Citation2019). Furthermore, these trends may also lead to an increase in small-scale societal polarization and may also have rather diverging zonal- and micro-scale projections, the main topic of the next section.
5. Distribution of neighbourhood-level socioeconomic clusters over the Ruhr area
5.1. Component maps
shows the values of vectors for every artificial neuron or node on the 2D map and for each of the ten features/components found to be significant for this analysis. We must stress that there can be multiple geographical neighbourhoods assigned to one node in the 2D model space ( and ). The component maps of the neural network may be interpreted in the following way: brighter orange-red correspond to higher values, while darker cyan/blue represent lower values. Therefore, neighbourhoods located in the upper left corner are characterized by high intensities of purchasing power, net rent price, share of German population and percentage of elderly households (having a positive correlation). These have been assigned to clusters 24, 19 and 11 according to the Hit Map in . Furthermore, these latter neighbourhoods are each in a negative correlation with neighbourhoods in the lower right corner (the very opposite side of each SOM map) exhibiting below average rents, purchasing power and elderly, and concurrently very high share of foreign population and under-18-year-olds (). These are located in clusters 17, 5 and 19, according to . Again, these correlate strongly with one another and exhibit a negative statistical relationship with features of the previously described upper-left corner. As we already mentioned in the theoretical introduction, statistical (dis-)similarity is expressed as the distance between the nodes of the 2D maps (as well as the Hit Map): the further apart two neurons are located the stronger and more significant the negative correlation and vice versa. It is also important to note here that in the two-dimensional maps (), the three types of societal segregation patterns (Kersting et al., Citation2009; Wehling, Citation2014, Citation2015) in the Ruhr area become clearly evident:
Nationality: The inverted appearance of Component Maps ( c–d) suggests that clusters in the bright orange/red area in the bottom of Component Map (c) which have high foreign population intensities are at the same time in the very dark parts of Component Map (d) characterized by below average percentage of German inhabitants.
Age: The above observation also holds true for the relationship between Component Map (e) (share of under-18-year-olds) and Component Map (f) (percentage of over-65-year-olds), although these two maps are inverted along the vertical axes.
Economic power: Here, we observe a strong South-North separation in the model space between high and low purchasing power and net rent price (see Component Maps ( a–b)). The lower left corner is also of interest, where we observe high net rent prices but at the same time low to very low purchasing power. This area of the Hit Map pertains mostly to cluster 7 and will be further discussed in the next section.
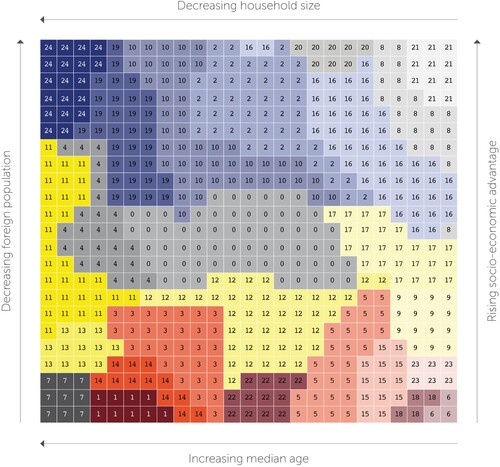
Figure 4. SOM Hit Map: Distribution of SOM clusters over the 2D model space.
5.2. Clusters
Clusters of the Self-Organizing Maps are shown in and they are constructed in the following way: The ten component maps () are being juxtaposed and layered upon each other so that each of the geographical neighbourhoods (remapped into the 2D model-space using the SOM algorithm) are located at the exact same point on all of the Component Maps as well as on the Hit Map. Therefore, knowing their location, we can then easily deduce the cluster to which they belong. Moving on the surface of the Hit Map showing the clusters in from right to left (i.e. from less towards more transparency) we observe increasing median age and decreasing household size, while from the bottom towards the top we encounter rising socioeconomic advantage and decreasing foreign population (from red towards blue). We should note here that Cluster 7 (bottom left corner) indicated in black on the Hit Map and not red as one might expect, is somewhat of an outlier. Cluster 7 is characterized by low purchasing power but high rental values and high share of single households, suggesting an interesting and unusual local dynamic, similar to that of commencing gentrification processes. However, justifying this assumption would require further detailed inspection that is beyond the scope of this article.
Focusing now on the distribution of clusters on the regional map shown in , there is an evident pattern of more red and yellow neighbourhoods in the central areas (Emscher and Hellweg zones) with grey and blue colours dominating the outer neighbourhoods. Clusters on the lower half of the output space () concentrate north and south of the Emscher river (), justifying as well as bringing together our observations from the trend analysis discussed earlier. It is also important to note that these clusters correspond to areas where the prevalence of green and recreational land use is at its scarcest, as depicted in , and where industrial production was most intensive regionally, mostly in the end of 19th and the first half of the twentieth century.
These results correspond to and underline relationships at the zonal scale: socioeconomic factors are demonstrating very clear spatial patterns, whereby more prosperous areas characterized by strong economic profiles in the outskirts surround less affluent zones that are at times gradually ‘shrinking’ (e.g. southern Emscher zone). Thereby, it is especially the neighbourhoods south of the Emscher river that exhibit rather unfavourable values, whilst northern ones seem to perform somewhat better, but still far below the regional average. This trend that appears to start in central Oberhausen continues its course along the Emscher river to the east, up until the city of Castrop-Rauxel. The latter section of the Emscher river covers approximately the length of the ‘Emscher Island’, a lengthy piece of land between the Emscher and the Rhein-Herne Canal. Based on the SOM analysis, it is evident that from a regional perspective, sustained investment should be targeted in this wider area. The North-South divide along the Emscher river that we discussed so far is then being rotated (at Castrop-Rauxel) to reach the city of Dortmund as the Emscher alters its course and runs in South-North direction. Here, the more disadvantaged areas cluster to the West of the river and those with somewhat more favorable values to the East. Interestingly, the centre of Dortmund is one of the few cases containing several neighbourhoods from Cluster 7. Again, the presence of cluster 7 may signal initial phases of gentrification tendencies in the vicinity of Dortmund city centre and of the Technical University Dortmund (Wittowsky et al., Citation2020). Some final remarks on our previously defined societal segregation patterns; in general we observe more vibrant colours in the South as opposed to more fading colours in the North (with the Emscher being the major dividing element) suggesting younger populations and larger household sizes in the northern parts of the region. It is the Lippe zone in particular that appears to attract a larger share of young families with more affluent backgrounds. Secondly, we can observe that the latter mentioned centre-periphery divide (both in the purchasing power and in ethnic distribution) is further intensified by enhanced small-scale polarization at the boundaries of the different zones.
It should be stressed that these findings are representative of the historical and characteristically polycentric development of the study area. Until the beginning of the nineteenth century, small-scale industrial production took place exclusively south of the Ruhr river. The technological shift from shallow to shaft mining signalled the moment of first northwards industrial expansion from the Ruhr-zone into the Hellweg-zone (see (d)), starting with 1837. Already since the middle ages, this area was dotted with smaller cities (such as Duisburg, Essen, Bochum, Dortmund) due to the presence of an important trading route ‘Hellweg’ (the eponym of the region). Starting in the 1870s, the unification of Germany and the expansion of the national railway system with its material-demand and its opening up of new markets gave an unprecedented impulse for basic industries. These trends, coupled with increasingly powerful extraction technologies, led to the sprawling of coal mines up until the Emscher Zone. Previously, the area on both sides of the Emscher was rather swampy, experiencing frequent flooding events and it was therefore scarcely inhabited. In the dawn of the first world war, economic recession and the resulting decrease in investment capacity led to the closing of numerous – less technologically efficient – coal mines in the Ruhr-, and Hellweg-zones. However, the reconstruction after WW2 demanded raw material and thus a powerful and efficient industrial Ruhr region, whereby now production mainly concentrated in the Emscher zone's large scale so-called ‘combined facilities’ (Wehling, Citation2014), and this remained the case until the end of the decline of basic industries in the region. Finally, from a societal perspective, it is important to mention that the Ruhr area has been attracting foreign workforce throughout all the industrialization phases. As an example, the 1960s brought a series of recruitment agreements, e.g. with Italy, Spain, Greece, Turkey and Morocco (Schumacher, Citation2009). Triggered by the economic crisis in Germany and the decline in the importance of heavy industries, foreign recruitments came to a halt in 1973 (Schumacher, Citation2009). Nevertheless, as non-German workers living in the area had the right to bring along their families, the foreign population continued to rise (Wehling, Citation2014), mostly in the Emscher and less predominantly in the Hellweg zones (as also seen in ). This brief overview demonstrates that throughout history the location of newly emerging settlements was dictated by the geomorphological distribution of coal and thus the economic, social and political influence of basic industries. Wehling (Citation2015). The latter described South-North expansion of basic industries and the corresponding time lag for restructuring opportunities – discussed in detail in the paragraph ‘economic structural change’ in Section 5 – can be still observed on the spatial distribution of social economic clusters in .
6. Conclusions
Regarding data availability, the 100×100 metre cell resolution of the German census from 2011 (Zensus, Citation2011) and its rich number of demographic and household-structural parameters provide an excellent basis for further geographical analysis. However, since indicators for the economic performance of inhabitants are largely missing, we had to retrieve these from an external source (Microdialog, Citation2017). As anticipated, the two accessible microdialog features of purchasing power and net rent price, were strongly correlated (see also ( a–b)). Therefore, additional information on economic performance, e.g. share of people living on social subsidies would have certainly enriched our analysis, although it is exceptionally hard to obtain such high-resolution data for Germany (Lengyel, Citation2021). Finally, since methods for data collection and processing differ between the two datasets, we may have introduced some level of inaccuracy to our calculations that could have been avoided with more consistent datasets.
Notwithstanding, our results demonstrate that structural inequalities stemming from the processes of industrialization and deindustrialization in the Ruhr metropolitan region (Ruhrgebiet) are still widely persistent and result in characteristic patterns along the three major rivers: the Lippe, Emscher and the Ruhr. For example, areas that are still facing a multiplicity of socioeconomic challenges today concentrate in the mid-reaches of the Emscher river. Moreover, the three types of societal segregation patterns and their distributions over the Ruhr area (ethnic background, age group, economic performance) became conspicuous on our maps. Our global and local findings combined indicate that new and more diverse lifestyles and living circumstances are shrivelling traditional social patterns (Lyberaki et al., Citation2013), posing new demands and challenges on the whole Ruhrgebiet region. As indicated, we expect that in the future, the share of working-age population will both decrease and grow older by a significant amount. Such shortage of labour force, which is already widely apparent, may worsen considerably whilst this particularly applies to highly qualified resources (Butzin et al., Citation2009) as well as to technicians and other skilled workforce. Consequently, the effective integration of young populations with and without migrational background in both education and the labour force is becoming even more pertinent. The effects of demographic change may also have widespread consequences on other urban dimensions. An interlinked loop of population-, job-, purchasing- and tax-loss may lead to difficult-to-solve local and regional problems. Accordingly, the domains of retail and services, labour market, municipal finances and housing, as well as social segregation and urban fragmentation (Butzin et al., Citation2009; Oueslati et al., Citation2015) are all to be carefully assessed and targeted with a variety of mitigation and alleviation measures.
7. Software
To generate the maps in this article, the authors used geospatial python programming, which included the following packages: numpy, pandas, geopandas, matplotlib and seaborn. Furthermore, in order to carry out the self-organizing maps part of the analysis we used the Python package ‘Sompy’ developed by Moosavi et al. (Citation2014) using PCA initialization and a rectangular grid structure. In addition to characterizing urban socioeconomic profiles, the ten here-analysed features (out of a total of 43) were specifically selected after numerous trials, so that their SOM-model would have a topographic error very close to zero (0.072) and a low quantization error (0.7783) according to Sompy-guidelines. Finally, for the layouting and design of our Main map file we used the Adobe InDesign software.
Supplemental Material
Download Zip (38 MB)Acknowledgments
J.L. acknowledges funding from the Mercator foundation within the NEMO Project and would like to thank both the project's team and its strategic partners; the Regional Planning Association Ruhr (RVR) and the Emschergenossenschaft (EGLV) for providing extensive data as well as continuous help and feedback. J.L. is grateful for H.-W. Wehling and J. A. Schmidt for numerous fruitful discussions and for their remarks.
Disclosure statement
No potential conflict of interest was reported by the author(s).
Data availability statement
To support our results and conclusions, we provide data containing the following parameters for each of the 732 neighbourhoods analysed in this article (in format): The x and y coordinates of the centroids (ETRS89 / UTM zone 32N), the SOM cluster-ID (ranging between 0 and 24, see and ) and we also indicate the city to which they belong (out of the total of 53 cities of the Ruhr Area). Moreover, we make the mean values of the ten variables () available for the twenty-five SOM clusters individually (as
). Since the German census of 100 × 100 metre resolution follows data protection guidelines (e.g. the precision of the information is reduced by not providing decimal places (Zensus, Citation2011)), a small error margin is to be expected when averaging for the whole metropolitan level.
Additional information
Funding
Related Research Data
References
- Agarwal, P., & Skupin, A. (2008). Self-organising maps: Applications in geographic information science. John Wiley & Sons.
- Aguado, D., Montoya, T., Borras, L., Seco, A., & Ferrer, J. (2008). Using SOM and PCA for analysing and interpreting data from a P-removal SBR. Engineering Applications of Artificial Intelligence, 21(6), 919–930. https://doi.org/10.1016/j.engappai.2007.08.001
- Berndt, C (2001). Corporate germany between globalization and regional place dependence: Business restructuring in the ruhr area. Springer.
- Birch, K., MacKinnon, D., & Cumbers, A. (2010). Old industrial regions in Europe: A comparative assessment of economic performance. Regional Studies, 44(1), 35–53. https://doi.org/10.1080/00343400802195147
- Butzin, B., Pahs, R., & Prey, G. (2009). Sektorale Wirkungen des Demografischen Wandels. Published Online, http://www.ruhrgebiet-regionalkunde.de. May 3, 2020, http://www.ruhrgebiet-regionalkunde.de/.
- Federal Statistical Office of Germany. (2019, June 27). https://www.destatis.de/DE/Themen/Gesellschaft-Umwelt/Bevoelkerung/Bevoelkerungsvorausberechnung/.
- Kersting, V., Meyer, C., Strohmeier, K. P., & Terpoorten, T. (2009). Die A 40–der Sozialäquator des Ruhrgebiets. In A. Prossek, H. Schneider, B. Wetterau, J. Schumacher, & D. Wiktorin (Eds.), Atlas der Metropole Ruhr: Vielfalt und Wandel des Ruhrgebiets im Kartenbild (pp. 142–145). Emons.
- Kohonen, T. (1990). The self-organizing map. Proceedings of the IEEE, 78(9), 1464–1480. https://doi.org/10.1109/5.58325
- Kourtit, K., Nijkamp, P., & Arribas, D. (2012). Smart cities in perspective – a comparative European study by means of self-organizing maps. Innovation: The European Journal of Social Science Research, 25(2), 229–246. https://doi.org/10.1080/13511610.2012.660330
- Landesdatenbank NRW. (2019). https://www.landesdatenbank.nrw.de.
- Lengyel, J. (2021). Multiscale urban analysis and modeling: Trends in the Ruhr area, Germany [Dissertation]. Universität Duisburg-Essen.
- Lengyel, J., & Friedrich, J. (2019). Multiscale urban modeling: A de-urbanization scenario in the Ruhr area. In Neue dimensionen der mobilität: Technische und betriebswirtschaftliche Aspekte (pp. 387–408). Springer-Verlag.
- Lyberaki, A., Tinios, P., Mimis, A., & Georgiadis, T. (2013). Mapping population aging in Europe: How are similar needs in different countries met by different family structures? Journal of Maps, 9(1), 4–9. https://doi.org/10.1080/17445647.2012.752334
- Microdialog. (2017, September 4). https://www.deutschepost.de/en/d/deutsche-post-direkt/microdialog.html.
- Moosavi, V., Packmann, S., & Vallés, I. (2014). Sompy: A python library for self organizing map (som). GitHub. [Online]. https://github.com/sevamoo/SOMPY.
- Netrdová, P., & Nosek, V. (2016). Spatial patterns of unemployment in central Europe: Emerging development axes beyond the blue Banana. Journal of Maps, 12(4), 701–706. https://doi.org/10.1080/17445647.2015.1063467
- Oueslati, W., Alvanides, S., & Garrod, G. (2015). Determinants of urban sprawl in European cities. Urban Studies, 52(9), 1594–1614. https://doi.org/10.1177/0042098015577773
- Regionalkunde Ruhrgebiet. (2019). http://www.ruhrgebiet-regionalkunde.de/.
- Regionalstatistik Ruhr. (2019, July 23). https://www.rvr.ruhr/daten-digitales/regionalstatistik/.
- Rehfeld, D., & Nordhause-Janz, J. (2017). Integration–fragmentation–reintegration? Studying cluster evolution, regional path development and cluster policies in the Ruhr Area. In The life cycle of clusters. Edward Elgar Publishing.
- Rienow, A., Stenger, D., & Menz, G. (2014). Sprawling cities and shrinking regions – forecasting urban growth in the Ruhr for 2025 by coupling cells and agents. Erdkunde, 68(2), 85–107. https://doi.org/10.3112/erdkunde.2014.02.02
- Schumacher, J. (2009). Atlas der metropole ruhr: Vielfalt und wandel des ruhrgebiets im kartenbild. Emons.
- Strohmeier, K. P. (2003). Bevölkerungsrückgang, segregation und die transformation sozialräumlicher milieus im ruhrgebiet. Moving the Social, 30, 111–122. https://doi.org/10.13154/mts.30.2003.111-122
- Unglert, K., Radić, V., & Jellinek, A. M. (2016). Principal component analysis vs. self-organizing maps combined with hierarchical clustering for pattern recognition in volcano seismic spectra. Journal of Volcanology and Geothermal Research, 320(15 June), 58–74. https://doi.org/10.1016/j.jvolgeores.2016.04.014
- Urban Atlas. (2019). https://land.copernicus.eu/local/urban-atlas.
- Wehling, H. W. (2014). Organized and disorganized complexities and socio-economic implications in the Northern Ruhr Area. In Understanding complex urban systems: Multidisciplinary approaches to modeling (pp. 87–101). Springer.
- Wehling, H. W. (2015). Zollverein und die industrielle Kulturlandschaft Ruhrgebiet. Auftrag der Stiftung Industriedenkmalpflege und Geschichtskultur erweiterte Fassung.
- Wittowsky, D., Hoekveld, J., Welsch, J., & Steier, M. (2020). Residential housing prices: Impact of housing characteristics, accessibility and neighbouring apartments–a case study of dortmund, Germany. Urban, Planning and Transport Research, 8(1), 44–70. https://doi.org/10.1080/21650020.2019.1704429
- Zensus. (2011). July 23, 2021. https://www.zensus2011.de.