
ABSTRACT
We present a 1:200,000 scale map of the Ar-Hötöl surface rupture along the Khovd fault (Mongolian Altay), presumed to be the expression of the 1761 CE Mw ∼ 7.8 Great Mongol earthquake. The detailed mapping combines airborne and terrestrial imaging and topographic techniques (Sentinel-2, Pleiades, TanDEM-X, UAV and TLS) to quantify right-lateral and vertical offsets ranging from ∼ 1 m to ∼ 4 km over a length of 238 km. The smaller offsets document the deformation associated with the last surface-rupturing earthquake that affects several Bronze to Iron Age burial mounds. Their analysis yields a robust segmentation model comprising 6 segments of 20 to 51 km in length, a maximum co-seismic slip value of 4.8 m ± 0.5 m located near the center of the rupture. Our observations precise the varying kinematics along strike, bring new evidence of repeated faulting and confirm a Mw of 7.8 ± 0.3.
KEYWORDS:
1. Introduction
We present a 1:200,000 scale map of the Ar-Hötöl surface rupture along the Khovd fault in the Mongolian Altay. This map covers an area of ∼900 km² with elevations ranging from ∼1120 m (Khar Us Nuur Lake) to 4204 m (Mönkh Khaikhan Mountain) and encompasses the main faults of the Altay Range. This work documents evidence and style of active deformation along the central section of the N140°-trending Khovd fault (between latitudes 46°30’ and 48°25’), with special emphasis on the most recent earthquake surface rupture. It has implications for tectonics (e.g. influence of structural heritage on the localization of present seismicity), regional geodynamics (e.g. deformation regime and distribution) and seismic hazard to the developing Khovd city.
The fundamental geology of the Altay is composed of three basic terranes that correspond to an accretionary wedge, backarc and forearc basins and an island arc that have amalgamated during the Paleozoic (CitationBadarch et al., 2002; CitationBerkey & Morris, 1927; CitationCunningham, 1998; CitationCunningham et al., 1996) and are bounded by major shear zones (). There is little evidence of regional deformation during the Mesozoic, which is considered tectonically calm as suggested by the development of a regional erosion surface at the top of red argillaceous sandstones from the Oligocene (CitationBaljinnyam et al., 1993; CitationDevyatkin, 1974, Citation1975; CitationDevyatkin & Shuvalov, 1980; CitationKozhevnikov et al., 1970; CitationTikhonov, 1974). The onset of Neogene coarser sediments (conglomeratic molasses) along the margins of the range and within intramontaineous basins indicates renewed regional uplift-driven erosion likely started at the end of the Oligocene or the beginning of the Miocene (CitationDevyatkin, 1974, Citation1975). This deformation episode continues today as attested by Oligocene-Holocene sedimentary records exposed within the eastern basins (CitationHoward, 2004) and early Pliocene deposits in the Ikh Nuuryn Khotgor basin (CitationBaljinnyam et al., 1993; CitationDevyatkin, 1975; CitationDevyatkin et al., 1980). This late Cenozoic reactivation of the Altay Range has been interpreted as a distant effect of the India-Eurasia collision (CitationMolnar & Tapponnier, 1975; CitationTapponnier & Molnar, 1979).
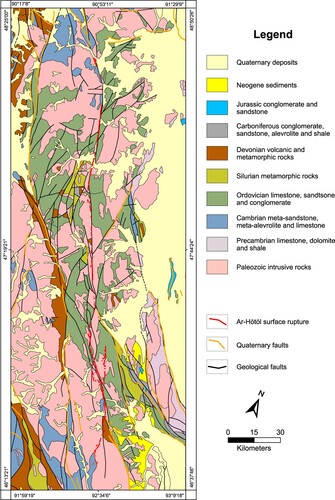
Figure 1. Simplified geological map of the Ar-Hötöl section of the Khovd fault and neighboring area modified from the Geological Map of Mongolia at a scale of 1:500000 (CitationTomurtogoo et al., 1998). Quaternary faults are from CitationByamba (2009). The Ar-Hötöl surface rupture is from this study. See main text for description.
Presently, the Altay Range is a major transpressive system that accommodates ∼4 mm/yr of right-lateral displacement with minor uplift along a system of ∼N140-oriented faults distributed over its width of 150–300 km after GPS measurements (CitationCalais et al., 2003). From west to east, the Fu-Yun fault, the Tolbo Nuur fault, the Ölgiy fault, the Khovd fault and the Khar Uus Nuur fault constitute the main structures and potential sources of destructive earthquakes (e.g. CitationBaljinnyam et al., 1993; CitationFrankel et al., 2010; CitationGregory et al., 2014; CitationKhilko et al., 1985; CitationWalker et al., 2006). Seismicity in Central and Western Mongolia is dominated by rare and powerful earthquakes as illustrated by the extensively studied twentieth century sequence: 1905 (Mw 8.1 Tsetserleg and Mw 8.4 Bulnay), 1931 (Mw 8.0 Fu-Yun), 1957 (Mw 8.1 Bogd) and 1967 (Mw 7.6 Mogod). Paleoseismological investigations – where available – suggest such events have an average recurrence period of ∼3500 yr (CitationPrentice et al., 2002; CitationRizza et al., 2011, Citation2015).
Historical records in the Altay are scarce, incomplete and rarely accessible. The oldest documented event is the Great Mongol Earthquake of 1761 CE that strongly affected Russian military outposts and townships in regions that now belong to southern Siberia and Kazakhstan (CitationMushketov & Orlov, 1893). Detailed descriptions pertaining to shaking intensity and duration were analyzed by CitationZhalkovsky (1982) who concluded that a major earthquake occurred on 9 December 1761 within the Altay region sensu largo. CitationKhilko et al. (1985) augmented this analysis with unpublished folk tales collected from nomad elders and concluded that the epicenter was located along the Khovd fault and the associated magnitude likely reached Mw 8.
First field observations along the fault (CitationKhilko et al., 1985; CitationTrifonov, 1983) revealed numerous surface breaks displacing streams and ancient graves with various amounts. A few tape measurements (∼5) yielded a maximum 4.5 m right-lateral offset affecting a Turkic grave at the Ar-Hötöl pass (CitationKhilko et al., 1985). CitationBaljinnyam et al. (1993) built on this effort and some data points, among which a ‘7 m’ measurement north of Buyant Gol, near the northern termination of the rupture. Overall, little is known about the late Quaternary activity of the Khovd fault, especially compared to similarly large structures exhibiting historical surface ruptures in the region. Hence, the characterization of the Khovd fault requires a new effort with a dense reliable dataset that shall help better assess its rupture behavior and extent as well as its potential magnitude. In the following, we present systematic detailed mapping and quantification of the recent deformation along the Ar-Hötöl surface rupture using robust high-resolution approaches.
2. Data and methods
The deformation pattern along any surface rupture is generally complex and exhibits variations in amplitude and kinematics associated with changes in strike, complexity, surface rheology and local stress field. For instance, strike-slip faults often display local transpressive and/or transtensive features as well as apparent vertical offsets caused by the interplay between the slip vector and the local slope. In this study, we use two main types of datasets to quantify deformation: Digital Elevation Models (DEM) to extract topographic profiles and measure vertical components, and orthorectified optical images to measure horizontal components. Depending on the observation scale, we use public datasets or produce our own from airborne data and field measurements.
To build a regional picture of the fault and characterize a wide deformation zone associated to long-term processes (geology, geomorphology and drainage network), we rely on medium resolution datasets to produce a continuous custom basemap: Sentinel-2 (10 m resolution) and TanDEM-X DEM (12 m resolution). The Sentinel-2 image is a mosaic acquired on 14 August 2019 by Sentinel-2B with minimal cloud cover (<0.5%). L1C (Top-Of-Atmosphere reflectance) images were processed with Sen2Cor 2.8 within the ESA SNAP software to produce L2A (Bottom-Of-Atmosphere reflectance) images and merged into a seamless mosaic. In order to produce an image that reflects lithology rather than vegetation, we use the 12/8/2 band combination (SWIR/NIR/Blue) that best renders mineralogical variations (e.g. CitationAdiri et al., 2020; CitationGe et al., 2018). We obtain a visually convincing correlation between mapped lithologies () and reflectance in the chosen bands. Pinkish to purple hues outline high band-12 reflectance typical of high quartz content and are associated with granites (Paleozoic intrusive rocks in ). Green hues accurately define limestones (mostly Ordovician and some Precambrian) as illustrated north of Mönkh Khaikhan in the Main Map. Intermediate yellowish green hues point out the thin layers of Cambrian metasandstone (see the massif immediately SW of Khar Us Nuur Lake in the Main Map). Finally, yellow hues generally correspond to unconsolidated Quaternary colluvium and alluvium that cover the margins of the range.
In parallel, we produced a region-wide consistent geomorphological representation based on TanDEM-X DEM data provided at 12 m resolution. Considering the average strike of the fault is ∼ N140 and most drainages flow perpendicularly (i.e. with a ∼ N050 direction), we computed a hillshade image with a lighting source at N045 and an elevation of 55°. This setting adequately illuminates fault scarps as well as major drainage thalwegs. We fine-tuned lighting to avoid deep cast shadows and burnt-out areas by reducing shadow darkness (100 in Global Mapper) and removing highlights from direct light (set to 0 in Global Mapper). To compensate for the overall ‘washed-out’ aspect, we increased the vertical exaggeration to 4.8. We obtain the final basemap used for the Main Map by draping the Sentinel-2 mosaic over the DEM hillshade using an overlay approach. The resulting image combines the colors pertaining to surface composition (mostly lithology, vegetation and water content) and geomorphology (slope, aspect and slope gradient).
To quantify small deformation associated with co-seismic slip or short-term cumulative slip, i.e. a few meters to a few tens of meters, we produced Digital Surface Models from satellite photogrammetry using Pleiades triplets (e.g. CitationFerry et al., 2014; CitationRupnik et al., 2018). We acquired a set of tri-stereo panchromatic images at 0.5 m resolution that encompasses the whole suspected rupture and used specialist software (Erdas Imagine Photogrammetry 2014) to derive 1-m-resolution DSM and 0.5-m-resolution panchromatic orthoimages. These serve as basic datasets to identify and map small scale features such as gullies, stream risers and terraces and quantify offsets affecting them. Some of the most striking examples are illustrated on the Main Map (see insets B and C and and (B)). Where deformation was particularly complex or subtle we carried out UAV surveys and produced DSM and orthophotos at cm-scale resolution (see examples in Main Map insets D and E). Finally, very small objects with steep slopes requiring true 3D acquisition (e.g. ancient graves, deeply incised gullies) were surveyed with a terrestrial laser scanner at cm-scale resolution (see Main Map inset A). We applied a standard approach to measure offsets and related uncertainties following recent studies carried out along the Bulnay and Bogd faults (CitationChoi et al., 2018; CitationKurtz et al., 2018). This approach takes into account the orientation, geometry and smoothness of features and fault traces to infer uncertainties as well as a confidence index.
Figure 2. Fault zone complexity at the Ulaan Bulagt Mountain relay zone. (a) Pleiades panchromatic orthoimage. (b) Surface rupture map (red lines) along with documented offset markers (yellow dots). Circled numbers (3, 4 and 5) and letter (D) point to field pictures and a very high-resolution DEM visible in the Main Map. See Main Map for location.
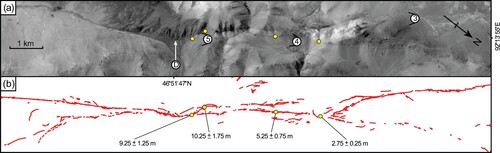
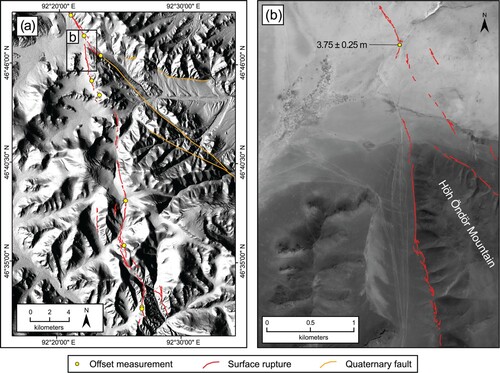
Figure 3. Fault junction at Höh Öndör Mountain. (a) TanDEM-X shaded relief with resolution of 12 m. The red lines show the southernmost termination of the Ar-Hötöl surface rupture as it reaches Höh Öndör Mountain and runs along the west flank of the mountain. The eastern splay dies out a few kilometers SE of the junction. The orange lines represent Quaternary faults. The yellow dots are documented offsets. (b) Close-up of the junction on Pleiades images with 0.5 m of resolution showing the complexity and distribution of the deformation. See Main Map for location.
In this work, we do not provide quantified age determinations for the various offset features. However, rough estimates may be inferred from similar landforms observed elsewhere in Mongolia that have been dated to late Quaternary (e.g. CitationRitz et al., 1995; CitationVassallo et al., 2005). Furthermore, glacial and peri-glacial landforms combined with paleoclimate reconstructions (see CitationLehmkuhl et al., 2011 for an up-to-date review) suggest most of the Altay Range has been covered by glaciers during the Late Pleistocene. The southernmost section of the mapped Khovd fault (south of ∼ 47°30’) would have even been covered with ice at the Last Glacial Maximum. This implies that small-scale landforms expressed within unconsolidated sediments would have likely been eroded by ice.
3. Results
3.1. Identification of faulting and quantification of deformation
Within the limits of our map, the northernmost expression of the Khovd fault bounds the SW flank of the Tsambagarav Massif (Main Map) interpreted as a restraining bend by CitationCunningham (2005). Such features observed elsewhere are likely to act as major barriers to earthquake rupture propagation (CitationWesnousky, 2008). There, the fault trace is sealed by superficial unconsolidated slope deposits, which suggests the last surface rupture is relatively ancient. Immediately south of the Khongo River at a site called Yellow Lake, interrupted markers are suggestive of deformation and let us measure four different offsets. Previous studies (CitationBaljinnyam et al., 1993; CitationKhilko et al., 1985) did not report observations of deformation visible in the field there, which can be explained by the fact that the surface rupture veers to the W by ∼20° with respect to its local average strike to follow the piedmont of the range. To the south, the Shurag River displays a right-lateral deflection of ∼3 km. Considering the drainage is strongly controlled by the edge of a massif downstream of the fault, we interpret this value as an upper bound for the true cumulative displacement. Southward, the fault’s orientation changes relatively gradually from N135 to N155 then N165 at the Shiver River. Along this section, the surface rupture follows the contact between Late Devonian intrusive, Late-Cambrian-to-Early Ordovician metamorphic and Early-Middle Ordovician rocks.
Between the Burgast and Buyant rivers, we document numerous well-expressed offsets affecting gullies, stream risers and mounds. Furthermore, widespread accumulation of stream sediments against the fault suggests ponding promoted by uplift of the eastern bloc. A few kilometers south of the Buyant River, we identify a 60-m-wide and 270-m-long sag pond that forms a local depression, which diverts upstream drainages into a sediment trap. There, the rupture roughly follows the boundary between Paleozoic intrusive rocks and Late-Ordovician deposits (limestone and marine formations). About 10 km south of that sag pond, the Shiver River displays a clear ∼4 km deflection. Considering the stream trajectory is well constrained by its deeply incised valley, we interpret this deflection as a cumulative offset.
A few kilometers south of the Shiver River the fault changes strike from ∼N165 to ∼N150 and forms a 1-km-wide 5-km-long relay zone that we identify as a potential barrier to rupture propagation. Afterwards, the fault follows a straight trace and reaches the Ar-Hötöl Pass where it affects several man-made rock mounds. The mounds are made of blocks of local pink granite, circular in shape and composed of a central mound ∼10 m in diameter within an ∼20-m-diameter enclosure. These constructions are typical khirigsuurs (burial mounds) found throughout Central Asia and dated Late Bronze to Early Iron Age (3200-2300 BP) in the Mongolian Altay (CitationAllard & Erdenebaatar, 2005; CitationWright, 2007). Two such khirigsuurs were documented by earlier researchers (CitationBaljinnyam et al., 1993; CitationKhilko et al., 1985) who proposed right-lateral offsets reaching 5.5 ± 1 m and ∼3 m. We re-measured these points using Pleiades satellite images and a terrestrial laser scanner and found slightly lower values of 4.5 ± 0.5 and 2.5 ± 0.3 m, respectively (see insert A in Main Map). The vast majority of large offset values observed along the Ar-Hötöl rupture are located within a few 10s of kilometers of the Ar-Hötöl Pass (CitationBaljinnyam et al., 1993; CitationKhilko et al., 1985 and this study). On the southern side of the pass, the Tsagaan Burgast River displays a very sharp right-lateral deflection of ∼2.7 km that is probably mostly due to cumulative displacement along the Khovd fault.
Between the Khoid Tsenkher and Dund Tsenkher rivers, the fault splits into two branches. The northern branch follows the piedmont of the Altay Range formed by the contact between Ordivician limestones (north) and a Paleozoic intrusion (south) (). This section exhibits little deformation affecting Quaternary landforms as illustrated by the relatively small cumulative offsets affecting the valleys of the Dund Tsenkher and Urd Tsenkher rivers and is considered to correspond to the geological Khovd Fault (Main Map). The western branch follows the southern edge of the Paleozoic intrusion, delimits the northern tip of the Goo Mountain and exhibits recent deformation considered part of the Ar-Hötöl rupture (CitationBaljinnyam et al., 1993; CitationKhilko et al., 1985 and this study). At this junction, the fault trace changes direction abruptly from ∼N150 to ∼N165 over ∼18 km then veers back progressively to ∼N150 over ∼25 km until it reaches the southern tip of the Goo Mountain. This local elongated feature (∼50 × 10 km) is interpreted as a thrust fault-bounded pop-up structure by CitationCunningham (2005) and is likely to influence the expression of the rupture (in terms of kinematics, amplitude and geometry). Our measurements show relatively lower horizontal offsets and significant vertical displacements along that section, which confirms the locally changing kinematics. South of Urd Tsenkher, the fault displaces a local stream as well as a khirigsuur (point B and corresponding insert in Main Map). The poorly preserved geometry of the latter does not allow any reconstruction and offset estimation. However, a recent terrace riser within the stream exhibits a clear right-lateral offset of 2.5 ± 0.5 m. Nearby, the Lunch Creek stream is affected by a well-expressed moletrack line and exhibits a cumulative offset of 13.8 ± 1.5 m (point C and corresponding insert in Main Map). There, numerous shallow rills are similarly right-laterally offset by as little as ∼1 m and vertically by up to 1.5 m with the NE side up.
Along the SE flank of the Goo Mountain, subtle deformation visible in Pleiades images was confirmed by field observations and suggests a short section produced slip recently. Strikingly, this section does not follow any clear geological contact and rather cuts through Ordovician and Paleozoic units (). At the southern tip of the massif, both branches merge into a linear trace (point 4 in Main Map) over ∼6 km before splitting again. This section is geometrically complex with widely distributed deformation illustrated by the two parallel strands visible in Pleiades images () and in the field (points 3, 4, 5 and corresponding photographs in Main Map). We documented relay zones at various scales, among which the Ulaan Bulagt pull-apart structure where the two main strands connect (point D and corresponding insert in Main Map and ). Hence, we collected four offset measurements ranging from 2.75 ± 0.25 m to 10.25 ± 1.75 m that may only reflect partial horizontal slip estimates.
As the rupture reaches the Höh Öndör Mountain, it propagates along both flanks of the massif (south of point 7 in Main Map and ). Along the northern flank, field observations revealed fresh-looking cracks over a few kilometers only while the geological fault runs along the contact between Devonian formations and Paleozoic intrusive rocks then Ordovician limestone over at least 50 km along a N150 direction (Main Map, and (a)). Along the southern flank of the massif, the rupture is well expressed and follows the contact between Devonian and Paleozoic formations along a N170 – N180 direction. There, it exhibits spectacular morphology with exceptionally large en-echelon tension gashes (up to 20 m in length, 5 m in width and more than 3 m in depth) affecting thick alluvium (point E and corresponding insert in Main Map). These features reflect locally transtensional kinematics consistent with a significant change of strike along a right-lateral strike-slip fault. Further south, similarly large tension gashes were observed at Baga Ulaan Davaa. Along strike, fresh-looking deformation features die out a few kilometers to the south. The southernmost expression of recent surface rupture was found at the Broken Boulder site (point 9 and corresponding field picture in Main Map). There, the fault makes a step to the left (going southward) and forms a 3-km-long linear counter-slope scarp that affects a well-defined boulder field interpreted as a remnant of a rock glacier. A simple correlation to the extent of glaciers publised by CitationLehmkuhl et al. (2011) suggests this rock glacier is of late Pleistocene age, possibly from the Last Glacial Maximum. Considering that (i) the scarp is well expressed but does not look as pristine as the rest of our observations and (ii) the step-over is wide enough (∼2 km, see CitationWesnousky, 2006) to act as a barrier to the propagation of the rupture, we cannot conclude positively that deformation at the Broken Boulder site is part of the Ar-Khötöl rupture. This, however, does not affect the overall length of the rupture.
3.2. Segmentation
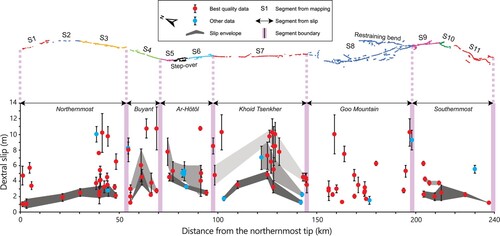
Co-seismic slip distribution and associated segmentation have long been recognized as robust criteria to assess fault maturity and rupture behavior (see CitationBurbank & Anderson, 2001 for a review). Using a combined approach based on remote sensing at cm to 10-m scales supplemented with detailed field observations, we mapped the most recent expression of surface deformation along the Khovd fault over a length of 238.5 ± 0.5 km (Main Map). The surface rupture exhibits various changes in strike, faulting style and complexity generally associated with relay zones that may play a role in the propagation of the rupture (e.g. CitationChoi et al., 2018; CitationHarris & Day, 1993; CitationOglesby, 2005; CitationWesnousky, 2008). On that basis, we propose a structural segmentation model that separates the fault into 11 segments (S1 to S11 in ) displaying homogeneous characteristics. The central segments S7 and S8 reach lengths of ∼50 km while the remaining segments reach lengths ranging from 7 km (S5) to 23 km (S3). In parallel, we represent all slip measurements smaller than 10 m (central value, excluding uncertainties) as this threshold would most certainly encompass all values associated with the last major surface-rupturing earthquake. Considering the lowest values encountered along strike should reflect the most recent co-seismic slip, we derive the co-seismic slip distribution as well as two cumulative curves (). The co-seismic slip curve displays a series of slip envelopes consistent with individual segments and suggests a broader model with only 6 well-defined segments. It should be noted that the boundaries of the segments determined from the slip envelopes correspond to boundaries of segments determined by mapping. The Northernmost segment (S1 + S2 + S3), the Khoid Tsenkher segment (S7), the Goo Mountain segment (S8) and the Southernmost segment (S9 + S10 + S11) reach lengths ranging from 45 km to 51 km. The Buyant segment (S4) and Ar-Hötöl segment (S5 + S6) only reach 20 and 23 km, respectively. This configuration indicates that only some structural features influence the distribution of slip at the surface. Finally, the central segment (Khoid Tsenkher) displays the largest co-seismic slip value (4.8 ± 0.5 m) as well as two well-defined cumulative curves that mimic the co-seismic distribution thus suggesting previous events were recorded at the same sites.
Figure 4. Segmentation from surface rupture map and dextral slip distribution of the Ar-Hötöl surface rupture. The color surface rupture map is divided into 11 segments (S1 to S11) based on changes in strike, deformation distribution and geometric complexity (see text for details). A second segmentation model (double-headed black arrows) comprises 6 segments and is based on our analysis of the slip distribution (lower panel). There, we retain slip values lower than 10 m of medium and high quality (red dots) and low quality (blue dots). We connect the lower individual values to build a slip envelope for the most recent event (dark grey) as well as cumulative slip envelopes that include the penultimate event (medium grey) and the antepenultimate event (light grey).
4. Discussions and conclusions
Our remote sensing and field observations yield a total surface rupture length (SRL) of 238.5 ± 0.5 km for the most recent surface expression of the Khovd fault. Considering general scaling relationships established by CitationWells and Coppersmith (1994) for strike-slip faults (with a = 5.16 ± 0.13 and b = 1.12 ± 0.08), we may derive a moment magnitude of 7.8 ± 0.3. In parallel, the maximum last coseismic displacement (MD) identified at the center of the slip distribution reaches 4.8 ± 0.5 m. The associated scaling relationship (with a = 6.81 ± 0.05 and b = 0.78 ± 0.06) yields a moment magnitude of 7.3 ± 0.1. Previous works mention a higher value of maximum displacement reaching 7 m (CitationBaljinnyam et al., 1993) on the northern bank of the Buyant River. This is documented about 20 km from the northernmost end of the surface rupture (Figure 13 in CitationBaljinnyam et al., 1993) at a location where we found only a few markers that registered much lower coseismic slip (∼2 m). Authors also mention some uncertainty in the interpretation of the offset. Since our findings are more consistent with the local slip envelope () and with the low values usually associated with rupture tips, we consider the original value likely cumulative and discard it from our analysis.
Overall, our field observations document relatively ‘fresh-looking’ features with steep scarps and apparently recent post-seismic deposits, which could point to a recent event such as the AD 1761 earthquake (CitationMushketov & Orlov, 1893). However, in light of the very low erosion and deposition rates at work in Mongolia, this could be a very misleading inference (see CitationWalker et al., 2017 for a striking example on the Egiin Davaa Fault). A comprehensive paleoseismological study of the rupture would bring much needed constraint on the recent activity of the Khovd Fault.
The apparent discrepancy between the moment magnitudes derived from SRL and MD is in fact a general observation documented by CitationWells and Coppersmith (1994, Figure 12) who report MD ranging from ∼3 m to ∼10 m for a given SRL of 240 km. Since the SRL reflects the whole rupture while MD may be influenced by local conditions, we rely on the associated estimate of Mw 7.8 ± 0.3 to characterize the most recent surface-rupturing earthquake on the central section of the Khovd fault.
Overall, we combine remote sensing and field data at various scales to produce a detailed map of the 238-km-long Ar-Hötöl rupture along the Khovd fault in the Mongolian Altay. High resolution orthorectified images and DEMs led to the robust quantification of co-seismic and cumulative slip and the identification of six main segments organized around major changes in strike, kinematics and lithology. We collected more than 100 offset values, 67 of which co-seismic to confirm the original magnitude estimate of Mw ∼ 7.8. This work will serve as base data to carry out paleoseismic studies along the fault and help characterize it for geodynamics and seismic hazard.
Software
Processing of Sentinel-2 images was performed within ESA’s SNAP software (available at http://step.esa.int/main/download/snap-download/) using the Sen2Cor plugin (available at http://step.esa.int/main/snap-supported-plugins/sen2cor/sen2cor_v2-8/). The basemap was produced by draping the Sentinel-2 mosaic over the TanDEM-X DEM using Global Mapper v18. Photogrammetric DSM were calculated from tri-stereo Pleiades images with Erdas Imagine Photogrammetry 2014. UAV photogrammetry was performed with Agisoft Metashape Pro v1.7 (https://www.agisoft.com/features/professional-edition/) and laserscanner data were processed with Faro Scene (https://www.faro.com/en/Products/Software/SCENE-Software) and CloudCompare (https://www.cloudcompare.org/). All remote sensing measurements were performed within ArcGIS (https://desktop.arcgis.com/), which was subsequently used to prepare maps before final editing in Adobe Illustrator (https://www.adobe.com/products/illustrator.html).
Supplemental Material
Download Zip (58.1 MB)Acknowledgements
Equipex GEOSUD (https://ids.equipex-geosud.fr/) granted early access to tasking for Pleiades data. Pleiades data are provided by CNES. Authors also greatly benefited from Copernicus Sentinel-2 data provided by ESA (European Space Agency) and TanDEM-X data provided by DLR (Deutsches Zentrum für Luft- und Raumfahrt, proposal DEM_GEOL1629). Authors wish to thank the many Mongol colleagues from the Institute of Astronomy and Geophysics (Mongolian Academy of Sciences) who directly participated in, or facilitated, fieldwork, especially at the Khovd and Olgii seismological stations. Authors also wish to acknowledge the careful review of Jorien van der Wal, Chris Orton and Ochirbat Batkhishig that significantly improved the quality of the manuscript.
Data availability statement
The original dataset containing the detailed map in vector format as well as a table of offset data are available on the Zenodo platform (CitationDavaasambuu et al., 2022).
Disclosure statement
No potential conflict of interest was reported by the author(s).
Additional information
Funding
References
- Adiri, Z., Lhissou, R., El Harti, A., Jellouli, A., & Chakouri, M. (2020). Recent advances in the use of public domain satellite imagery for mineral exploration: A review of Landsat-8 and Sentinel-2 applications. Ore Geology Reviews, 117, 103332. https://doi.org/10.1016/j.oregeorev.2020.103332
- Allard, F., & Erdenebaatar, D. (2005). Khirigsuurs, ritual and mobility in the Bronze age of Mongolia. Antiquity, 79(305), 547–563. https://doi.org/10.1017/S0003598X00114498
- Badarch, G., Cunningham, D. W., & Windley, B. F. (2002). A new terrane subdivision for Mongolia: Implications for the Phanerozoic crustal growth of Central Asia. Journal of Asian Earth Sciences, 21(1), 87–110. https://doi.org/10.1016/S1367-9120(02)00017-2
- Baljinnyam, I., Bayasgalan, A., Borisov, B. A., Cisternas, A., Dem’yanovich, M. G., Ganbaatar, L., & Vashchilov, Y. (1993). Ruptures of major earthquakes and active deformation in Mongolia and its surroundings (Vol. 181). Geological Society of America.
- Berkey, C. P., & Morris, F. K. (1927). Geology of Mongolia. American Museum of Natural History.
- Burbank, D. W., & Anderson, R. S. (2001). Tectonic geomorphology. Blackwell Science.
- Byamba, J. (2009). Late paleozoic to early mesozoic structures. In J. Byamba (Ed.), Geology and mineral resources of the Mongolia: Lithospheric plate tectonics (in Mongolian) (pp. 353–358). Soyombo Printing.
- Calais, E., Vergnolle, M., San’kov, V., Lukhnev, A., Miroshnitchenko, A., Amarjargal, S., & Déverchère, J. (2003). GPS measurements of crustal deformation in the Baikal-Mongolia area (1994–2002): Implications for current kinematics of Asia. Journal of Geophysical Research: Solid Earth, 108(B10), 2501. https://doi.org/10.1029/2002JB002373
- Choi, J.-H., Klinger, Y., Ferry, M., Ritz, J.-F., Kurtz, R., Rizza, M., & Demberel, S. (2018). Geologic inheritance and earthquake rupture processes: The 1905 M ≥ 8 Tsetserleg-Bulnay strike-slip earthquake sequence, Mongolia. Journal of Geophysical Research: Solid Earth, 123(2), 1925–1953. https://doi.org/10.1002/2017JB013962
- Cunningham, W. D. (1998). Lithospheric controls on late Cenozoic construction of the Mongolian Altai. Tectonics, 17(6), 891–902. https://doi.org/10.1029/1998TC900001
- Cunningham, W. D. (2005). Active intracontinental transpressional mountain building in the Mongolian Altai: Defining a new class of orogen. Earth and Planetary Science Letters, 240(2), 436–444. https://doi.org/10.1016/j.epsl.2005.09.013
- Cunningham, W. D., Windley, B. F., Dorjnamjaa, D., Badamgarov, G., & Saandar, M. (1996). A structural transect across the Mongolian Western Altai: Active transpressional mountain building in central Asia. Tectonics, 15(1), https://doi.org/10.1029/95tc02354
- Davaasambuu, B., Ferry, M., Ritz, J.-F., & Munkhuu, U. (2022). Map and offsets of the Ar-Hötöl surface rupture along the Khovd fault (Mongolian Altay) [Data Set]: Zenodo. https://doi.org/10.5281/zenodo.6089738.
- Devyatkin, E. V. (1974). Structures and formational complexes of the Cenozoic activated stage (in Russian). Tectonics of the Mongolian People’s Republic, 41, 182–195.
- Devyatkin, E. V. (1975). Neotectonic structures of western Mongolia (in Russian). Mesozoic and Cenozoic Tectonics and Magmatism of Mongolia, 11, 264–282.
- Devyatkin, E. V., & Shuvalov, V. F. (1980). Continental Mesozoic and Cenozoic of Mongolia (stratigraphy, geochronology, paleogeography) (in Russian). In N. S. Zaitzev & V. I. Kovalenko (Eds.), Evolution of geological processes and metallogenesis of Mongolia (pp. 165–176). Nauka.
- Ferry, M., Le Roux-Mallouf, R., Ritz, J.-F., Berthet, T., Peyret, M., Vernant, P., & Poujol, A. (2014). Tri-stereo Pleiades images-derived digital surface models for tectonic geomorphology studies. EGU General Assembly.
- Frankel, K. L., Wegmann, K. W., Bayasgalan, A., Carson, R. J., Bader, N. E., Adiya, T., & Gregory, L. (2010). Late Pleistocene slip rate of the Höh Serh–Tsagaan Salaa fault system, Mongolian Altai and intracontinental deformation in central Asia. Geophysical Journal International, 183(3), 1134–1150. https://doi.org/10.1111/j.1365-246X.2010.04826.x
- Ge, W., Cheng, Q., Tang, Y., Jing, L., & Gao, C. (2018). Lithological classification using Sentinel-2A data in the Shibanjing Ophiolite complex in Inner Mongolia, China. Remote Sensing, 10(4), 638. https://doi.org/10.3390/rs10040638
- Gregory, L. C., Thomas, A. L., Walker, R. T., Garland, R., Mac Niocaill, C., Fenton, C. R., & West, A. J. (2014). Combined uranium series and 10Be cosmogenic exposure dating of surface abandonment: A case study from the Ölgiy strike-slip fault in western Mongolia. Quaternary Geochronology, 24, 27–43. https://doi.org/10.1016/j.quageo.2014.07.005
- Harris, R. A., & Day, S. M. (1993). Dynamics of fault interaction: Parallel strike-slip faults. Journal of Geophysical Research: Solid Earth, 98(B3), 4461–4472. https://doi.org/10.1029/92JB02272
- Howard, J. P. (2004). A multi-disciplined field-based study of sedimentary basin evolution along seismically active transpressional fault systems in the Mongolian Altai (Ph.D., University of Leicester).
- Khilko, S., Kurushin, R., Kotchetkov, V., Misharina, L., Melnikova, V., Gileva, N.A., Lastochkin, S.V., Baljinnyam, I., Monhoo, D. (1985). Strong earthquakes, paleoseismogeological and macroseismic data (in Russian). In Joint Soviet-Mongolian Scientific Research Geological Expedition (Ed.), Earthquakes and the base for Seismic Zoning of Mongolia (pp. 19–83).
- Kozhevnikov, A. V., Savin, V. E., & Uflyand, A. K. (1970). The history of development of the Hangay upland in the Mesozoic and Cenozoic (in Russian). In E. V. Devyatkin (Ed.), Geology of the Mesozoic and Cenozoic of western Mongolia (pp. 151–169). Nauka.
- Kurtz, R., Klinger, Y., Ferry, M., & Ritz, J. F. (2018). Horizontal surface-slip distribution through several seismic cycles: The Eastern Bogd fault, Gobi-Altai, Mongolia. Tectonophysics, 734-735, 167–182. https://doi.org/10.1016/j.tecto.2018.03.011
- Lehmkuhl, F., Klinge, M., & Stauch, G. (2011). Chapter 69 – The extent and timing of Late Pleistocene glaciations in the Altai and neighbouring mountain systems. In J. Ehlers, P. L. Gibbard, & P. D. Hughes (Eds.), Developments in quaternary sciences (pp. 967–979). Elsevier.
- Molnar, P., & Tapponnier, P. (1975). Cenozoic tectonics of Asia: Effects of a continental collision. Science, 189(4201), 419–426. https://doi.org/10.1126/science.189.4201.419
- Mushketov, I. V., & Orlov, A. P. (1893). Katalog zemletryasenii Rossiiskoiimperii (An earthquake catalog of the Russian empire) (Vol. 26). Imper.
- Oglesby, D. D. (2005). The dynamics of strike-slip step-overs with linking dip-slip faults. Bulletin of the Seismological Society of America, 95(5), 1604–1622. https://doi.org/10.1785/0120050058
- Prentice, C. S., Kendrick, K., Berryman, K., Bayasgalan, A., Ritz, J. F., & Spencer, J. Q. (2002). Prehistoric ruptures of the Gurvan Bulag fault, Gobi Altay, Mongolia. Journal of Geophysical Research, 107(B12), 2321. https://doi.org/10.1029/2001jb000803
- Ritz, J. F., Brown, E. T., Bourlès, D. L., Philip, H., Schlupp, A., Raisbeck, G. M., & Enkhtuvshin, B. (1995). Slip rates along active faults estimated with cosmic-ray–exposure dates: Application to the Bogd fault, Gobi-Altaï, Mongolia. Geology, 23(11), 1019–1022. https://doi.org/10.1130/0091-7613
- Rizza, M., Ritz, J.-F., Braucher, R., Vassallo, R., Prentice, C., Mahan, S., & Bourlès, D. (2011). Slip rate and slip magnitudes of past earthquakes along the Bogd left-lateral strike-slip fault (Mongolia). Geophysical Journal International, 186(3), 897–927. https://doi.org/10.1111/j.1365-246X.2011.05075.x
- Rizza, M., Ritz, J. F., Prentice, C., Vassallo, R., Braucher, R., Larroque, C., & Team, A. (2015). Earthquake geology of the Bulnay Fault (Mongolia). Bulletin of the Seismological Society of America, 105(1), 72–93. https://doi.org/10.1785/0120140119
- Rupnik, E., Pierrot-Deseilligny, M., & Delorme, A. (2018). 3D reconstruction from multi-view VHR-satellite images in MicMac. ISPRS Journal of Photogrammetry and Remote Sensing, 139, 201–211. https://doi.org/10.1016/j.isprsjprs.2018.03.016
- Tapponnier, P., & Molnar, P. (1979). Active faulting and Cenozoic tectonics of the Tien Shan, Mongolia, and Baykal regions. Journal of Geophysical Research, 84(B7), 3425–3459. https://doi.org/10.1029/JB084iB07p03425
- Tomurtogoo, O., Takahashi, Y., Nakajima, T., Ichinnorov, N., Oyungerel, S., Minjin, Ch., Bayarmandal, Lh., Teraoka, Y., Kurimoto, Ch., Tungalag, F., Delgertsogt, B., Naito, K. (Cartographer). (1998). Geological map of Mongolia.
- Tikhonov, V. I. (1974). Faults (in Russian). In A. L. Jansin (Ed.), Tectonics of the Mongolian People's Republic (pp. 196–209). Nauka.
- Trifonov, V. G. (1983). Late quaternary tectogenesis. Nauka.
- Vassallo, R., Ritz, J., Braucher, R., & Carretier, S. (2005). Dating faulted alluvial fans with cosmogenic 10Be in the Gurvan Bogd mountain range (Gobi-Altay, Mongolia): climatic and tectonic implications. Terra Nova, 17(3), 278–285.
- Walker, R. T., Bayasgalan, A., Carson, R., Hazlett, R., McCarthy, L., Mischler, J., & Tsolmon, G. (2006). Geomorphology and structure of the Jid right-lateral strike-slip fault in the Mongolian Altay mountains. Journal of Structural Geology, 28(9), 1607–1622. https://doi.org/10.1016/j.jsg.2006.04.007
- Walker, R. T., Wegmann, K. W., Bayasgalan, A., Carson, R. J., Elliott, J., Fox, M., & Wright, E. (2017). The Egiin Davaa prehistoric rupture, central Mongolia: a large magnitude normal faulting earthquake on a reactivated fault with little cumulative slip located in a slowly deforming intraplate setting. Geological Society, London, Special Publications, 432(1), 187–212. https://doi.org/10.1144/sp432.4
- Wells, D. L., & Coppersmith, K. J. (1994). New empirical relationships among magnitude, rupture length, rupture width, rupture area, and surface displacement. Bulletin of the Seismological Society of America, 84(4), 974–1002. https://doi.org/10.1785/BSSA0840040974
- Wesnousky, S. G. (2006). Predicting the endpoints of earthquake ruptures. Nature, 444(7117), 358–360. https://doi.org/10.1038/nature05275
- Wesnousky, S. G. (2008). Displacement and geometrical characteristics of earthquake surface ruptures: Issues and implications for seismic-hazard analysis and the process of earthquake rupture. Bulletin of the Seismological Society of America, 98(4), 1609–1632. https://doi.org/10.1785/0120070111
- Wright, J. (2007). Organizational principles of Khirigsuur monuments in the lower Egiin Gol valley, Mongolia. Journal of Anthropological Archaeology, 26(3), 350–365. https://doi.org/10.1016/j.jaa.2007.04.001
- Zhalkovsky, N. D. (1982). Altai and Sayany. In N. V. Kondorskaya & N. V. Shebalin (Eds.), New catalog of strong earthquakes in the U.S.S.R. from Ancient Times through 1977 (Vol. SE-31). National Oceanic and Atmospheric Administration.