
ABSTRACT
Badlands are specific landforms characterized by intense denudation processes. Their occurrence is mainly associated with clay-like materials and semi-arid and Mediterranean climates. This study presents the badland inventory for the Paleogene Pazin Basin located on the Istrian peninsula in Croatia. A total of 5,381 badland polygons, with a total area of 10.25 km2, were manually outlined, based on the visual interpretation of orthophotos at a scale of 1:5,000. The badlands in Istria are represented as small and isolated landforms and are exclusively associated with flysch and flysch-like materials, which cover a significant part of the study area (46%). The analysis of badland inventory shows that badlands are spatially not equally distributed but that their abundance is increasing from NW to SE part of the analyzed area. Additionally, the results of the spatial analysis indicate the positive relationship between badland occurrence and relative relief, which is presented via the relief-badland index.
1. Introduction
Badlands are impressive natural landforms, formed in softer sedimentary rocks and clay-rich sediment (CitationYang et al., 2019), typically but not exclusively in semi-arid climate zones (CitationGallart et al., 2002; CitationHarvey, 2004). The impermeability of such materials, with consequent generation of high surface runoff, and lack of vegetation lead to extensive fluvial erosion, the result of which is the formation of an extremely dissected landscape (CitationScheidegger et al., 1968). The development of badlands is controlled by numerous factors, among which the four critical can be underlined, as follows: (i) relief vigor, (ii) a rapidly weatherable soft lithology, (iii) a climate with notable rainfall or snow-melt erosive events, and (iv) additional disturbance or restriction of the environment that influences the development of protective vegetation cover (CitationMoreno-de Las Heras & Gallart, 2018). With such characteristics, the badlands have great potential for a whole range of exogenetic processes, including weathering, denudation, and accumulation (CitationGulam et al., 2014).
The dominant process on badland slopes is erosion, which conditions badland origin and sustains its existence (CitationBryan & Yair, 1982). Due to intensive erosion, badlands are characterized by extreme geomorphological dynamics, which enables the measurement of rapid badland relief changes in a relatively short period. This is the main reason why the majority of research topics in badland studies refer to identifying erosion processes and quantifying the erosion rates (CitationMartínez-Murillo & Nadal-Romero, 2018). Recently, the multi-temporal photo-geological analysis was applied to reconstruct the geomorphological evolution using aerial photos, orthophotos, and satellite images (e.g. CitationD’Intino et al., 2020). Moreover, to assess the topographic changes, the comparison of time series digital elevation models obtained with the use of terrestrial laser scanning (e.g. CitationLlena et al., 2020; CitationMarsico et al., 2021; CitationVericat et al., 2014) and unmanned aerial vehicles (e.g. CitationNeugirg et al., 2016; CitationYang et al., 2019) is increasingly applied.
To describe the badland distribution within a particular area and complete different spatial analyses, it is necessary to create a badland inventory map. Identifying and mapping badlands are most commonly performed using remote sensing techniques, by visual interpretation of satellite images, aerial photos, and orthophotos (e.g. CitationAlonso-Sarria et al., 2011; CitationBianchini et al., 2016; CitationCoratza & Parenti, 2021; CitationKhosrowpanah et al., 2010; CitationLiberti et al., 2009; CitationVergari, 2015). Still, all of those techniques are combined with inevitable field surveys.
The badland inventories provide the basic information about badland spatial distribution within a particular area, thus can improve knowledge in various badland research areas which aim to: – locate the most abundant badland areas on a regional scale; – identify different badland types (e.g. CitationBianchini et al., 2016); – analyze the relationship between the current badland extent and different environmental predisposing factors (e.g. elevation, slope, aspect, slope curvature, relief, drainage density, distance to stream, lithology) in order to identify preferable conditions of badland formation and assess the areas susceptible to soil erosion (e.g. CitationLeipe & DeLuca, 2017; CitationVergari, 2015; CitationVijith & Dodge-Wan, 2019); – analyze and measure the changes in badland areas over time, i.e. define their expansion or extinction over the years using time-series badland inventories (e.g. CitationTorri et al., 2018).
In this paper, the badland inventory map is presented for the area of Paleogene Pazin Basin, located in Istria, which is known for the appearance of the vast majority of badlands in Croatia. However, for an area such as Istria, completing the badland inventory is quite a challenging task. While in most areas worldwide known for badlands, where they are dominating over a wide areal extent (e.g. Badlands National Park, South Dakota; North Caineville Plateau, Utah; Bardenas badlands, Spain; Cappadocia, Turkey), in Istria, badland phenomena are typically discontinuously presented as isolated and small landforms (CitationGulam et al., 2014). Exactly because of that, in such an environment their spatial distribution can represent the measure of the intensity of exogenetic processes within Middle Eocene clastic deposits, with which the Istrian badlands are explicitly associated.
The presented badland inventory of Paleogene Pazin Basin is used to analyze badland spatial distribution within delineated watersheds and to represent badland size characteristics. Additionally, the spatial analysis is performed to estimate the relation between badland distribution and relative relief.
2. Study area
Istria is the biggest Croatian peninsula located at the head of the Adriatic Sea, between the Gulf of Trieste and the Kvarner Gulf (). From the geological point of view, according to CitationVelić et al. (1995), three different zones can be distinguished, namely, (i) southern and western Istria presented as Jurassic-Cretaceous-Paleogene carbonate plain, (ii) eastern and north-eastern Istria as Cretaceous-Paleogene carbonate-clastic zone with overthrusting structures (Učka and Ćićarija mountains), and (iii) central Istria known as the Paleogene flysch basin. It dominantly consists of the Dogger-Eocene carbonate rocks with less representation of Paleogene clastic rocks, flysch, and calcareous breccia.
Figure 1. Study area: (a) location map of Istria; (b) simplified geological map of Istria according to CitationVelić et al. (1995), with delineated watersheds.
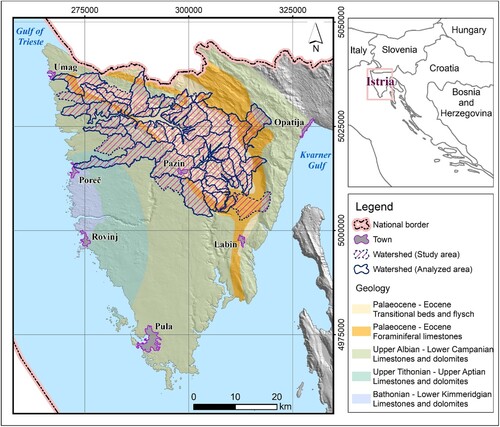
The focus of this research is the Middle Eocene clastic deposits of the Paleogene Pazin Basin, consisting of transitional beds and flysch (hereinafter termed as flysch and flysch-like materials). Transitional beds are presented with clayey limestones, calcitic marls, and marls (CitationVelić et al., 1995). The flysch complex corresponds mainly to Middle Eocene (CitationPetrinjak et al., 2021) and can be divided into the lower unit, characterized by the rhythmical marl and carbonate sediments exchange, and the upper unit, where carbonate-siliciclastic turbidite sediments are deposited (CitationBergant et al., 2003). They represent a small part of a large sedimentary system, which appeared as a consequence of the geotectonic changes on the carbonate platform during the Pyrenean compressional-tangential tectonic phase, in the period from the Eocene to the Oligocene (CitationMarinčić et al., 1996). The study area of this research presents the area of 60 delineated watersheds (896.78 km2), which comprised the entire area covered with flysch and flysch-like materials within the Paleogene Pazin Basin ().
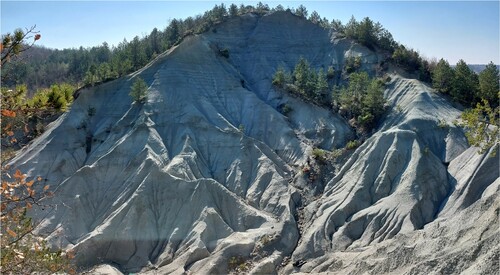
The badlands in the Basin are commonly formed as a result of excessive erosion (CitationJurak & Fabić, 2000), developing typical badland landscapes (). They are characterized by a sparse vegetation cover and an average yearly amount of denudation between 2.5 and 6.5 cm (CitationGulam et al., 2018).
Figure 2. Typical badland landscape in Istria.
The climate of the Istrian peninsula is quite diverse, with variations in mean annual temperatures and mean annual precipitation between the southwestern, coastal area, and the northeastern, hilly part of Istria. Therefore, the climate of the central area is classified as Continental, the western and southern coastal parts as the Mediterranean, and the eastern part as sub-Mediterranean. The area of the Pazin basin is characterized by warm summers and a mean annual precipitation of around 1,200 mm (CitationZaninović et al., 2008). The time-series analyses of climate factors and the amount of denudation have shown a positive correlation, with the highest rate of denudation prevailing during dry, warm periods followed by intensive rainstorms (CitationGulam, 2012).
3. Materials and methods
The input data used in this study to create badland inventory and generate derivatives for further spatial analyses are presented in .
Table 1. Input data used in this study.
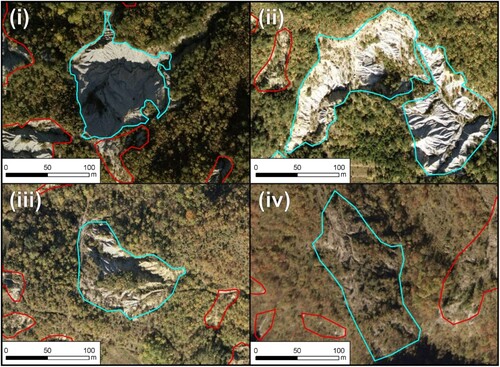
The badland inventory was prepared through systematic visual interpretation of digital orthophotos at a scale of 1:5,000 (CitationState Geodetic Administration of the Republic of Croatia, 2011). During the analysis of orthophotos, different coverage of badlands with vegetation was determined, which directly influences the precision of badland delineation. The lower the vegetation coverage is, the more precisely the boundary of the polygon that outlines the badland is. Accordingly, four badland categories are defined, as follows (CitationGulam, 2012): (i) 0%, (ii) 1–25%, (iii) 26–75%, and (iv) more than 75% of the badland area covered with vegetation ().
Figure 3. Examples of badland delineation for four badland categories (CitationGulam, 2012).
To enable the analysis of badland spatial distribution in more detail, the study area is divided into smaller spatial units, i.e. watersheds. A watershed also called a drainage basin or catchment area, is a geo-hydrological unit that presents any surface area from which runoff resulting from rainfall is collected and drained through a common point (CitationWani & Garg, 2009). A watershed may be considered as a dynamic environmental system unit where hydrologic and geomorphic processes interact, such as precipitation, evapotranspiration, infiltration, runoff generation, erosion, transport, and sedimentation (CitationRenschler, 2004). To extract watersheds objectively, the delineation is performed automatically using Arc Hydro Tool, as described by CitationBaye (2020). The manual interventions are made in flat areas, where the tool cannot follow watercourses properly due to the resolution of the digital elevation model. Since flat areas do not contain any badlands nor the flysch and flysch like-materials, which are in the focus of the analyzes, those parts of watersheds were simply removed.
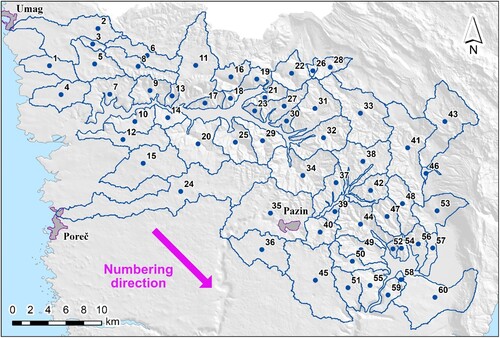
In order to place the watersheds in their mutual spatial relationship, the watersheds are numbered based on the spatial appearance of their centroids from NW to SE. In such a way, number one is assigned to the watershed located in the far NW part of the study area, while the larger one, number 60, is assigned to the watershed located in the far SE part (). This allowed the badland spatial distribution to be interpreted visually within the watersheds, but in a way also to quantify the evident trend of badland spatial occurrence in the NW-SE direction.
Figure 4. The numbering of the delineated watersheds within the study area.
Spatial analyses aimed to determine badland spatial distribution and its relationship with relief energy, which is considered as one of the critical parameters in badland formation. Since Istrian badlands are fully formed within flysch and flysch-like materials, spatial analyses were performed for all watersheds within which at least 5% of the area is covered with this unit. The area covered with such materials was distinguished according to basic geological maps of SFRY at a scale of 1:100,000. More precisely, four sheets that cover the study area have been used, i.e. Trst (CitationPleničar et al., 1969), Ilirska Bistrica (CitationŠikić et al., 1972), Rovinj (CitationPolšak & Šikić, 1969), and Labin (CitationŠikić et al., 1969). Finally, from the total of 60 watersheds outlined within the study area (896.78 km2), seven were excluded and 53 were used for further spatial analyses, presenting the analyzed area (787.24 km2).
Relative relief, also known as relief energy is one of the relief characteristics determined without considering the sea level. It is described by several authors as the difference in altitude between the highest and lowest points within a defined area (CitationNir, 1957). This certain area can present the standard areal unit of for example 1 km2, the area within a drainage basin of a given order, or between an individual interfluve and the adjacent valley bottom (CitationAhnert, 1970). In the local context, the relative relief represents a parameter of the intensity of the development of exogenetic processes (CitationLozić, 1995). Since in areas with a higher relative relief, the intensity of erosion is higher, it gives an indication of the potential relief energy for soil erosion. Therefore, it is used as one of the parameters to model erosion susceptibility (e.g. CitationVergari, 2015; CitationVijith & Dodge-Wan, 2019).
In this study, the spatial variability of relative relief is analyzed in two different ways. First, the difference between the maximum and minimum altitude is calculated for the area within each watershed, which presents the relative relief at a watershed scale. It allows interpreting its general spatial variability. Second, to present the distribution of relative relief continuously within watersheds, the difference between the maximum and minimum altitude is calculated for the circle neighborhood area with a radius of 100 m around each cell of a 20 m grid, which presents the relative relief at a 20 m grid scale. It allows the detailed analysis of the relationship between relative relief and badland occurrence.
To present the results of performed spatial analyses, the badland index is used, expressed in percentages (CitationBartelletti et al., 2017). The badland index for the study area (BI) is calculated as the ratio between the total badland area and the part of the study area covered with flysch and flysch-like materials. The watershed-badland index (BIW) is calculated for each analyzed watershed as the ratio between the badland area within a certain watershed and the area of that watershed covered with flysch and flysch-like materials. The relief-badland index (BIR) is calculated for each relative relief category within the area covered with flysch and flysch-like materials as the ratio between the badland area within a certain relative relief category and the area of that category.
4. Results and discussion
4.1. Badland statistics
According to the sheets of basic geological maps of SFRY, the flysch and flysch-like materials cover an area of 408.26 km2 (46%) within the study area. In that area, a total of 5,381 badland polygons were outlined, which corresponds to an average density of 13.18 badlands per square kilometre. The badlands cover a total area of 10.25 km2, i.e. 2,5% of the area covered with flysch and flysch-like materials. The badlands size ranges from 21.70 m2 to 0.08 km2, with an average area of 1,904.73 m2 (). Only 165 (3%) badlands are larger than 1,000 m2.
Table 2. Badland area basic statistics.
Considering the four badland types defined according to the vegetation cover, the number of badlands and, consequently the total badland area, are increasing from the first to the fourth category, which contains 61.64% of badlands. Conversely, going from the first to the fourth category the average badland area is decreasing from 5,218.25 m2 to 1,310.45 m2 ().
4.2. Spatial analyses
4.2.1. Badland spatial distribution
Based only on the visual inspection of the badland inventory, it is obvious that badlands are mostly concentrated in the eastern and southeastern parts of the Paleogene Pazin Basin. Moreover, it is clear that badlands are spatially not equally distributed, but the badland abundance is increasing from NW to SE. The total badland area is the largest within watersheds 41 and 44, with an area of 1.53 and 1.45 km2, respectively. The badlands were not identified within twelve analyzed watersheds, located NW from watershed 28.
In order to quantify the evident trend of badland spatial distribution at the watershed scale, the BIW is presented and compared with BI ().
Figure 5. Watershed-badland index (BIW) for the analyzed area of 53 watersheds. The badland index for the study area (BI) is also shown.
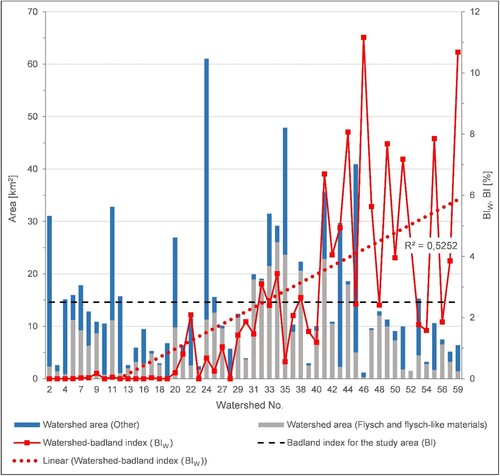
When the watersheds are lined up as they spatially appear going from NW to SE, the BIW is linearly increasing (), showing a moderate to high positive correlation (r = 0.7). It is also shown that the smallest BIW values are associated with the watersheds located in the far NW part of the Basin. Thus, for all watersheds numerated to number 31, the BIW is below the BI. For watersheds numerated with a number higher than 31, the BIW is above or near the BI line for 73% of watersheds. The largest BIW values of 11.16% and 10.68% are calculated for watersheds 46 and 59.
4.2.2. Badlands and relative relief
The relative relief at the watershed scale ranges from 134 m to 1,134 m (a). When the watersheds are lined up as they spatially appear going from NW to SE, the watershed scale relative relief is linearly increasing, showing a low positive correlation (r = 0.14). The highest values, above 600 m, are calculated for three watersheds located far E and SE, namely, watersheds 41, 43, and 53. This trend coincides with the intensity of tectonic activity within the study area. Unlike the fold-and-thrust system of Ćićarija and Učka mountains in the far eastern part of Istria, western and central Istria do not show a high degree of structural disturbance and are characterized by poorly distinguished, decametric folds of small amplitudes (CitationMarinčić & Matičec, 1991).
Figure 6. Relative relief: (a) at a watershed scale; (b) at a 20 m grid scale classified into four categories, for the area covered with flysch and flysch-like materials.
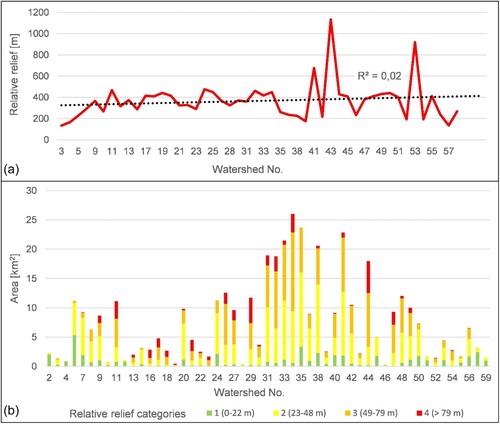
To present the relief energy in more detail, the relative relief at the 20 m grid scale is presented (Main Map). Calculated values of relative relief range from 0 m to 268 m. They are classified into four categories based on the natural breaks (Jenks) algorithm, as follows: 1 (<23 m), 2 (23 m–48 m), 3 (49 m–79 m), and 4 (>79 m). The area of four categories of relative relief is differently distributed within the watersheds area covered with flysch and flysch-like materials (b). Of them, the second and third categories prevail, covering almost 80% of the analyzed area (b). The fourth category of relative relief is absent within thirteen watersheds.
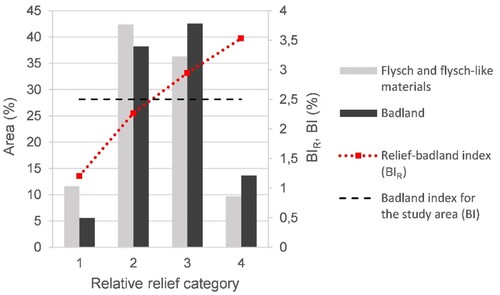
Considering the badland area distribution according to each relative relief category (), it is noticed that badlands mostly occur within the second and third categories (81% of total badland area). The smallest occurrence of badlands is detected within the first category (less than 6% of total badland area). However, if the area of each relative relief category is also taken into consideration and the relationship between badland occurrence and relative relief is presented through the BIR, it is shown that the BIR is increasing from the first to the fourth relief category. Moreover, the BIR for the third and fourth categories is above the BI line and the BIR for the first and second categories is below the BI line.
Figure 7. Area percentage of flysch and flysch-like materials and badland polygons within different categories of relative relief at a 20 m grid scale, with relief-badland index, compared to badland index.
The results of this analysis show that relative relief is positively correlated with the occurrence of badlands, where denudation processes dominate. Given the fact that relative relief can be considered as an indicator of the youngest tectonic movements (CitationMarković, 1983), it can be concluded that there is a correlation between tectonic activity and the intensity of exogenetic processes within the flysch and flysch-like materials in the study area. Uplift, by definition, tends to increase the relief, which leads to more rapid downhill transport influencing indirectly the rate of denudation (CitationAhnert, 1970). In most badland areas of the Mediterranean regions, the Quaternary tectonics have been quite active, leading to past and/or present uplifting (CitationGallart et al., 2002).
5. Conclusion
Badlands in central Istria are exclusively associated with Middle Eocene clastic deposits within the Paleogene Pazin Basin, which consist of the transitional beds and flysch on the area of 408.26 km2. For this area, the badland inventory was created, comprising 5,381 badland polygons manually delineated by visual interpretation of digital orthophotos at a scale of 1:5,000. Outlined polygons cover 2.5% of the total area of Middle Eocene clastic deposits.
Unlike the world-famous badland sites, which dominate extremely large areas, Istrian badlands appear as isolated and small landforms. This fact enabled the analysis of the spatial distribution of Istrian badlands, which was triggered by the obvious trend of the increase of badland density from the NW to the SE part of the study area.
Given that tectonic activity has an increasing trend in a similar direction on the Istrian peninsula, it was logical to test the geomorphological parameter (relative relief) which is, among other things, highly dependent on tectonics. The increasing trend of the badland index at the level of the analyzed watershed in the NW-SE direction confirmed the hypothesis that the share of badlands in a certain area largely depends on tectonic activity, i.e. uplift. This fact provides an answer to the question of why in the area of central Istria the distribution of badlands varies.
The presented badland inventory will be used in further research to analyze the relationship between badland spatial distribution and other environmental parameters supposed to be predisposing for badland occurrence, to produce a badland susceptibility map. Furthermore, the presented data will enable the comparison with updated badland inventory derived from new orthophotos in the near future, which will allow the discussion of badland initiation or extinguishing in the area of central Istria. Additionally, future studies on Istrian badlands will be focused on measuring the erosion rates on several selected badland locations where the UAV survey is carrying out periodically since 2018.
Software
ESRI ArcGIS 10.2.1 was used for: (i) visual interpretation of orthophotos; (ii) delineation of badland polygons, (iii) conduction of spatial analysis, and (iv) designing of the Main Map. The graphs are created in MS Excel 2016 and the final editing of the Main Map layout was performed using Affinity Designer 1.6.5.
Supplemental Material
Download Zip (21.1 MB)Acknowledgements
The authors would like to thank the Department of Hydrogeology and Engineering Geology of the Croatian Geological Survey for the big support and research funding.
Disclosure statement
No potential conflict of interest was reported by the author(s).
Data availability statement
The data that support the findings of this study are available from the corresponding author, [I.B.], upon reasonable request.
References
- Ahnert, F. (1970). Functional relationships between denudation, relief, and uplift in large, mid-latitude drainage basins. American Journal of Science, 268(3), 243–263. https://doi.org/10.2475/ajs.268.3.243
- Alonso-Sarria, F., Romero-Díaz, A., Ruíz-Sinoga, J., & Belmonte-Serrato, F. (2011). Gullies and badland landscapes in neogene basins, region of murcia, Spain. Landform Analysis, 17, 161–165.
- Bartelletti, C., Giannecchini, R., D’Amato Avanzi, G., Galanti, Y., & Mazzali, A. (2017). The influence of geological-morphological and land use settings on shallow landslides in the Pogliaschina T. Basin (northern Apennines Italy). Journal of Maps, 13(2), 142–152. https://doi.org/10.1080/17445647.2017.1279082
- Baye, M. (2020). Watershed delineation by arc hydro tools. International Journal of Science and Research (IJSR), 9(5), 956–961.
- Bergant, S., Tišljar, J., & Šparica, M. (2003). Eocene carbonates and flysch deposits of the pazin basin. In I. Vlahović & J. Tišljar (Eds.), Field trip guidebook, 22nd IAS meeting of sedimentology, institut za geološka istraživanja (pp. 57–63). Zagreb.
- Bianchini, S., Del Soldato, M., Solari, L., Nolesini, T., Pratesi, F., & Moretti, S. (2016). Badland susceptibility assessment in Volterra municipality (Tuscany Italy) by means of GIS and statistical analysis. Environmental Earth Sciences, 75(10), 1–14. https://doi.org/10.1007/s12665-016-5586-5
- Bryan, R., & Yair, A. (1982). Perspectives on studies of badland geomorphology. In R. Bryan, & A. Yair (Eds.), Badland geomorphology and piping (pp. 1–12). Geobooks.
- Coratza, P., & Parenti, C. (2021). Controlling factors of badland morphological changes in the emilia Apennines (northern Italy). Water, 13(4), 539. https://doi.org/10.3390/w13040539
- D’Intino, J., Buccolini, M., Di Nardo, E., Esposito, G., & Miccadei, E. (2020). Geomorphology of the anversa degli Abruzzi badlands area (Central Apennines Italy). Journal of Maps, 16(2), 488–499. https://doi.org/10.1080/17445647.2020.1780169
- Gallart, F., Solé-Benet, A., Puigdefábregas, J., & Lázaro, R. (2002). Badland systems in the Mediterranean. In J. L. Bull & M. J. Kirkby (Eds.), Dryland rivers: Hydrology and geomorphology of semi-arid channels (pp. 299–326). Wiley.
- Gulam, V. (2012). Erozija ogolina u flišu središnje istre [The erosion of flysch badlands in the Central Istria – in Croatian] (Unpublished doctoral dissertation). University of Zagreb, Faculty of Mining, Geology and Petroleum Engineering, 275p.
- Gulam, V., Gajski, D., & Podolszki, L. (2018). Photogrammetric measurement methods of the gully rock wall retreat in istrian badlands. Catena, 160, 298–309. https://doi.org/10.1016/j.catena.2017.09.024
- Gulam, V., Pollak, D., & Podolszki, L. (2014). The analysis of the flysch badlands inventory in central istria, Croatia. Geologia Croatica, 67(1), 1–15. https://doi.org/10.4154/GC.2014.01
- Harvey, A. (2004). Badland. In A. S. Goudie (Ed.), Encyclopedia of geomorphology, Vol. 1 (pp. 45–48). Routledge.
- Jurak, V., & Fabić, Z. (2000). Erozija kišom u slivu bujičnog vodotka u središnjoj Istri [Rain erosion in a torrent basin in central Istria – in Croatian]. In I. Vlahović & R. Biondić (Eds.), Proceedings of 2nd Croatian geological congress (pp. 603–612). Hrvatski geološki institut.
- Khosrowpanah, S., Wen, Y., & Kottermair, M. (2010). Spatial distribution of badlands in the Ugum Watershed: Characterization and temporal analysis. WERI Technical Report, 126, 29p.
- Leipe, S., & DeLuca, P. (2017). Evaluating badland susceptibility in Basilicata, Italy through the integration of GIS and multicriteria decision analysis. In GIS in education and research conference. Hart House, University of Toronto, 47.
- Liberti, M., Simoniello, T., Carone, M. T., Coppola, R., D’Emilio, M., & Macchiato, M. (2009). Mapping badland areas using LANDSAT TM/ETM satellite imagery and morphological data. Geomorphology, 106(3–4), 333–343. https://doi.org/10.1016/j.geomorph.2008.11.012
- Llena, M., Smith, M. W., Wheaton, J. M., & Vericat, D. (2020). Geomorphic process signatures reshaping sub-humid Mediterranean badlands: 2. Application to 5-year dataset. Earth Surface Processes and Landforms, 45(5), 1292–1310. https://doi.org/10.1002/esp.4822
- Lozić, S. (1995). Vertikalna raščlanjenost reljefa kopnenog dijela Republike Hrvatske [Vertical relief dissection of the land part of the Republic of Croatia – in Croatian]. Acta Geographica Croatica, 30, 17–28.
- Marinčić, S., & Matičec, D. (1991). Tectonics and kinematic of deformations – an Istrian model. Geološki Vjesnik, 44, 257–268.
- Marinčić, S., Šparica, M., Tunis, G., & Uchmann, A. (1996). The Eocene flysch deposits of the Istrian peninsula in Croatia and Slovenia: Regional, stratigraphic, sedimentological and ichnological analyses. Annales Histoire Sciences Sociales, 9, 139–156.
- Marković, M. (1983). Osnovi primenjene geomorfologije [Fundamentals of applied geomorphology – in Serbian]. Posebna Izdanja, Knjiga, 8, Geoinstitut, Beograd.
- Marsico, A., De Santis, V., & Capolongo, D. (2021). Erosion rate of the aliano biancana badlands based on a 3D multi-temporal high-resolution survey and implications for wind-driven rain. Land, 10(8), 828. https://doi.org/10.3390/land10080828
- Martínez-Murillo, J. F., & Nadal-Romero, E. (2018). Perspectives on badland studies in the context of global change. In E. Nadal-Romero (Ed.), Badlands dynamics in a context of global change (Chapter 1, pp. 1–25). Elsevier Inc. https://doi.org/10.1016/B978-0-12-813054-4.00001-0
- Moreno-de Las Heras, M., & Gallart, F. (2018). The origin of badlands. In E. Nadal-Romero (Ed.), Badlands dynamics in a context of global change (Chapter 2, pp. 27–59). Elsevier Inc. https://doi.org/10.1016/B978-0-12-813054-4.00002-2
- Neugirg, F., Stark, M., Kaiser, A., Vlacilova, M., Della Seta, M., Vergari, F., Schmidt, J., Becht, M., & Haas, F. (2016). Erosion processes in calanchi in the upper orcia valley, southern tuscany, Italy based on multitemporal high-resolution terrestrial LiDAR and UAV surveys. Geomorphology, 269, 8–22. https://doi.org/10.1016/j.geomorph.2016.06.027
- Nir, D. (1957). The ratio of relative and absolute altitudes of Mt. Carmel: A contribution to the problem of relief analysis and relief classification. Geographical Review, 47(5), 564–569. https://doi.org/10.2307/211866
- Petrinjak, K., Budić, M., Bergant, S., & Korbar, T. (2021). Megabeds in istrian flysch as markers of synsedimentary tectonics within the Dinaric foredeep (Croatia). Geologia Croatica, 74(2), 99–120. https://doi.org/10.4154/gc.2021.07
- Pleničar, M., Polšak, A., & Šikić, D. (1969). Osnovna geološka karta SFRJ 1:100000, list Trst L33−88 [Basic geological Map of SFRY 1:100000, trst sheet – in Croatian]. Geološki zavod, Ljubljana & Institut za geološka istraživanja, Zagreb; Savezni geološki zavod.
- Polšak, A., & Šikić, D. (1969). Osnovna geološka karta SFRJ 1:100000, list Rovinj L33−100 [Basic geological Map of SFRY 1:100000, Rovinj sheet – in Croatian]. Institut za geološka istraživanja, Zagreb; Savezni geološki zavod.
- Renschler, C. S. (2004). Watershed. In A. S. Goudie (Ed.), Encyclopedia of geomorphology, Vol. 1 (pp. 1101). Routledge.
- Scheidegger, A. E., Schumm, S. A., & Fairbridge, R. W. (1968). Badlands. In R. W. Fairbridge (Ed.), Geomorphology. Encyclopedia of earth science. Springer. https://doi.org/10.1007/3-540-31060-6_21
- Šikić, D., Pleničar, M., & Šparica, M. (1972). Osnovna geološka karta SFRJ 1:100000, list Ilirska Bistrica L33−89 [Basic geological Map of SFRY 1:100000, Ilirska Bistrica sheet – in Croatian]. Institut za geološka istraživanja, Zagreb & Geološki zavod, Ljubljana; Savezni geološki zavod.
- Šikić, D., Polšak, A., & Magaš, N. (1969). Osnovna geološka karta SFRJ 1:100000, list Labin L33−101 [Basic geological Map of SFRY 1:100000, Labin sheet – in Croatian]. Institut za geološka istraživanja, Zagreb; Savezni geološki zavod.
- State Geodetic Administration of the Republic of Croatia. (2011). Croatian digital orthophoto at a scale of 1:5,000.
- Torri, D., Poesen, J., Rossi, M., Amici, V., Spennacchi, D., & Cremer, C. (2018). Gully head modelling: A Mediterranean badland case study. Earth Surface Processes and Landforms, 43(12), 2547–2561. https://doi.org/10.1002/esp.4414
- Velić, I., Tišljar, J., Matičec, D., & Vlahović, I. (1995). A review of the geology of istria. In I. Vlahović & I. Velić (Eds.), Excursion guide-book of 1st Croatian geological congress (pp. 5–30). Institut za geološka istraživanja.
- Vergari, F. (2015). Assessing soil erosion hazard in a key badland area of Central Italy. Natural Hazards, 79(1), 71–95. https://doi.org/10.1007/s11069-015-1976-3
- Vericat, D., Smith, M. W., & Brasington, J. (2014). Patterns of topographic change in sub-humid badlands determined by high resolution multi-temporal topographic surveys. Catena, 120, 164–176. https://doi.org/10.1016/j.catena.2014.04.012
- Vijith, H., & Dodge-Wan, D. (2019). Modelling terrain erosion susceptibility of logged and regenerated forested region in northern borneo through the analytical hierarchy process (AHP) and GIS techniques. Geoenvironmental Disasters, 6(1), 8. https://doi.org/10.1186/s40677-019-0124-x
- Wani, S. P., & Garg, K. K. (2009). Watershed management concept and principles. In S. P. Wani, B. Venkateswarlu, K. L. Sahrawat, K. V. Rao, & Y. S. Ramakrishna (Eds.), Best-bet options for integrated watershed management, proceedings of the comprehensive assessment of watershed programs in India (pp. 1–11). ICRISAT.
- Yang, C. J., Yeh, L. W., Cheng, Y. C., Jen, C. H., & Lin, J. C. (2019). Badland erosion and its morphometric features in the tropical monsoon area. Remote Sensing, 11(24), 3051–14. https://doi.org/10.3390/rs11243051
- Zaninović, K., Gajić-Čapka, M., Perčec Tadić, M., et al. (2008). Klimatski atlas Hrvatske 1961–1990, 1971–2000 [Climate atlas of Croatia – in Croatian]. Državni hidrometeorološki zavod, 200p.