
ABSTRACT
We use the 2021 GEBCO grid to interpret the seabed geomorphology within the Cook Islands and adjacent areas. A complex geological history dating back to 125 Ma is manifested in a range of geoforms. These include abyssal plains, plateaux, volcanic and tectonic rises, seamount-knolls and chains and troughs, as well as fault zones. A Main Map at 1:3,000,000 scale is presented with example cross-sections, with 1:10,000,000 scale inset maps of bathymetry, mineral occurrences (the Cook Islands has a major polymetallic nodule resource), feature names and regional setting. We expect these map products to be of value to stakeholders interested in exploration and mineral resource assessment, marine habitat management, and the general make-up of this small island large ocean country.
1. Introduction
The release of an updated global bathymetric product (CitationGEBCO Compilation Group, 2021) provides an opportunity to interpret the regional seabed bathymetry of the Cook Islands which has value in the geological, marine environmental and cultural areas (Main Map).
The Cook Islands exclusive economic zone (CI EEZ) contains polymetallic nodules, which in turn contain manganese, copper, nickel, iron and cobalt at levels that have reasonable prospects for eventual economic extraction (CitationHein et al., 2015). In early 2022, exploration licences were issued to three commercial groups who are looking to develop this deposit further (CitationCook Islands Seabed Minerals Authority, 2022).
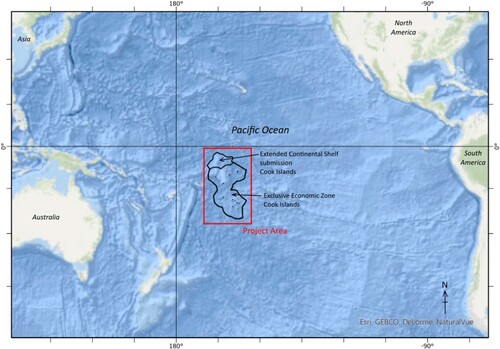
The CI EEZ is 1,969,900 km2 (per Lambert equal area projection, as used throughout) encompassing its fifteen islands with a mere combined landmass of about 236 km2 (). The Cook Islands has also submitted an application for an extended continental shelf (ECS) of 412,022 km2. This area includes some relative old seafloor known (90–120 Ma; CitationMüller et al., 2016). Dating of much of the CI EEZ is compromised by a lack of detailed seabed magnetic data and by much of the geological formation having occurred during the Cretaceous long normal period (Chron 34, 124.6–84 Ma; (CitationTaylor, 2006)).
Figure 1. Location map of the Cook Islands.
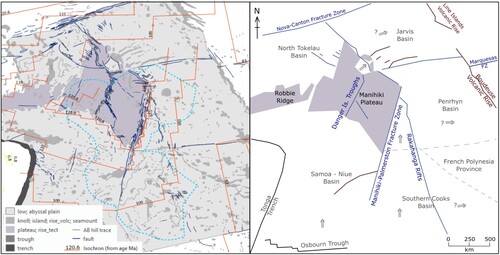
Within and to the northwest of the CI EEZ is the Manihiki Plateau dated at ca 123–124 Ma (CitationTaylor, 2006; CitationTimm et al., 2011), which might have formed a part of a much larger submarine large igneous province that rifted apart shortly after its formation (CitationTaylor, 2006). The plateau evidences boundary faults and horsts on its northern and eastern sides as well as internal and broadly sub-parallel rift zones (). To the south and east of the plateau are abyssal plains that in turn are spatially divided into three basins (). Fracture zones are the most common bounding feature to the basins and plateau. Volcanic edifices have been superimposed onto the more ancient oceanic crust. These include isolated and chains of seamount and knolls as well as more continuous volcanic rises. The chains are in a variety of orientations, but many trend WNW to ESE which are interpreted to have resulted from the north-westward movement of the Pacific Plate over areas of hotspot activity (hotspot highway of Jackson et al. (Citation2020)).
Figure 2. Large scale geomorphological units and tectonic setting. Isochrons after (CitationMüller et al., 2016).
2. Methods
The interpretation of the map and insets is new, and broadly follows the methods of Parianos and Madureira (Citation2021), and is based on the following data sources:
2021 GEBCO grid with cell size of 15 × 15 arc seconds from GEBCO Compilation Group (Citation2021). Within the Cook Islands exclusive economic zone and extended continental shelf application (CitationGovernment of the Cook Islands, 2021) the CitationGEBCO, 2021 grid is comprised of 76% interpolated values guided by satellite-derived gravity data, 22% from provided multibeam data and 2% from soundings (that serve to constrain the satellite data);
Publicly available ship-track multibeam data (CitationNational Centers for Environmental Information, 2020). While these data are incorporated into the GEBCO grids, but the original data-products are of higher resolution and were used here in the interpretation where possible (e.g. CitationNakanishi et al., 2015; CitationUenzelmann-Neben, 2012; CitationWerner et al., 2013; CitationWerner & Hauff, 2007).
Formal gazetted feature names (CitationInternational Hydrographic Organization Data Centre for Digital Bathymetry, 2022), and informal names, the later mostly coming from the references elsewhere in this publication.
Global magnetic compilation (CitationDyment et al., 2015).
Mineral occurrence data (CitationAndreev et al., 2008).
The GEBCO bathymetric grid was processed into 100 and 50 m contour maps and colour gradient maps for use in imaging processing software and geographic information systems (ArcGIS Pro and QGIS were both used).
The contour data were analysed visually and after some experimentation with different depth intervals, a set of primary contours at approximately 500 or 600 m depth intervals were selected for their ability to elucidate discrete units within the area (e.g. ). The specific intervals selected for the final interpretation are:
2525 m;
3125 m;
3775 m;
4425 m;
4925 m; and
5675 m.
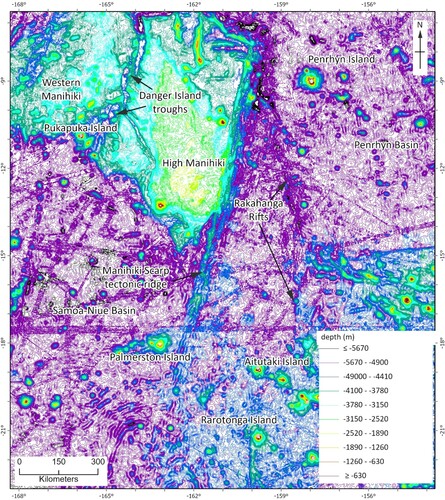
Figure 3. Subset of the bathymetric contour map with some of the more prominent features.
The colour gradient maps helped more with picking boundaries as well as other lineaments. The gradients were also sectioned to support the interpretation further. The area of each unit was measured in GIS using a Lambert Azimuthal Equal Area projection centred on 161 degrees W and 16 degrees south.
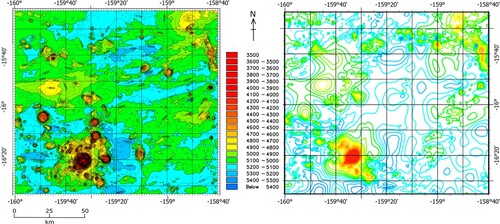
Area-wide interpretation was then made using the GEBCO grids. Boundaries between features and domains as well as other structural features (lineaments and potential faults) were interpreted directly into the GIS software and the final maps thus are principally qualitative. Interpretation is generally completed at screen-scales of between 1:1,000,000 and 1:2,000,000 and the final Main Map is at 1:3,000,000. The interpretation was also checked against the broad scale bathymetric position index (BPI, ; CitationWright et al., 2005), and in one small area against 15 kHz MBES (; CitationJICA/MMAJ 2001). BPI measures each data point’s altitude relative to its neighbourhood creating a continuous grid of relative position. Naming of features followed as much as possible (CitationInternational Hydrographic Organization, 2019).
Figure 4. Bathymetric position index overlain with outlines of the reported geomorphological interpretation.
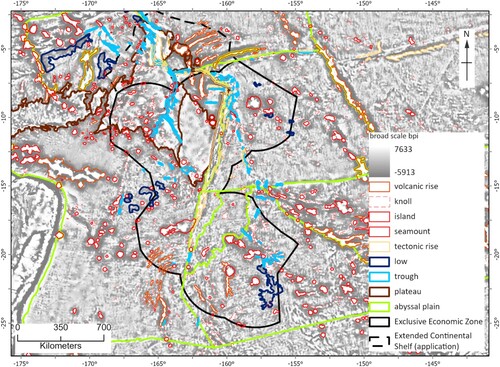
Figure 5. Comparison between JICA 2000 MBES bathymetry survey area and CitationGEBCO 2021 grid.
The interpretation of much of this map can be classified within the Tectonic Setting Subcomponent level (thousands of km2 scale) of the Coastal and Marine Ecological Classification Standard (CMECS; CitationUS Federal Geographic Data Committee, 2012). The key exception is the demarcated knolls and some seamounts, rises and troughs which are at the Physiographic Setting Subcomponent level (hundreds of km2 scale). This allows associated or future work, being done at a variety of scales and on a variety of themes (e.g. towed photo profile-based habitat mapping), to be integrated into the same management system.
3. Results
The interpretation results are shown on a Main Map at 1:3,000,000 scale which is accompanied by four inset maps (all at 1:10,000,000 scale) and three bathymetric cross-sections (at 1:3,000,000 scale). Map units terminology aligns with the IHO B-6 (SCUFN; CitationInternational Hydrographic Organization, 2019).
The Main Map is composed of units of:
Abyssal plains are generally areas with limited relief except for traces of abyssal hills and small knolls. They are typically presented as ‘basins’ bound by major features such as transform fracture zones, plateaux and volcanic rises. Abyssal hill traces are selected examples of abyssal hill orientations traced from the parts of the GEBCO grid composed from MBES data. Abyssal plain lows are restricted areas of abyssal plains characterised by slightly greater depth (100–300 m) than the adjacent plains. The Aitutaki Passage is a subtly lower area of abyssal plain that is highlighted due to its interpreted importance in controlling the distribution of the nodule fields (CitationPautot & Melguen, 1979). Key basins of note are the Penrhyn Basin in the northeast, the Samoa-Niue Basin in the southwest and the Southern Cooks Basin in the southeast (note feature name inset map).
Knolls are volcanic edifices rising no more than 1000 m above the surrounding seafloor, found on plains and plateaux. Only the larger knolls were mapped either as singular (usually circular) or compound forms. They are often found amongst seamount chains but may often form their own chains.
Seamounts are volcanic edifices >1000 m, found on plains and plateaux. With knolls, they often form volcanic chains. These are in a variety of orientations including the Hawaiian – Emperor orientation, e.g. as followed by the Arago Chain (CitationJackson et al., 2020; CitationWessel & Kroenke, 2008) that includes most of the Southern Group Islands of the Cook Islands. In some places, the chains grade into volcanic rises (see below). Seamounts are mapped as singular (usually circular) and compound forms. All of the islands within the EEZ are mapped seamounts that breach the sea-surface. Flat-topped edifices (guyots) located on the Manihiki Plateau indicate that these may have been at a subaerial depth in the past.
Volcanic ridges are typically elongate rises of probable volcanic origin. They form from merged volcanic chains and the compound forms of seamounts. Some rises are very extensive, e.g. the 1200 km long Boudeuse Rise at the eastern limit of the Penrhyn Basin.
Plateaux are extensive areas of seafloor elevated (500–2000 m) relative to the plains. They do not present evidence of abyssal hills (all units are very likely all part of the much older Manihiki Plateau) which is known to have significant sediment cover (in some places ∼1 km). The Plateau can be subdivided based on form and depth, e.g. per CitationWinterer et al. (1974), noting also the feature name inset map. The western parts of the plateau have more knolls; it is not known if this is due to later volcanic activity or different amounts of sediment cover.
Tectonic ridges are typically elongate rises of probable tectonic origin. Most are located along the northern and eastern (Manihiki Scarp) edges of the Manihiki Plateau, as well as developed along the Manihiki-Palmerston fault zone which trends to the SE of the plateau. Seismic survey interpreted by CitationAi et al. (2008) revealed that the top of the Manihiki Scarp is flat and likely contains a similar sedimentary sequence to the High Plateau located immediately to the west.
Troughs are narrow/elongate and usually aligned depressions 500–1000 m deep. They are found cutting both plains and plateaux. Most notable are the Danger Island/Suvarov Troughs that partially crosscut the Manihiki Plateau in orientations sub-parallel to the eastern and southern rifted margins of the plateau itself.
Mapped faults are mapped breaks in the seabed bathymetry either at a high angle to prevailing abyssal hill traces or of too great a magnitude to be the normally faulted escarpments of abyssal hills. Fault zones of note include the Manihiki-Palmerston Fracture Zone (which includes likely entrained fragments of the Manihiki Plateau) and the Rakahanga Rifts which are believed to represent a now inactive transform fault zone and triple junction trace (CitationLarson et al., 2002) with abyssal hill traces being at 90° to each other on either side.
In addition to the Main Map the following four inset maps:
The GEBCO bathymetric grid for the area with a colour stretch and underlying shaded relief to highlight many of the features interpreted in the Main Map;
An atlas of feature names, including both formal and informal names per Methods section above;
A compilation of mineral occurrences including polymetallic nodules, ferromanganese crusts and rare-earth bearing muds (clay-ooze);
The regional setting of the Main Map, being the same interpretation but including much of the surrounding area whose interpretation provided context to the Main Map.
The three cross-sections are all with a vertical exaggeration of 10:1 and involve:
Section A to A′ compares the Western and High (eastern) sides of the Manihiki Plateau as well as bounding troughs and rises as well as the adjacent Penrhyn Basin;
Section B to B′ compare the relative depths of the Samoa-Niue, Southern Cooks and Penrhyn Basins;
Section C to C′″ runs northeast along the Palmerston Island volcanic chain, then east-southeast along the Arago volcanic Chain.
4. Conclusions
The Cook Islands EEZ and ECS are mapped at a regional scale of 1:3,000,000 scale, based on the GEBCO bathymetric grid. Accompanying inset maps address bathymetric background, mineral occurrences, named features and regional setting. Selected cross-sections illustrate the relative depths of key features.
The mapped geomorphological and structural units characterise each part of the area. This includes definition of abyssal plains (basins), plateaux, volcanic and tectonic rises, and troughs, as well as seamount chains and fault zones.
This interpretation could be of interest to those who are working in the region, their regulators and other independent stakeholders. Possible applications might include mineral resource domaining (e.g. nodule fields within the abyssal plains) and habitat management zones (assuming that geomorphological setting has an influence on marine biodiversity). A wide range of Cook Island stakeholders will likely be generally interested to learn more about the make-up of their country.
Similar process of interpretation may be beneficial for workers in other areas of the seafloor.
Software
For the map: GEBCO grids were clipped and contoured in (gdal_contour) in QGIS 3.10.7. Testing was done via the Broad Scale Bathymetric Position Index functions within the Benthic Terrain Modeller addin for ArcGIS (CitationWalbridge & Wright, 2012). Interpretation and map compilation was done in ArcGIS Pro 2.9.0 Terrain profiles for the cross-sections were derived using Profile Tool 4.1.8 in QGIS 3.10.7, and assembled/interpreted in Inkscape 0.92.4. Map was compiled and set in ArcGIS Pro 2.9.0. The bulk of the interpretation and compilation was done at 1:1,000,000–1:2,000,000 scale with smaller scales (down to ∼1:200,000) used in some more complex settings. The digitising used 27″ 1920 × 1080p displays. At 1:1,000,000 scale, 10 km on the map was about 1.2 cm on the screen.
Figures were drafted either in ArcGIS Pro 2.9.0, QGIS 3.10.7 or Inkscape 0.92.4.
Supplemental Material
Download Zip (17.2 MB)Acknowledgements
Review of an early draft of this paper by Gerald McCormack and Darryl Thorburn improved it significantly. Suzanne Bergman assisted in the preparation of the bathymetric position index.
Disclosure statement
No potential conflict of interest was reported by the author(s).
Data availability statement
GIS data can be provided on written request to the authors.
Additional information
Funding
References
- Ai, H.-A., Stock, J. M., Clayton, R., & Luyendyk, B. (2008). Vertical tectonics of the High Plateau region, Manihiki Plateau, Western Pacific, from seismic stratigraphy. Marine Geophysical Researches, 29(1), 13–26. https://doi.org/10.1007/s11001-008-9042-0
- Andreev, S., Burskey, A. Z., Gramberg, I. S., Anikeeva, I. I., Ivanova, A. M., Kotlinski, R., Zadornov, M. M., Miletenki, N. V., & Mirchink, I. M. (2008). Metallogenic map of the world ocean (S. Andreev (ed.); 2nd ed.). Vniiokeangeologia. http://vniio.ru/en/about/science_dept/poleznyeiskopaemie/geominocean_dep/
- Cook Islands Seabed Minerals Authority. (2022). Historic first seabed minerals exploration licences granted. https://www.sbma.gov.ck/news-3/article-88
- Dyment, J., Lesur, V., Hamoudi, M., Choi, Y., Thebault, E., Catalan, M., & the WDMAM Task Force*, the WDMAM Evaluators**, and the, W. D. P. (2015). World Digital Magnetic Anomaly Map version 2.0. http://www.wdmam.org
- GEBCO Compilation Group. (2021). GEBCO 2021 grid. https://www.gebco.net/data_and_products/historical_data_sets/#gebco_2021
- Government of the Cook Islands. (2021). Revised submission to the commission on the limits of the continental shelf concerning the Manihiki Plateau.
- Hein, J. R., Spinardi, F., Okamoto, N., Mizell, K., Thorburn, D., & Tawake, A. (2015). Critical metals in manganese nodules from the Cook Islands EEZ, abundances and distributions. Ore Geology Reviews, 68, 97–116. https://doi.org/10.1016/j.oregeorev.2014.12.011
- International Hydrographic Organization. (2019). B 6 standardization of undersea feature names (4.2.0). chrome-extension://efaidnbmnnnibpcajpcglclefindmkaj/https://iho.int/uploads/user/pubs/bathy/B-6_e420_Eng_Por_versao-final_17Dec2020.pdf
- International Hydrographic Organization Data Centre for Digital Bathymetry. (2022). Undersea feature names gazetteer. https://www.ngdc.noaa.gov/gazetteer/
- Jackson, M. G., Halldórsson, S. A., Price, A., Kurz, M. D., Konter, J. G., Koppers, A. A. P., & Day, J. M. D. (2020). Contrasting old and young volcanism from Aitutaki, Cook Islands: Implications for the origins of the cook–austral volcanic chain. Journal of Petrology, 61(3), 1–5. https://doi.org/10.1093/petrology/egaa037
- JICA/MMAJ. (2001). Report on the cooperative study project on the deepsea mineral resources in selected offshore area on the Sopac Region.
- Larson, R. L., Pockalny, R. A., Viso, R. F., Erba, E., Abrams, L. J., Luyendyk, B. P., Stock, J. M., & Clayton, R. W. (2002). Mid-Cretaceous tectonic evolution of the Tongareva triple junction in the southwestern Pacific Basin. Geology, 30(1), 67. https://doi.org/10.1130/0091-7613(2002)030<0067:MCTEOT>2.0.CO;2
- Müller, R. D., Seton, M., Zahirovic, S., Williams, S. E., Matthews, K. J., Wright, N. M., Shephard, G. E., Maloney, K. T., Barnett-Moore, N., Hosseinpour, M., Bower, D. J., & Cannon, J. (2016). Ocean basin evolution and global-scale plate reorganization events since Pangea breakup. Annual Review of Earth and Planetary Sciences, 44(1), 107–138. https://doi.org/10.1146/annurev-earth-060115-012211
- Nakanishi, M., Nakamura, Y., Coffin, M. F., Hoernle, K., & Werner, R. (2015). Topographic expression of the Danger Islands Troughs and implications for the tectonic evolution of the Manihiki Plateau, western equatorial Pacific Ocean. In C. Neal, W. Sager, T. Sano, & E. Erba (Eds.), The origin, evolution, and environmental impact of oceanic large igneous provinces (pp. 195–220). Geological Society of America. https://doi.org/10.1130/2015.2511(11)
- National Centers for Environmental Information. (2020). Bathymetric Data Viewer. Retrieved July 30, 2020, from https://maps.ngdc.noaa.gov/viewers/bathymetry/
- Parianos, J., & Madureira, P. (2021). Geomorphology of the Clarion Clipperton Zone, tropical North Pacific Ocean. Journal of Maps, 17(2), 901–909. https://doi.org/10.1080/17445647.2021.2001387
- Pautot, G., & Melguen, M. (1979). Influence of deep water circulation and sea floor morphology on the abundance and grade of central south pacific manganese nodules. In J. L. Bischoff & D. Z. Piper (Eds.), Marine geology and oceanography of the pacific manganese nodule province (pp. 621–649). Springer US. https://doi.org/10.1007/978-1-4684-3518-4
- Taylor, B. (2006). The single largest oceanic plateau: Ontong Java–Manihiki–Hikurangi. Earth and Planetary Science Letters, 241(3–4), 372–380. https://doi.org/10.1016/j.epsl.2005.11.049
- Timm, C., Hoernle, K., Werner, R., Hauff, F., den Bogaard, P. v., Michael, P., Coffin, M. F., & Koppers, A. (2011). Age and geochemistry of the oceanic Manihiki plateau, SW Pacific: New evidence for a plume origin. Earth and Planetary Science Letters, 304(1–2), 135–146. https://doi.org/10.1016/j.epsl.2011.01.025
- Uenzelmann-Neben, G. (2012). The expedition of the research vessel Sonne to the Manihiki Plateau in 2012 (So 224). https://doi.org/10.2312/BzPM_0656_2012
- US Federal Geographic Data Committee. (2012). Coastal and marine ecological classification standard. http://www.fgdc.gov/standards/projects/cmecs-folder/CMECS_Version_06-2012_FINAL.pdf
- Walbridge, S., & Wright, D. (2012). Benthic terrain modeler. ArcGIS Resources. https://resources.arcgis.com/en/communities/oceans/02pp00000007000000.htm
- Werner, R., & Hauff, F. (2007). Cruise report SO193 Manihiki temporal, spatial, and tectonic evolution of oceanic plateaus. https://doi.org/10.3289/ifm-geomar_rep_13_2007
- Werner, R., Nürnberg, D., Hauff, F., & and the shipboard scientific party (2013). Manihiki II Leg 2 The Manihiki Plateau – Origin structure and effects of oceanic plateaus and Pleistocene dynamic of the West Pacific Warm Water Pool. https://doi.org/10.3289/GEOMAR_REP_NS_5_2012
- Wessel, P., & Kroenke, L. W. (2008). Pacific absolute plate motion since 145 Ma: An assessment of the fixed hot spot hypothesis. Journal of Geophysical Research, 113(B6), B06101. https://doi.org/10.1029/2007JB005499
- Winterer, E., Lonsdale, P., Matthews, J., & Rosendahl, B. (1974). Structure and acoustic stratigraphy of the Manihiki Plateau. Deep Sea Research and Oceanographic Abstracts, 21(10), 793–813. https://doi.org/10.1016/0011-7471(74)90001-1
- Wright, D. J., Lundblad, E. R., Larkin, E. M., Rinehart, R. W., Murphy, J., Cary-Kothera, L., & Draganov, K. (2005). ArcGIS benthic terrain modeler. Oregon State University, Davey Jones Locker Seafloor Mapping/Marine GIS Laboratory and NOAA Coastal Services Center. http://www.csc.noaa.gov/products/btm/%0A