
ABSTRACT
Digital maps prepared by using geographic information systems are more diverse and common each day. Nevertheless, the lack of accessible files such as maps created in widely used but complex/expensive software is responsible for a limited number of users. With time, geographic visors have helped to overcome this ‘inaccessibility’ through more user-friendly platforms such as a free multi-temporal remote sensing data such as the Google Earth Engine. The updated GMSA was overlapped on this geospatial platform. As more people visualize maps, recent discoveries can be communicated with greater efficiency. Within the framework of the Vice-presidency for the GMSA and the Commission for the Geological Map of the World, the GMSA was launched in 2019 and, since 2021, has been available on Google Earth. This paper summarizes how the GMSA in Google Earth was implemented. It is expected this publication helps other map producers to create similar products.
GRAPHICAL ABSTRACT
1. Introduction
The third edition of the Geological Map of South America (GMSA) (CitationGómez et al., 2019) was prepared by most of the geological surveys of the subcontinent (Argentina, Brazil, Chile, Colombia, Ecuador, Peru and Uruguay) in close collaboration with other institutions, such as universities and research institutes. It was delivered in 2019 by the Commission for the Geological Map of the World (CGMW) as a part of continental projects. The GMSA project was coordinated by the Servicio Geológico Colombiano (SGC), the Serviço Geológico do Brasil (CPRM) and the Association of Iberoamerican Geological and Mining Surveys (ASGMI).
This GMSA at a scale of 5 M version was published in 2019 and required several international workshops, where the information was exchanged and discussed, until an integrated and harmonic map was developed. Subsequently, the GMSA in the Google Earth version was launched in February 2022 and is freely available on the SGC web page.
Geological maps are very important for the economic and social development of nations, as well as for geological heritage, touristic and educational activities. Maps allow us to know the distribution of mainly rocks and unconsolidated deposits, as well as other geological materials and structures (such as faults, folds, volcanoes, craters, among others) and natural resources. Maps also help to locate and understand geological hazards, infrastructure, and much more. Similarly, geological maps critically support a variety of management decisions and provide a window to the Earth’s skin that allows us to infer the geological history of our planet. Therefore, it seems clear that interest on geological maps will continue to increase for a vast number of different people. Geological maps on Google Earth are valuable because they enlarge the range of users who are able to access geological information in software available everywhere and used worldwide (CitationTewksbury et al., 2012).
Google Earth is free and user-friendly software where basic geographic information (among other information) can be displayed and enables users to discover, visualize and analyze geospatial information through different tools and for both nonexpert or expert users (e.g. Wang et al., Citation2022), and even could simulate creatively otherwise in-person activities (CitationWhitmeyer & Dordevic, 2021). In addition, since its early stages, Google Earth has delivered high-quality imaging allowing geologists to conduct cartography (e.g. CitationWhitmeyer & Dordevic, 2021) and teach (e.g. CitationDe Paor et al., 2017) and find interesting research opportunities, for example. Therefore, continental-scale mapping is critical to these purposes and can be effectively used to engage users (Wang et al., Citation2022). Additionally, Google Earth is easy to browse for most users around the world and is intuitive even for nonexpert users. Google Earth was launched in 2006 and has not stopped increasing in popularity, perhaps due to its usefulness, intuitive 3D rendering, high-resolution images and interoperability for recovering and validating information (CitationLiang et al., 2018). Nevertheless, what makes it so widely used is its free access. Google Earth’s mobile phone app was launched in 2010 and was updated in 2022. Similarly, the online web service, https://earth.google.com, was launched in 2016 (CitationLiang et al., 2018). These allow for the easy use of the GMSA in Google Earth on mobile phones, laptops and desktop devices. According to CitationWhitmeyer and Dordevic (2021), likely web Google Earth will be the most widely used in the future.
Google Earth software is useful for additional reasons. For example, data migration by institutional server PCs may cause these products to be unstable and/or incomplete. For example, URL links may take users to non-functioning web pages. Consequently, data updating was performed to a more stable keyhole markup language (KML) file of Google Earth.
Few geological maps have been published in KML, and methodologies have not been published as a peerreviewed document. To prepare the GMSA in Google Earth, four geological maps were used as examples.
The Geologic Map of North America at 5 M (CitationReed et al., 2005) was migrated in a geodatabase to be displayed as a GIS (CitationGarrity & Soller, 2009). One of the delivered products included by the U.S. Geological Survey (USGS) was the geologic map in the KML format, with the geology of the continent and the Caribbean Sea using raster imagery.
The British Geological Survey also published an edition of the Engineering Geology (bedrock) map of the United Kingdom (CitationDearman et al., 2011) at 1:650,000 scale in KML format, available for free on their website. This digital map edition shows the geology of the United Kingdom by using vectorized polygons and includes entries of URL and pop-up windows with additional lithological units’ information.
On the other hand, the CGMW has the Geological Map of the World at 35 M (CitationBouysse, 2014) available in the KML format, using raster imagery.
Finally, the Geological Map of Colombia Working Team (GMC) of the SGC delivered the Geological Map of Colombia (CitationGómez et al., 2015, Citation2017) at a scale of 1:1 M as a KML file in 2016. As a result, the GMC has developed the bases and experience to prepare the GMSA in Google Earth.
Our aim is to share with readers the methodology followed to develop the GMSA as a KML file, since this may be improved and used for all those interested in developing similar products. We will be happy if we can get in touch with map developers to help with any requirements or to have fruitful discussions.
2. Materials and methods
The main source was the GMSA geodatabase developed in ArcMap 9.5. It has 44 feature classes in 6 feature datasets. The Geology Feature Dataset was the most important and is composed of 17 feature classes, including points, lines, polygons and texts that represent 15,328 features.
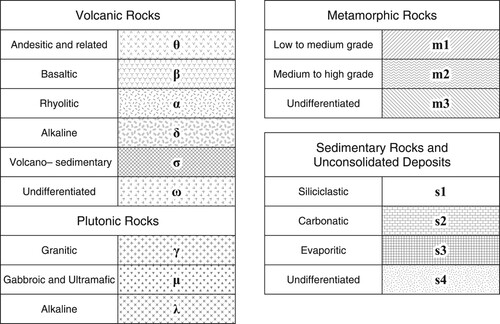
The feature dataset display was prepared by using the ArcMap platform to obtain the layout at the original scale and then was exported at the best high-quality imaging resolution. The Geology Feature Dataset displays all feature classifications to guarantee the inclusion of all geological features in the map view and to keep the properties since the GMSA was prepared with the main aim of representing chronolithostratigraphic units for easy differentiation by users. Symbology and unit-coding styles were used according to CitationGómez et al. (2019). shows the symbology and coding.
Figure 1. Chronolithostratigraphic units of the Geological Map of South America 2019 (modified from CitationGómez et al., 2019).
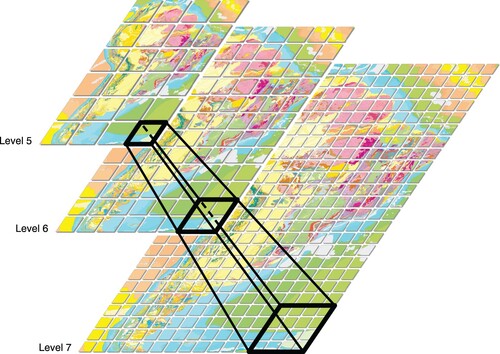
Imaging was created in the TIFF format and then subdivided into tiles to obtain grids for each zoom level, increasing the number of more detailed map areas. This methodology was followed for six zoom levels, from the 4th to the 9th level. Each tile size is 256 × 256 pixels, which allows acceptable imaging rendering on the computer screen without excessive consumption of the device’s cache memory. Cache memory excess causes a very slow map display in Google Earth. The 4th zoom level has only 10 tiles; these raster images show the entire map area, while at the 9th level, 3391 tiles were needed. Therefore, larger integers correspond to greater levels of detail. shows the tile grid layout schema used to prepare the split imaging and exportation.
Figure 2. The 5th–7th zoom levels showing tile grids used to generate imaging of the Geological Map of South America 2019 in Google Earth.
Portable network graphics (PNG) was used as a graphic layout format. This type of file allows acceptable imaging compression and may include up to 16 million colors in red, green and blue (RGB) format for digital display. Consequently, it may be one of the best formats for preparing web images. In addition, the PNG image format stores pixels with transparency, which is very useful to represent GMSA information on the map up to the continental border.
Tile exportation was made by using the QGIS gdal2tiles tool of the GDAL library, which is freely available. The following methodology included defining tile profiles, determining zoom levels of representation and creating KML files for Google Earth display.
Careful searching for empty tiles was performed, file by file, and level by level. Empty tiles were removed as representative images without covering the map.
In addition, a Xtensible Style Languaje (XSL) template was prepared to be used on the ArcMap platform, coding the display and the format to show data as a Hyper Text Markup Language (HTML) file. Attributes for file exportation were defined, and pop-up windows designs in Google Earth were prepared.
To guarantee that the map chronolithostratigraphic units were interactive and could be visualized as pop-up windows showing unit attributes, they were exported as a layer in KML format.
A layer bearing 8599 polygons belonging to 292 chronolithostratigraphic units was exported as a KML file, showing white-colored borders and 99% transparency to hide it but allowing visibility with the mouse pointer in Google Earth, allowing activation of the pop-up window for each map unit.
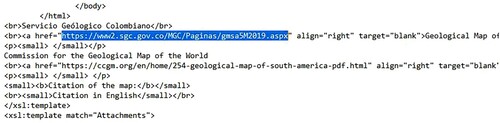
Additionally, updating of all Uniform Resource Locator (URL) files was performed in the XSL template of the SGC and CGMW in an attempt to guarantee that pop-up windows are redirected correctly to updated web pages ().
Similarly, a 418 volcanoes layer was exported as a KML file, together with an XLS template, to generate an HTML file, including attributes and pop-up windows design bearing all the features of that layer. The updating of the volcano URLs was also performed (those URLs belonging to different official geological institutions of the continent). The same methodology was followed for kimberlites, high-pressure metamorphic rocks, alkaline intrusions, alkaline volcanic rocks and impact craters. Users can find additional information and, as Wang et al. (Citation2022) mentioned, users are being able to control what and when to use that information according to their interest.
Finally, a single KML file was compiled for the GMSA display by integrating the following files: chronolithostratigraphic units, Galápagos Islands, oceanic crust, volcanoes, kimberlites, high-pressure metamorphic rocks, alkaline intrusions, alkaline volcanic rocks and impact craters layers. In the XSL script template, four parameters were defined to display the image layers according to resolution and taking into account the pixel sizes of all of those parameters. Similarly, XSL script templates were generated for images of the 9th zoom level with 60% transparency.
3. Results
Images were exported by using QGIS and contained 4640 tiles. The 4th zoom level is composed of 10 images, 5th level by 24, 6th level by 74, 7th level by 244, 8th level by 897 and 9th level by 3391. In addition, 34 tiles represent the Galápagos Islands, and 8685 tiles represent the oceanic crust layer shown on the map.
Single images are square-shaped and 256 × 256 pixels in size, which improves in detail by increasing the number of images as the zoom level increases, preserving high resolution, as shown in . The resolution of each image is 72 dpi.
Figure 3. Example of tiles obtained by using QGIS.
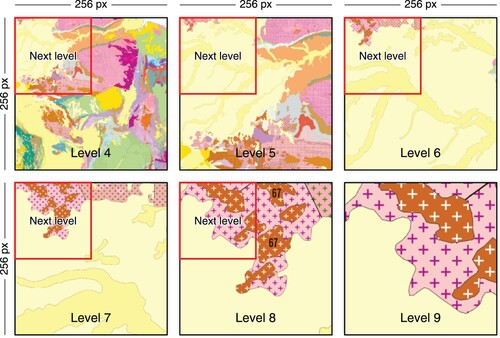
Figure 4. Xtensible Style Languaje script template fragment with updated URLs.
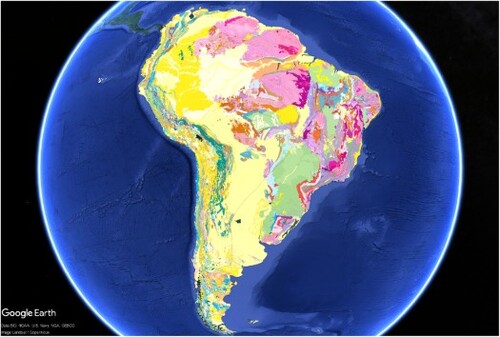
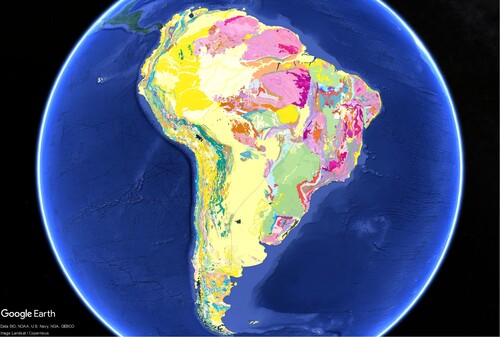
After obtaining the KML files exported from QGIS, these files were compiled together with the GMSA image KML file. As a result, a single compiled file was created to be displayed on Google Earth. This single file allows users to navigate around continental geology at the 1:5 M scale, showing map attributes. The map was carefully harmonized with the South American morphology; therefore, 3D views allow users to figure out how units are related to geographic features of the continent. The final map is shown in , main map.
Figure 5. Geological map of South America 2019 displayed in Google Earth.
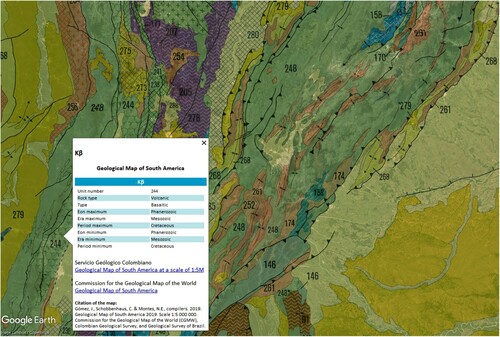
Preservation of geological units’ symbology was critical to distinguish chronolithostratigraphic units in the continental area. Likewise, a layer having 99% of transparency, almost not distinguishable, allows us to display pop-up windows and gives attributes information such as rock type and age. shows an example of a map view with a pop-up window showing unit attributes. In addition, map symbology shows the spatial distribution of units; in this way, users can easily distinguish units. Line features on the map, such as faults, synclines, anticlines, among others, together with features labels and symbols, are integrated into the raster images.
Figure 6. View of the geological map of South America 2019 in Google Earth showing an example of a pop-up window with a Cretaceous volcanic rock information.
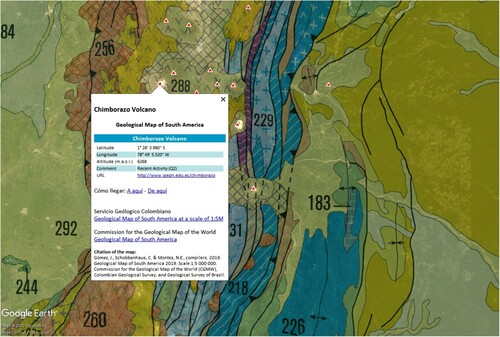
Volcano layers have their own location symbol that makes them easy to find and perform fast finds. Additionally, each pop-up window display shows the following attributes: name, geographic location, elevation (masl) and updated URLs, where additional information is available, as shown in . Each volcano has its own URL where more detailed information can be found.
The GMSA in KML format and a short video about how the GMSA in Google Earth are freely available for down loading at: https://www2.sgc.gov.co/MGC/Paginas/gmsa_google_earth.aspx
Figure 7. Map view of the Geological Map of South America 2019 in Google Earth and displayed pop-up window that shows information about the Ecuadorian Chimborazo volcano, as an example.
4. Conclusions
The GMSA displayed in Google Earth improves user access by offering a friendly, widely used and free access software that allows visualizing maps at the continental scale. It has become a valuable tool for users interested in knowing which and how geological materials and structures are distributed around South America, including special structures such as volcanoes, kimberlites, high-pressure metamorphic rocks, alkaline intrusions, alkaline volcanic rocks and impact craters.
The methodology followed to prepare the GMSA in Google Earth as a KML format is described in this paper. The main innovations of this product are the exported raster images that preserve the view of attributes such as symbology, lines and labels, together with an almost undistinguishable layer that allows pop-up windows to be shown. All these characteristics contribute to easy and versatile navigation around the continental geology of South America, even by non-expert users.
Periodical updating of the GMSA and the easy-to-update KML format makes it simple to include current and future knowledge. Additionally, navigability by using updated links redirecting users to web pages bearing additional information at the SGC and CGMW contributes to the aforementioned benefits.
Finally, we would like to point out that our main contribution is sharing with readers the methodology to use KML files to display geological maps, all of which may be used and improved by other map developers.
Data deposition
The GMSA in Google Earth can be downloaded from: https://www2.sgc.gov.co/MGC/Paginas/gmsa_google_earth.aspx
Acknowledgements
We are grateful to the Colombian Government and the General Director of the SGC, Oscar Paredes Zapata, who continuously supported the development of the Geological Map of South America 2019 and subsequent products, such as the Google Earth version. Additionally, we acknowledge reviewers Dr Monica Pondrelli and Ning Wang who helped to improve this manuscript, the KML file and to create a video showing the mean content of the GMSA in Google Earth.
Disclosure statement
No potential conflict of interest was reported by the author(s).
Data availability statement
There is no a data set associated with this paper included in any persistent identifier.
Software
We used Google Earth Pro, Qgis and ArcMap 10.3 software in order to prepare the GMSA in Google Earth. Licenced ArcMAP 10.3 srvlicarcgis.sgc.gov.co own by the Colombian Geological Survey.
Correction Statement
This article has been corrected with minor changes. These changes do not impact the academic content of the article.
Additional information
Funding
References
- Bouysse, P. (2014). Geological Map of the World. Scale 1:35 000 000. Commission for the Geological Map of the World. 1 sheet.
- De Paor, D. G., Dordevic, M. M., Karabinos, P., Burgin, S., Coba, F., & Whitmeyer, S. J. (2017). Exploring the reasons for the seasons using Google Earth, 3D models, and plots. International Journal of Digital Earth, 10(6), 582–603. https://doi.org/10.1080/17538947.2016.1239770
- Dearman, W., Dobbs, M., Culshaw, M., Northmore, K., Entwisle, D., & Reeves, H. compilers. (2011). Engineering geology (Bedrock) map of the United Kingdom. Scale 1:1 000 000. British Geological Survey, 1 sheet.
- Garrity, C. P., & Soller, D. R. (2009). DNAG geologic Map of North America GIS implementation: Overview and progress. U.S. Geological Survey, 133–136. https://ngmdb.usgs.gov/gmna/meta_and_manu/gmnaDatabaseDesign.pdf
- Gómez, J., Montes, N. E., Almanza, M., Alcárcel, F., Madrid, C., & Diederix, H. (2017). Geological map of Colombia 2015. Episodes, 40(3), 201–212. https://doi.org/10.18814/epiiugs/2017/v40i3/017023
- Gómez, J., Montes, N. E., Nivia, A., & Diederix, H. (2015). Mapa Geológico de Colombia 2015. Scale 1:1 000 000. Servicio Geológico Colombiano, 2 sheets. Bogotá, Colombia. https://doi.org/10.32685/10.143.2015.935
- Gómez, J., Schobbenhaus, C., & Montes, N.E.. (2019). Geological Map of South America 2019. Scale 1:5 000 000. Commission for the Geological Map of the World (CGMW), Servicio Geológico Colombiano and Serviço Geológico do Brasil. Paris, France. https://doi.org/10.32685/10.143.2019.929
- Liang, J., Gong, J., & Li, W. (2018). Applications and impacts of Google Earth: A decadal review (2006–2016). ISPRS Journal of Photogrammetry and Remote Sensing, 146, 91–107. https://doi.org/10.1016/j.isprsjprs.2018.08.019
- Reed, J. C. Jr., Wheeler, J. O., & Tucholke, B. E. (2005). Geologic map of North America: Decade of North American geology continental. Scale 1:5 000 000. Geological Society of America, 1–27. https://doi.org/10.1130/DNAG-CSMS-v1.
- Tewksbury, B. J., Dokmak, A. A. K., Tarabees, E. A., & Mansour, A. S. (2012). Google Earth and geologic research in remote regions of the developing world: An example from the Western Desert of Egypt. The Geological Society of America, Special Paper 492. https://doi.org/10.1130/2012.2492(02)
- Wang, N., Stern, R. J., Urquhart, M. L., & Seals, K. M. (2022). Google earth geoscience video library (GEGVL): Organizing geoscience videos in a google earth environment to support fieldwork teaching methodology in earth science. Geoscience, 12(6), 250. https://doi.org/10.3390/geosciences12060250.
- Whitmeyer, S. J., & Dordevic, M. (2021). Creating virtual geologic mapping exercises in a changing world. Geosphere, 17(1), 226–243. https://doi.org/10.1130/GES02308.1