
 ?Mathematical formulae have been encoded as MathML and are displayed in this HTML version using MathJax in order to improve their display. Uncheck the box to turn MathJax off. This feature requires Javascript. Click on a formula to zoom.
ABSTRACT
Satellite remote sensing has been widely utilized for petroleum detection offshore since oil spill is normally widespread. However, the onshore hydrocarbon detection is insufficient because the lower spectral resolution of previous satellites made it difficult to identify small scales of seepages. In this study, a dataset of the High-Resolution 5 satellite (GF-5) of China was chosen to directly detect hydrocarbon seeps in the Karamay area. First, an IDL program was used to remove the vertical tripe noise of the image to ensure the high quality of the image. Second, use principal component analysis (PCA) was combined with the classification and regression trees (CART) method RuleGen to process the image. The detected hydrocarbon information was enhanced by RGB color synthesis. The results show that the methods can detect hydrocarbon effectively. Field verification results show that the accuracy is 86.5%. This study provides an effective method for hydrocarbon detection using GF-5 data.
1. Introduction
The characteristic spectral absorption peaks of hydrocarbons are located at 1200, 1730, 2330 and 2350 nm due to the vibration of –CH2– in hydrocarbon (Asadzadeh & Filho, Citation2017; CitationVan der Meer et al., 2002). Taking advantage of these absorption features, remote sensing has been widely used for direct detection and contamination monitoring of offshore oil and gas seepages. Because the oil spill is normally widespread no other substances interfere (Clark et al., Citation2010; Lammoglia & Filho, Citation2011). However, the onshore direct detection was usually problematic since the oil seeps are commonly small scales and the present spectral sensors are of low resolution (Asadzadeh & Filho, Citation2017; Chen & Hu, Citation2014; Mu et al., Citation2020; Yang et al., Citation2000). Therefore, numerous indirect methods focusing on surface-relevant anomalous minerals or biological interaction with oils, such as hydrocarbon haloes, carbonate mineralization, clay mineral accumulation, reduction of ferric iron and increased reflectance of plants, are used for onshore hydrocarbon detection (Yang et al., Citation2000). The issue is that the above features can also be formed via processes that are unrelated to oil seepages and may lead to false positives during hydrocarbon detection. In recent years, with the development of hyperspectral technology, principally the airborne hyperspectral, provided effective tools for direct oil exploration and monitoring on land (Hörig et al., Citation2001; Moreira Scafutto et al., Citation2017), while satellite hyperspectral applications were relatively lacking. Fortunately, the High-Resolution 5 satellite (GF-5) of China gave an opportunity for such an application.
In this study, a scene image of the GF-5 was obtained for hydrocarbon detection in the Karamay area, NW China. In this region, numerous oil seeps, oil contamination-related sands, soils, and bitumen distribute around a nature tar hill called ‘Black Oil Hill’ which gave a good opportunity for the direct detection of hydrocarbons. Through image processing methods, such as preprocessing, principal component analysis (PCA) and classification and regression tree (CART) methods, hydrocarbon leakage information was successfully identified (Main Map). The results have implications for the first direct petroleum detection using hyperspectral data of GF-5. It is of guiding significance to use the massive GF-5 data to monitor the temporal and spatial variation of oil and gas leakage in the future. It also has important environmental monitoring implications since the onshore hydrocarbon, such as the methane, is a huge source of greenhouse gas (Etiope, Citation2015; Etiope & Klusman, Citation2010; Shikwambana & Kganyago, Citation2020).
2. Background
2.1. Regional geology
The Karamay region is located in the western margin of the Junggar Basin, NW China, with Zaire, Hala’alat and other mountains as the basin boundary ((a–c)). In these mountains, plentiful diachronous volcano-sedimentary strata and granite intrusions are exposed (Zong et al., Citation2016).
Figure 1. Geological and petroleum reservoir distribution maps of the Karamay region. (a) Geological map of the Karamay region (Jianping et al., Citation2016; Qiu et al., Citation2015). (b) The geographical location of the Karamay region. (c) Distribution of oil and gas reservoirs (Jianping et al., Citation2016). (d) The geological profile shows the cause of oil leakage (profile line is shown in (c): A–A′) (modified after Du, Citation2005). K-Q: Cretaceous-Quaternary, J: Jurassic, T: Triassic, P2w: Late Permian Urho Formation, P2x: Late Permian Xiazijie Formation, P1f: Early Permian Fengcheng Formation, P1j: Early Permian Jiamuhe Formation, C: Carboniferous.
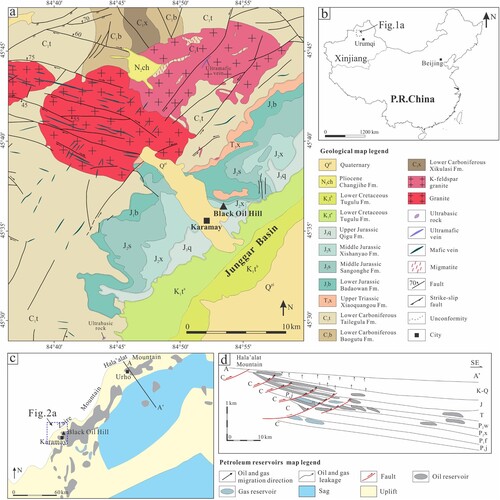
In the Karamay region, magmatic events predominantly occurred during the Early Carboniferous, Late Carboniferous, and Silurian-Devonian. The sedimentary strata mainly include the Upper Triassic to Lower Cretaceous fluvial-lacustrine sediments ((a)). From the bottom to top, the strata are sandstones, sandy mudstones and interlayered with conglomerates in the Upper Triassic Xiaoquangou Formation (T3x); the Lower Jurassic Badaowan Formation (J1b) mudstones, sandstones and conglomerates; the Middle Jurassic Sangonghe (J2s) sandstones interbedded with mudstones and conglomerates; the Xishanyao (J2x) Formations sandstones interbedded with shale and coal; the Upper Jurassic Qigu Formation (J3q) sandstones, mudstones and conglomerates; and the Lower Cretaceous Tugulu Formation (K1t) sandstones, mudstones interlayered with gypsum and calcareous concretions ((a)) (Jianping et al., Citation2016; Qiu et al., Citation2015). The major oil reservoirs were developed in the T3x, J1b, and J3q. The oil accumulations are shallowly buried (200–500 m deep, (d)) (Jianping et al., Citation2016). Hydrocarbons escaped from the trap easily along the fault system to the shallower layer and then traveled through the shallow geological structure to the surface ((d)) (Du, Citation2005; Qiu et al., Citation2019).
2.2. Oil seeps around the black oil hill
The Black Oil Hill is located in the NE of Karamay city, where hydrocarbon seeps can be observed in high spatial resolution images ((a,b)). Sandstones and conglomerates are commonly exposed around Black Oil Hill. When oil seeps leaked into these rocks, oil contaminations were formed, such as oil stain and oil pool ((c,d)).
Figure 2. Image and photographs of typical targets in Karamay city and Black Oill Hill. (a) GF-5 satellite true color image of Karamay city. (b) Google Earth image showing artificial playgrounds. (c) and (d) Photos of surface hydrocarbon leakages around Black Oil Hill. (e) Google Earth image showing a gravel plant. (f) Spectral profiles of the main surface materials collected from GF-5 image (points positions are shown in a).
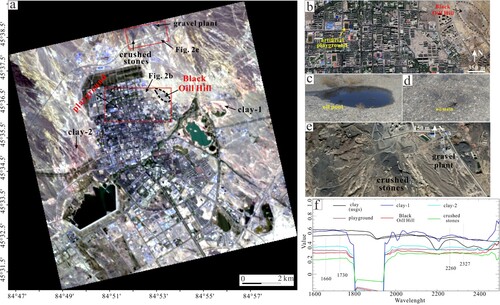
In urban areas, many artificial playgrounds, produced by petroleum products, can be used to test the accuracy of hydrocarbon identification ((b)). Other substances that may interfere with identification results include some black crushed stones in a gravel plant to the north ((e)), and widely distributed clay rocks ((a)). The spectra of these substances and the Black Oill Hill were collected from the GF-5 satellite images ((a)) and are shown in (f).
3. Method
The hyperspectral camera carried by GF-5 can obtain spectra from 400 to 2500 nm, 330 spectral color channels, a width of 60 km, and a spatial resolution of 30 m. The visible spectrum resolution is 5 nm and the short-wave infrared spectrum resolution is 10 nm (Liu et al., Citation2020). We have used hyperspectral image recognition and field verification to establish the relationship between hydrocarbon seeps and hyperspectral images in the Karamay region. The processing of hyperspectral images is described in the following sections.
3.1. Preprocessing of GF-5 image
One scene image of the Karamay area (the center coordinates are 45°38′53.3″N, 84°49′6.4″E), captured in September 2019, was used to detect onshore hydrocarbon. A subset image was selected to extract hydrocarbon information from the original image ((a)). The pretreatments included radiometric calibration, atmospheric correction, stripe noises removal and orthorectification. The radiometric calibration, atmospheric correction and orthorectification were done on ENVI + IDL (version 5.3) software (Harris Geospatial Solutions, Inc., Broomfield, CO, USA). The stripe noise removal was carried out by the full image stripe noise removal method (Tan et al., Citation2005). The calculation formula of this method is
where is the radiation value of the i column and j line in the K band;
is the corrected radiation value; the
is the mean value of the K band, i column;
is the standard deviation of the K band, i column;
is the mean value of the K band, i column of the reference image;
is the standard deviation of the K band, the i column of the reference image. The
is the sensor gain and the
is the offset;
is the mean value of the whole image in the K band;
is the mean standard deviation of the whole image in the K band.
In this study, replace the mean value and standard deviation of the reference image with the mean value and standard deviation of the whole image, respectively. Using the IDL language, this method was written into the following program:
pro test
;input parameter
infile = 'C:\Tempwork\Karamay\karamay_subset.dat’; image input path.
outfile = 'C:\Tempwork\Karamay\2.dat’; image output path.
xs = 1500; image column number.
ys = 1500; image line number.
bs = 324; image band number.
;input parameter
img = fltarr (xs,ys,bs)
readu,1,img
close, 1
for n = 0,bs-1 do begin
mm = mean(img[*,*,n] *1.0); mean value of the reference image.
ss = stddev(img[*,*,n] *1.0); standard deviation of the reference image.
m = fltarr(xs)
s = fltarr(xs)
a = fltarr(xs)
b = fltarr(xs)
for i = 0,xs-1 do begin
m[i] = mean(img[i,*,n] *1.0); mean value of the i column.
s[i] = stddev(img[i,*,n] *1.0); standard deviation of the i column.
A[i] = ss/s[i]; sensor gain in the i column.
B[i] = mm-A[i]*m[i]; offset in the i column.
for j = 0,ys-1 do begin
img[i,j,n] = round (A[i]*IMG[i,j,n] *1.0 + B[i]); calculate the corrected radiation value.
endfor
endfor
endfor
openw,1,outfile
writeu,1,img
close,1
end
; Program notes.
3.2. Hydrocarbon detection
The principal component analysis (PCA) and the classification and regression trees (CART) method RuleGen were used for hydrocarbon detection. The PCA can generate a spectral image of lower dimension and clearer characteristics through the recombination of data from various selected spectral bands (Xu & Zhao, Citation2015). In this study, two absorption bands at, 1730 and 2327, and two reflectance bands at 1660 and 2260 nm were used for PCA to obtain hydrocarbon information. Subsequently, the classification and regression trees (CART) method RuleGen were used to eliminate the effects of interfering substances (Loh & Shih, Citation1997). The hydrocarbon leakage result was synthesized into a false color image to highlight the identified hydrocarbon leakage areas. Finally, filed verification work was carried out, including hydrocarbon leakage areas and non-leakage areas, to achieve quantitative accuracy and analyze possible interference factors.
4 Results
4.1. Stripe noise removal result
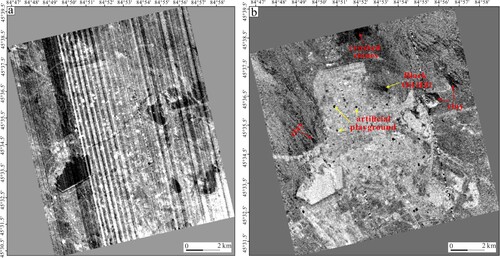
Since the hyperspectral sensor is a push-sweep imager, calibration of tens of thousands of detection elements on array CCD devices is very difficult that made hyperspectral images have many vertical stripe noises, especially in SWIR bands (Tan et al., Citation2005). As shown in (a), the result of PCA without stripe noise removal has obviously dense alternating light and shade vertical stripes, which will seriously degrade the image quality. Through the stripe noise removal by the IDL program, noise has been greatly reduced after PCA, and the ground features were well preserved ((b)).
Figure 3. PCA results of non-stripe noise removal (a) and stripe noise removal (b).
4.2. PCA result
The PCA result contains four components (pc Band 1∼pc Band 4), of which the third component highlighted the hydrocarbon information ((b)). The result of the PCA presented obviously black areas of the Black Oill Hill and artificial playgrounds in urban. The artificial playgrounds have a regular shape, which was produced by hydrocarbon products, indicating that the band combination of 1660, 1730, 2260 and 2327 nm is valid for hydrocarbon identification ((b)). However, some distractors still appear as black areas located to the east, west and north of the city ((b)). To the north, crushed stones stacked in a gravel plant represented black areas. To the east and west, large areas appear black areas after PCA but show white or dark-red in natural color, as shown in (a).
4.3. CART result and the final detection result
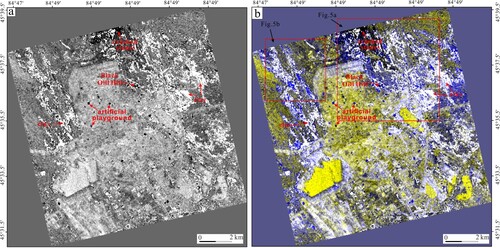
The CART is a decision tree plugin developed based on the ENVI. The predictor variables can be either discrete variables (CRUISE and QUEST algorithms) or continuous variables (GUIDE algorithm) (Loh & Shih, Citation1997). In this study, we chose the QUEST algorithm for the classification of decisions. In (a), spectral information on clay rocks and crushed stones is counted standard spectral libraries are built to extract these interfering substances. Then created interferent masks and extracted the corresponding interferents in the PCA result to ensure that only hydrocarbons were reflected.
(a) is the detection result of the hydrocarbon seepage. The result eliminates the interference of clay which was masked out and shown as white areas. And information on hydrocarbon in Black Oill Hill and artificial playgrounds is shown as black areas. In the result, part of the crushed stones is still unidentified ((a)). To highlight the detection result, we performed RGB color synthesis of the image (R: pc Band 3, G: pc Band 3, and B: pc Band 2) to obtain a false color image. In the false-color image, oil and gas leaks and artificial plastic fields are shown in blue, clay fields are shown in white, crushed stones remain black, and other features are shown in yellow ((b)). In general, the hydrocarbon seep information is better displayed on the false-color image.
Figure 4. The final detection result of hydrocarbon seep. (a) Detection result after the CART method. (b) False color image of the detection result. The blue areas show oil and gas leakage.
4.4. Field verification
To quantitatively evaluate the detection results, field verification work has been carried out. Totally 37 points were verified in the field distributing around the Black Oil Hill to the northeast of the city, and the area of uplifting strata to the northwest (). The verification results of 32 points are consistent with the detection results, and the results of the other 5 points were inconsistent with the detection results (see supplementary materials ). The verification results show that oil pool, oil stain, dry asphaltene, and oil shale on the surface can be detected ((a–d)). Some white clay bed was well identified, but darker clay bed was identified as oil seep ((e,f)). Some dry oil sands containing gravel are not detected ((g,h)). Dark gravelly soil and brown sand were falsely identified as oil seeps ((i,j)). In general, the detection accuracy is 86.5%.
Figure 5. Field verification areas and points of the hydrocarbon detection. (a) and (b) False-color images showing the location of the verification points. (c) and (d) Google Earth images of the verification areas. The location of the field verification area is shown in .
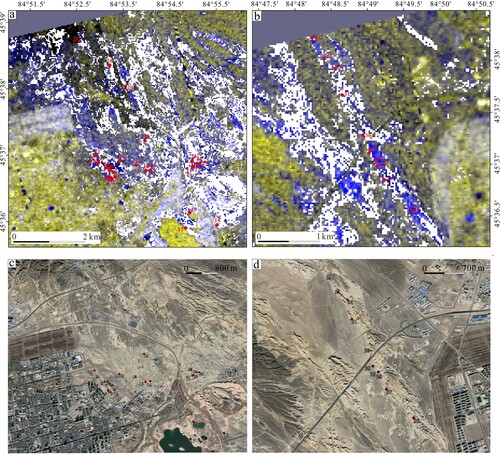
Figure 6. Photos of partial field verification point of oil and gas leakage.
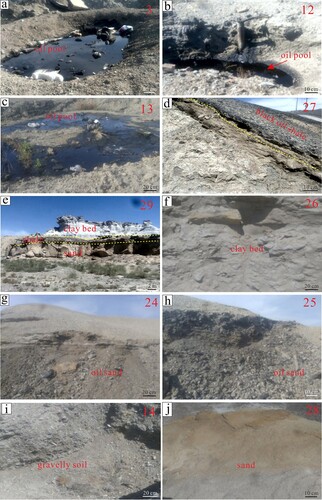
Table 1. Results of field verification of oil and gas leakage.
5 Discussion
In the field of oil and gas detection using remote sensing images, clay rock is a factor that interferes greatly with the detection results. The clay rocks may be deposited or formed by the secondary reduction of oil and gas. In the Karamay region, hydrocarbon leakage is commonly distributed, which may lead to a richer distribution of surface clay (Wang et al., Citation2014; Zhang et al., Citation2005). Because clay rocks have strong characteristic absorption peaks at 2200 and 2350 nm, overlap with the absorption peaks of hydrocarbons in these bands, which can interfere with oil and gas detection ((f)) (D'Arcy et al., Citation2018; Huang et al., Citation2017). Through the PCA and CART methods, the GF-5 hyperspectral image can remove most of the interference of clay rocks and directly detect hydrocarbon seeps. From the detection result, the oil seeps in Black Oil Hill and plastic playgrounds in urban have been well identified (). The oil pools, some soil oil, and dry asphalt can also be effectively identified. And some white clay beds without oil can also be correctly identified. However, there are still some points that are not correctly identified. As shown in (f,i and j), there were no obvious oil seep can be seen on the surface, but it was identified as hydrocarbon leakage. Probably because these rocks contain trace amounts of hydrocarbons that are invisible to the naked eye. In (g,h), the black oil sands fail to detect oil seep. We speculate that it may be because the oil sands are in coarse-grained rock strata, which may contain more water because of the large porosity. Water absorbs spectral information, leading to inaccurate identification.
Traditional methods for monitoring hydrocarbons in soil include a gas chromatographic method, mass spectrometry, liquid chromatography and solid phase microextraction (Chen et al., Citation2017). These methods require a large number of soil samples to be collected for analysis and are expensive, making it impossible to monitor oil and gas leakage over a large area. In addition, the leakage of oil and gas in the process of pipeline transportation cannot be located by traditional methods. By contrast, the hyperspectral satellite image data acquisition period is fast, the area is large, and can realize the rapid monitoring of a large range of oil and gas leakage. Therefore, this study is of guiding significance for using hyperspectral satellite data for oil and gas exploration and environmental protection.
6 Conclusions
Through the method of full image stripe noise removal by the IDL program, the vertical stripe noises of GF-5 image can be effectively removed, which is conducive for subsequent research. The principal component analysis, combined with classification and regression tree processing of high-resolution remote sensing satellite data, is an effective method to identify hydrocarbon information. The detection accuracy is 86.5%.
Software
ENVI + IDL (version 5.3) was used to process GF-5 data, and ArcGIS 10.3 and CorelDraw X8 were used to create and modify images and maps, respectively.
Supplemental Material
Download Zip (1.8 MB)Acknowledgments
The authors would like to thank Dr Liang Qiu and Dr Wen-Xin Yang for their constructive comments on the manuscript.
Data availability statement
The data that support the findings of this study are available from the corresponding author upon reasonable request.
Disclosure statement
No potential conflict of interest was reported by the author(s).
Additional information
Funding
References
- Asadzadeh, S., & Filho, C. R. D. S. (2017). Spectral remote sensing for onshore seepage characterization: A critical overview. Earth-Science Reviews, 168, 48–72. https://doi.org/10.1016/j.earscirev.2017.03.004
- Chen, S., & Hu, C. (2014). In search of oil seeps in the cariaco basin using modis and meris medium-resolution data. Remote Sensing Letters, 5(4–6), 442–450. https://doi.org/10.1080/2150704X.2014.917218
- Chen, Z. L., Yin, W. Y., Liu, H. T., Liu, Q., & Yang, Y. (2017). Review of monitoring petroleum-hydrocarbon contaminated soils with visible and near-infrared spectroscopy. Spectroscopy, and Spectral Analysis, 37(6), 1723–1727. https://doi.org/10.3964/j.issn.1000-0593(2017)06-1723-05.
- Clark, R. N., Swayze, G. A., Leifer, I., Livo, K. E., Kokaly, R., Hoefen, T., & Sarture, C. (2010). A method for quantitative mapping of thick Oil spills using imaging spectroscopy. US Geological Survey OpenFile Report, 1167, 1–51.
- D'Arcy, M., Mason, P. J., Roda-Boluda, D. C., Whittaker, A. C., Lewis, J. M., & Najorka, J. (2018). Alluvial fan surface ages recorded by landsat-8 imagery in Owens Valley, California. Remote Sensing of Environment, 216, 401–414. https://doi.org/10.1016/j.rse.2018.07.013
- Du, S. K. (2005). Research on the foreland thrust belt and on the accumulation of petroleum in the north-western margin of the Junggar Basin, China (in Chinese with English abstract). [PhD dissertation]. Chinese Academy of Sciences.
- Etiope, G. (2015). Natural Gas seepage: The earth’s hydrocarbon degassing. Springer International Publishing.
- Etiope, G., & Klusman, R. W. (2010). Microseepage in drylands: Flux and implications in the global atmospheric source/sink budget of methane. Global and Planetary Change, 72(4), 265–274. https://doi.org/10.1016/j.gloplacha.2010.01.002
- Hörig, B., Kühn, F., Oschütz, F., & Lehmann, F. (2001). Hymap hyperspectral remote sensing to detect hydrocarbons. International Journal of Remote Sensing, 22(8), 1413–1422. https://doi.org/10.1080/01431160120909
- Huang, Y. R., Guo, N., Zheng, L., Yang, Z. Y., & Fu, Y. (2017). 3D geological alteration mapping based on remote sensing and shortwave infrared technology: A case study of the sinongduo low-sulfidation epithermal deposit. Acta Geoscientica Sinica, 38(5), 779–789. https://doi.org/10.3975/cagsb.2017.05.17
- Jianping, C., Xulong, W., Chunping, D., Digang, L., Yueqian, Z., Zhe, Z., & Yutao, W. (2016). Quantitative geoscience and geological Big data development: A review. Acta Geologica Sinica - English Edition, 90(4), 1490–1515. https://doi.org/10.1111/1755-6724.12782
- Lammoglia, T., & Filho, C. R. D. S. (2011). Spectroscopic characterization of oils yielded from Brazilian offshore basins: Potential applications of remote sensing. Remote Sensing of Environment, 115(10), 2525–2535. https://doi.org/10.1016/j.rse.2011.04.038
- Liu, Y., Sun, D., Hu, X., Liu, S., Cao, K., Chai, M., Liao, Q., Zuo, Z., Hao, Z., & Duan, W. (2020). Development of visible and short-wave infrared hyperspectral imager onboard GaoFen-5 satellite. Journal of Remote Sensing, 24(4), 333–344. https://doi.org/10.11834/jrs.20209196
- Loh, W. Y., & Shih, Y. S. (1997). Split selection methods for classification trees. Statistica Sinica, 7(4), 815–840.
- Moreira Scafutto, R. D., Roberto, D., & De Oliveira, W. J. (2017). Hyperspectral remote sensing detection of petroleum hydrocarbons in mixtures with mineral substrates: Implications for onshore exploration and monitoring. ISPRS Journal of Photogrammetry and Remote Sensing, 128(7), 146–157. https://doi.org/10.1016/j.isprsjprs.2017.03.009
- Mu, H. X., Qiu, L., Yan, D. P., Kong, R. Y., Yang, W. X., Gong, L. X., & Sun, P. K. (2020). Spectral characteristics of hydrocarbon-bearing materials in Karamay, northwest China: Implications for remote detection of onshore oil seeps. Spectroscopy Letters, 53(7), 543–558. https://doi.org/10.1080/00387010.2020.1792504
- Qiu, J. T., Qiu, L., Mu, H. X., Yang, W. X., Chen, F., Yan, B. K., Yu, J. C., & Yang, H. M. (2019). Geosites in Karamay city, Xinjiang Uygur autonomous region, northwest China. Geoheritage, 11(3), 1027–1042. https://doi.org/10.1007/s12371-019-00346-5
- Qiu, J. T., Zhang, C., & Hu, X. (2015). Integration of concentration-area fractal modeling and spectral angle mapper for ferric iron alteration mapping and uranium exploration in the Xiemisitan area, NW China. Remote Sensing, 7(10), 13878–13894. https://doi.org/10.3390/rs71013878
- Shikwambana, L., & Kganyago, M. (2020). Trends in atmospheric pollutants from oil refinery processes: A case study over the United Arab Emirates. Remote Sensing Letters, 11(6), 590–597. https://doi.org/10.1080/2150704X.2020.1746856
- Tan, B., Li, Z., Chen, E., & Pang, Y. (2005). Preprocessing of EO-1 hyperion hyperspectral data. Remote Sensing Information, 20(6), 36–41. https://doi.org/10.3969/j.issn.1000-3177.2005.06.010.
- Van der Meer, F., Van Dijk, P., Van Der Werff, H., & Yang, H. (2002). Remote sensing and petroleum seepage: A review and case study. Terra Nova, 14(1), 1–17. https://doi.org/10.1046/j.1365-3121.2002.00390.x
- Wang, M., Wu, C., Wang, L., Fang, Y., Li, L., Chen, R., & Zhang, C. (2014). Jurassic clay mineral assambleges in mudstones and geochemical characteristics in the southern part of Junggar Basin. Bulletin of Mineralogy, Petrology and Geochemistry, 33(4), 421–430. https://doi.org/10.3969/j.issn.1007-2802.2014.04.002.
- Xu, X., & Zhao, Y. A. (2015). A band math-ROC operation for early differentiation between Sclerotinia sclerotiorum and Botrytis cinerea in oilseed rape. Computers and Electronics in Agriculture, 118, 116–123. https://doi.org/10.1016/j.compag.2015.08.022
- Yang, H., Meer, F. V. D., Zhang, J., & Kroonenberg, S. B. (2000). Direct detection of onshore hydrocarbon microseepages by remote sensing techniques. Remote Sensing Reviews, 18(1), 1–18. https://doi.org/10.1080/02757250009532381
- Zhang, L. Q., Luo, X. R., Liu, L., He, D. F., & Xiang, B. L. (2005). Controls on clay mineral distribution in the Cenozoic sediments of the southern Junggar Basin, NW China. Chinese Journal of Geology, 40(3), 363–375. https://doi.org/10.3321/j.issn:0563-5020.2005.03.006
- Zong, R., Wang, Z., Jiang, T., & Gong, Y. (2016). Late devonian radiolarian-bearing siliceous rocks from the Karamay ophiolitic mélange in western Junggar: Implications for the evolution of the Paleo-Asian Ocean. Palaeogeography, Palaeoclimatology, Palaeoecology, 448, 266–278. https://doi.org/10.1016/j.palaeo.2015.10.006