
ABSTRACT
Mobility functional areas are tools based on human mobility that can be useful for spatial and transport planning in delicate situations such as the COVID-19 pandemic. In this work, we aim to map functional areas in Spain from four days corresponding to different phases of the disease. For that goal, mobile phone data provided by Spanish Statistical National Institute (INE) has been used due to its value and potential to provide constantly updated information of mobility at almost-real time. The methodology consists of a network analysis over an origin-destination matrix to obtain modularity values for 3214 population cells provided by the INE. These values were then used to cluster the cells into functional areas. The results show how different confinement and mobility restriction policies influence the amount, size and shape of the functional areas, and therefore, they affect access to services or jobs.
1. Introduction
COVID-19 (SARS-CoV 2) pandemic has radically changed people's daily lives. The implementation of mobility restriction measures to contain the spread of the virus has greatly affected access to basic services in cities and daily activities such as commute to work. The use of both public and private transport modes has been limited, influencing in the connections between cities and the internal structure of regions.
The living space beyond the administrative limits is not always known. A precise delimitation of borders is necessary to increase the efficiency of public administrations without marginalizing the surrounding territories (CitationGabrielli et al., 2018). Mobility functional areas emerge as geographically highly interconnected zones that do not coincide with the established administrative borders, since they are designed through the observation of human activity during a time period such as travel-to-work trips. This concept is based on similar concept like commuting regions or functional regions, which are relevant tools for housing, transportation, employment, or other sectorial planning purposes (CitationIacus et al., 2022). They are strong tools for planning and policy implementation, since they can show the needs of the inhabitants in the use of transport or accessibility to services such as health establishments (CitationCasado-Diaz, 2000). The calculation of functional areas is useful to reinforce the estimation of the risk of a pandemic and provide more evidence to prepare contingency plans (CitationSo et al., 2020). Functional areas with the highest population can be isolated either if they have many cases of disease to prevent its spread, or if they do not have any cases in order to prevent the entry of the virus.
Since the beginning of the disease, geolocated technologies based on Big Data have been used to track the spread of the virus (CitationFrith & Saker, 2020; CitationPoom et al., 2020). This is possible thanks to the download of large samples of data with high spatial and temporal detail (CitationOsorio Arjona & García Palomares, 2020; CitationPoom et al., 2020). These new data sources open the possibility of exploring how people use space, especially for regions where data are scarce or not available (Lenormand et al., Citation2015). They are valuable as they provide information about the dynamic structure of cities and regions (CitationLouail et al., 2014). Mobile phone activity records or call data records (CDR) are one of the most used sources due to the possibility of obtaining constantly updated large amounts of data at different scales (CitationGutiérrez Puebla, 2018). CDR rata has been widely used to reveal patterns and trends in demographics and mobility over space and time during the COVID-19 pandemic (CitationHu et al., 2021). It has considerable potential to support actions and decisions regarding public health during any stage of the disease. The data can provide information on the spatial distribution of the population and show the consequences of implementing different measures to contain the pandemic in its different phases (CitationOliver et al., 2020).
The concept of functional areas has been widely used in urban geography, especially in cities. Traditionally, population censuses have been used to delimit the borders (CitationCasado-Diaz, 2000; CitationNovak et al., 2013). In last years, Big Data sources have replaced the censuses as the main data sources. Almost all the previous investigations found have used geolocated Big Data to create mobility functional areas on cities. The main technologies have been mobile phone data (CitationYang et al., 2016), geotagged social networks like Foursquare, Twitter or Weibo (CitationAssem et al., 2017; CitationChen et al., 2017; CitationGao et al., 2017), or public transport cards (CitationLong & Shen, 2015; CitationMaeda et al., 2019).
However, this field of investigation is scarce on a larger scale such as regional or national levels. The only works found by the authors have been those carried out by CitationGabrielli et al. (2018) in Italy using GPS data of vehicle trajectories, by CitationNovak et al. (2013) in Estonia using mobile phone data, and by CitationIacus et al. (2020) in several European countries including Spain and Austria using mobile phone data too. This last work, continued on CitationIacus et al. (2022), is the only one the authors found where mobility functional areas are applied to the COVID-19 pandemic case of study, and only during the period corresponding with spring of the year 2020.
In this work, we seek to use mobile phone data to map the mobility functional areas of Spain during four different phases of the COVID-19 pandemic and visualize changes in the structure affected by the different mobility casuistries. There are very few investigations that have used mobile phone data to generate functional areas at regional scale, so its application to a practical case such as their use to explain the evolution of a disease as in this is research topic is an original work only done priorly by CitationIacus et al. (2020). In addition, the evolution of a particular functional area (in this case, the one corresponding to the city of Seville) will be shown throughout the four phases of the pandemic with the aim of showing the dynamic nature of these zonings.
2. Area and period of study
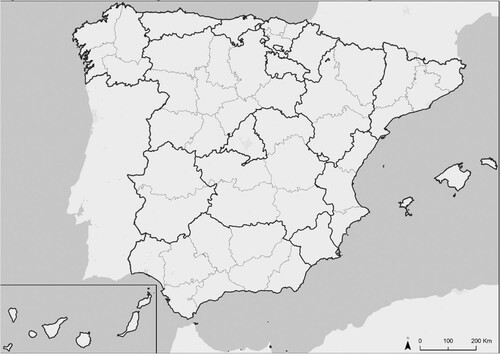
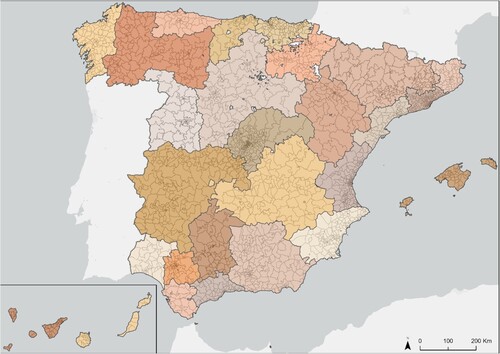
Spain is a suitable country for studies related to the effects of COVID-19 on mobility and demographics due to its large and rapid pandemic peak and the implementation of several confinement and mobility restriction policies throughout the alarm state (CitationPérez-Arnal et al., 2021). There are two main levels of territorial organization in Spain. The autonomous communities are territorial entities with their own institutions and certain legislative, executive and administrative powers. At a smaller level, provinces are the administrative division of the territory within an autonomous community (). These two scales of territorial organization are relevant to compare later the structure and size of the functional areas.
Figure 1. Territorial division of Spain based on autonomous communities and provinces. Source: Own elaboration.
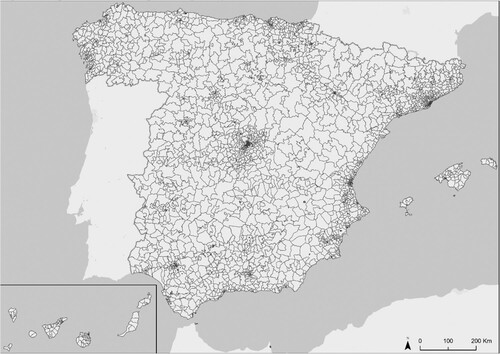
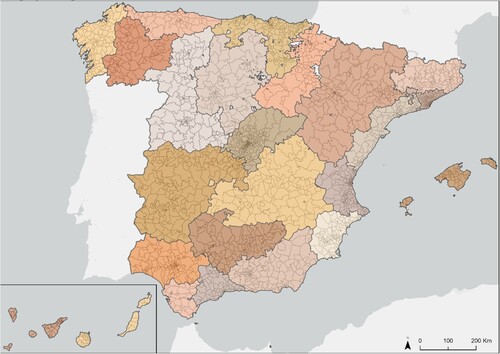
The spatial units used for this research consist of 3214 population cells designed by Spanish Statistics National Institute (INE). These cells have a population referring to January 1, 2020, and have been designed to have a homogeneous population that exceeds the threshold of 5000 registered inhabitants and does not exceed a threshold of 50,000 inhabitants. This methodology alleviates the limitation of spatial dependence of mobile phone records on phone antennas ().
Figure 2. Population cells for Spain designed by the INE. Source: Own elaboration based on INE data.
The temporary period corresponds to four working days that correspond to different periods of the pandemic:
April 15, 2020: corresponding to the first state of alarm, when the population of Spain was under quarantine and confinement measures, including travel restrictions and store closures.Footnote1 3,578,378 records were obtained.
August 19, 2020: day in which a considerable increase of mobility takes place annually due to summer holidays. The confinement at national level had already ended and it started a new stage named new normality, in which, although there were no longer mobility restrictions, preventive measures such as teleworking continued to be promoted. 38,163,485 phone records were obtained.
December 16, 2020: corresponding to the second state of alarm. Unlike the first state of alarm, the mobility restriction measures within each autonomous community were under the control of the different autonomous entities, causing different population and mobility patterns in the Spanish territory.Footnote2 38,430,905 records were obtained.
June 9, 2021: period after the second state of alarm, with a total lift of mobility restrictions. These dates are highlighted by the vaccination campaign against COVID-19 in Spain. At the beginning of June, the population over 50 years of age has already had access to the vaccine, which was beginning to be supplied to the rest of the age groups.Footnote3 39,819,645 phone records were obtained.
3. Data and methods
3.1. Data
This work has used mobile phone data collected from March 16, 2020, to December 29, 2021. This data is available on the Estadistica Experimental portal located in the INE website.Footnote4 These data come from the phone operators Movistar, Vodafone, and Orange. Data from foreign numbered phones operating in roaming have been excluded. The data form an Origin-Destination (OD) matrix where each record has a date, an origin cell identifier, a destination cell identifier, and a numerical value of mobile phones. These tables already have a first filter in which trip flows with less than 15 people detected have been omitted.
3.2. Calculation of the modularity value of population cells
The first step of the methodology was to perform a network analysis over the four tables in the free software Gephi (CitationBastian et al., 2009), with the goal to obtain the modularity values of each population cell during each of the four studied days. Modularity is an optimization performed on a network to detect and obtain an appropriate number of clusters (CitationFortunato & Barthélemy, 2007). Structurally, a functional area can be defined as the subgraph of a network where the nodes inside the subgraph are more tightly connected with each other than with the nodes outside it (CitationFortunato & Barthélemy, 2007). As result, the population cells that comprehend a functional area will share the same modularity value.
The modularity values were calculated using the algorithm of CitationBlondel et al. (2008), designed for relationally oriented networks. The value data used for this algorithm was the number of mobile phones in each OD trip from each of the four tables, which is not-weighted data. These values were approximate using a probability flow based a Markov process of random walks within the network. Then the cumulative probability of the information flow was used to obtain the nodes, which are clustered. The use of algorithms that don’t consider the directionality of the network were discarded, since they are not consistent with the nature of the information (the OD matrices are networks with directionality),
The method to set the best value of the modularity degree was to giving it a value of 1, which allows to break the territory of Spain into functional areas with the same probability independently from the area of the country. This degree is the same for the four days. However, it is not practical to do all possible iterations from nodes to clusters, so different heuristics were used. In Louvain's method for community detection, small communities were first found by locally optimizing all nodes, then each small community is associated with a node and the process is repeated until convergence is reached (CitationBlondel et al., 2008).
3.3. Building and mapping of functional areas
Once the modularity value of each cell was obtained, the data was exported in.csv format and joined to a vector layer in ArcGIS Pro using the population cell code as the join field. Next, the dissolve data tool was used to aggregate the cells into functional areas using the modularity class field. Then, the maps were designed using both the population cell layer and the obtained functional area layer as layout border. In order to better visualize the changes in mobility in Spain in each phase of the pandemic, we have tried to show each functional area with the same color in all the mapped time periods (Main Map).
4. Results
The obtained results indicate a proportionality between the number of functional areas mapped in Spain and the mobility recorded during each of the phases of the COVID-19 pandemic. During the first phase, characterized by the confinement of the Spanish population, 36 functional areas were registered in the country. With the end of the confinement measures and an increased mobility due to summer holidays, the number of functional areas detected during the second phase of the pandemic was reduced to 23. However, the third phase of the pandemic brought new mobility restriction measures, but this time at the regional level. In this situation, the number of functional areas increased to 27. Finally, with the vaccination campaign and the establishment of the new normality and, mobility increased again. Thus, 24 functional areas were mapped in June 2021. In resume, the reduction of mobility leads to the reduction of the length of the trips, and an increase of the number of functional areas.
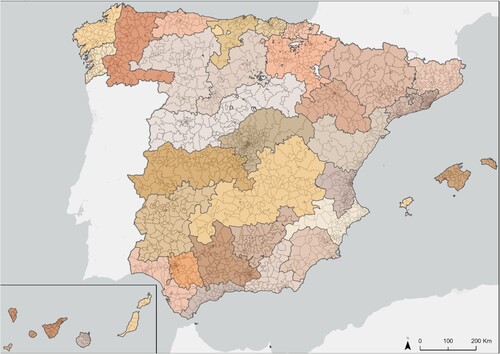
During the first state of alarm, the reduction in mobility has led to a greater number of smaller functional areas. Most of these functional areas are similar in size and shape to the province where they are located, especially in the coastal areas. The interior of the country, which has large functional areas in the rest of the periods (due to the lesser amount of population, which is also more dispersed in the territory, causing greater distance in trips), presents a great fragmentation during this first phase of the pandemic, which can be explained as a reduction of the usual long trips in these zones, remaining only internal mobility in cities and towns ().
Figure 3. Mobility functional areas visualized during the COVID-19 first state of alarm in Spain (April 15, 2020). Source: Own elaboration based on INE phone data.
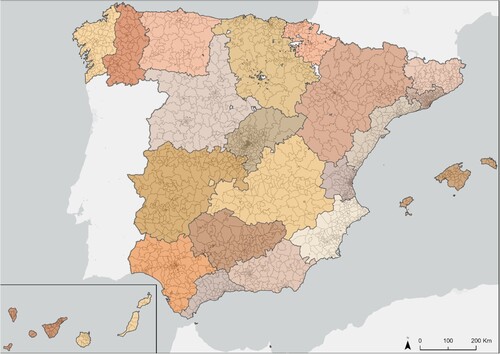
In contrast, during the summer of 2020, with the end of the mobility restriction measures and summer vacations, a reduced number of large functional areas can be seen, with a shape and size similar in many cases to the communities Autonomous of Spain. This size is striking mainly in the tourist regions of Andalusia and the areas of northern Spain, which have been the main receptors of touristic activity during that period. The touristic mobility (with longer trips to the beaches or mountainous areas in comparison with the local citizens mobility) and the development of public transit services can explain this situation ().
Figure 4. Mobility functional areas visualized during the ‘new normality’ phase alarm in Spain (August 19, 2020). Source: Own elaboration based on INE phone data.
The second state of alarm led to the establishment of restrictions at the regional level, which led to different mobility behaviors throughout the country. A reduced size is visualized at the province level, especially in Andalusia and in the coastal areas of the country. Meanwhile, the inland regions of Spain show large functional areas and a structure like that of the autonomous communities (). This situation can be explaining due to differences in mobility restrictions during that period (for example, mobility restrictions in Andalusia were harsher, forbidding trips between areas of the same autonomous community). Another interesting situation lies in northwest Spain (inland Galicia and the province of Leon). While these are two different autonomous communities, they share a similar structure (low, aging population in dispersed towns). While in the province of Leon, the population tends to travel to the capital city for work or other necessities, the reduction of mobility and dispersion of services forced the population to travel to hospitals and other services located in Galicia, which are located at a shorter distance than the ones ubicated in the city of Leon.
Figure 5. Mobility functional areas visualized during the COVID-19 s state of alarm in Spain (December 16, 2020). Source: Own elaboration based on INE phone data.
Finally, the functional areas registered in June 2021 are the ones that best fit a normal situation. The larger size of the functional area corresponding to Madrid stands out in contrast to the functional area of Barcelona, which has the smallest size in the entire peninsula due to its big population density. The functional areas in the interior of the country tend to be larger due to the lower population, the bigger dispersion of towns, the demographic gap and the less developed public transit services, so mobility flows are longer. Meanwhile, the coastal functional areas, have a bigger and younger population, which is concentrated. This demographic situation combined with the better development of public transit services leads to a shorter length of trips and a small size of the functional areas ().
Figure 6. Mobility functional areas visualized after the lifting of mobility restrictions (vaccination campaign) in Spain (June 9, 2021). Source: Own elaboration based on INE phone data.
summarizes the obtained results. The first studied period is the one that had a significantly lower number of mobile phone records in comparison with the other situations. This is caused due to the mobility restrictions in the entire country strongly influencing the number of mobile phone records generated. While the day corresponding with the second state of alarm period had a bigger amount of data than August 19, this can be explained due to a bigger amount of population traveling overseas during summer 2020. Comparing the number of mobile phone records with the number of functional areas and their characteristics, it can be deduced that the main factors for the shape and size of functional areas like in the number of records in the OD trips (and not in the total data), the demographic structure of the population, the development of public transit services, and the location of services, especially in the less populated areas.
Table 1. Summarization of obtained results.
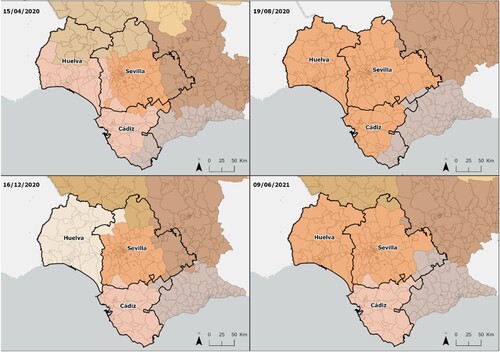
The metropolitan area of Seville shows a good example of the dynamic nature of the functional areas throughout the different phases of the disease. Seville normally receives flows of workers not only from other nearby towns in its province, but also from Huelva, the main cities in the province of Cádiz (such as Jerez de la Frontera), and even Córdoba. This is possible due to the direct rail connection that Seville has with the capitals of neighboring provinces.
During the first phase of the COVID-19 pandemic, the mobility around Seville was available only in the nearby towns with good connections with the capital. The towns in the north and east of the province, far from Seville, did not have good mobility connections. In this way, they became part of other functional areas (the east of the province, for example, had better connections with the province of Córdoba). In the summer of 2020, with the lack of mobility restriction measures, the citizens of Seville tended to move to the beaches of the provinces of Huelva and Cádiz, consequently creating a functional area of considerable size that encompassed the three provinces. The second alarm state of the disease again led to a loss of mobility connections, so the functional area has a very similar shape to that obtained during the first alarm state. Finally, during the new normality period, a functional area can be seen that encompasses not only the entire province of Seville, but also the province of Huelva. This is due to the restoration of transport frequencies and greater access to jobs and services for the citizens of Huelva in Seville ().
Figure 7. Evolution of the mobility functional area corresponding with Seville metropolitan area during the four phases of the COVID-19 pandemic. Source: Own elaboration based on INE phone data.
5. Discussion and conclusions
COVID-19 impact on society has heavily affected the patterns and behaviors of mobility. This influence varies both in space and in time. Mobility functional areas emerge as a useful tool to analyze and map the variations of mobility in a country during different stages of the disease. These zones are based on the observation of human mobility, and they can provide important information for spatial planning, transport organization, or accessibility to services.
Large amounts of data that are up-to-date and available in near real time are needed for study changes in human mobility during several periods of time. For that reason, this research has used mobile phone data openly available by the INE, since can provide commuting information at diverse spatial and temporal scales. This data has been combined with population cells to have in account both mobility and a homogeneously distributed population throughout a diverse country like Spain.
Results have shown the difference between administrative borders from zones shaped by human mobility. Highly populated coastal areas tend to have medium-sized functional areas, while sparsely populated inland areas have large functional areas. In addition, confinement and restriction policies strongly affect the amount, size and shape of the functional areas. The periods of the pandemic corresponding to states of alarm and low mobility had a greater number of small areas, while moments associated with return to ‘new normality’ showed a lower amount and bigger zones. The case of Seville portrays the value and usefulness that functional areas have to establish spatial and transportation measures in complex situations such as a pandemic.
The results obtained can be complemented with findings from other investigations in the same area or in similar research fields. While CitationIacus et al. (2020) only designed functional areas in Spain on a different scale during two phases (pre-pandemic period and first state of alarm period), the results match with the findings observed in this investigation: functional areas are bigger and there are fewer of them during a normal situation, while they are smaller and in a bigger amount during periods corresponding to stronger mobility restrictions. While they have not studied the establishment of functional areas, CitationPonce-de-Leon et al. (2021), have used mobile phone data from different sources to design origin-destination matrices in Spain at different scales, and has compared the results with the raw data from the INE used in this research. They obtained a significant reduction in mobility flows during the first state of alarm, a restoration of the number of trips during the summer holidays, and a new dropping in mobility during the second state of alarm, but not at the same level of very low mobility visualized during the first state of alarm.
In summary, the results obtained in this work agree well with the findings from similar investigations. In addition, this work has gone further, identifying mobility patterns and characteristics of the structures of functional areas of four well-differentiated phases of the pandemic. It has sought to delve into how the physical form of an area based on the mobility of people is clearly affected depending on the scope and characteristics of the disease, and the policies carried out by governments to try to contain the virus. The maps also show the importance of having developed public transport services, and of having a series of basic infrastructures that are easily accessible to the population.
This work found several challenges and aspects to improve in the future. The main limitations of use of mobile phone data are the absence of additional socio-demographic information, the dependence of phone operators to share data, and privacy issues. In this case, INE was the data provider and they tackled potential privacy problems before-hand, but they aggregated the data by day, losing potential information regarding time of the day. A future investigation consists in obtaining that lost data to generate functional areas during the day and night. Another line of investigation lies in the combination of mobile phone data with other sources to obtain economic and demographic information that can add thematic attributes to the calculated functional areas or generate new ones based on the profile of citizens.
Software
The map was designed by using ArcGIS Pro and Adobe Illustrator 2022. The functional areas were created by using Gephi. Mobile phone data was stored in a PostgreSQL database.
Disclosure statement
No potential conflict of interest was reported by the author(s).
Data availability statement
Raw data is available in the following website: https://www.ine.es/experimental/movilidad/experimental_em4.htm In addition, the four used tables and the shapefiles with the results are available in https://osf.io/kz9gb/
Additional information
Funding
Notes
References
- Assem, H., Buda, T. S., & O’Sullivan, D. (2017). RCMC: Recognizing crowd-mobility patterns in cities based on location based social networks data. ACM Transactions on Intelligent Systems and Technology, 8(5), 1–30. https://doi.org/10.1145/3086636
- Bastian, M., Heymann, S., & Jacomy, M. (2009). Gephi: An open source software for exploring and manipulating networks. Proceedings of the International AAAI Conference on Web and Social Media, 3(1), 361–362. https://ojs.aaai.org/index.php/ICWSM/article/view/13937/13786. https://doi.org/10.1609/icwsm.v3i1.13937
- Blondel, V. D., Guillaume, J.-L., Lambiotte, R., & Lefebvre, E. (2008). Fast unfolding of communities in large networks. Journal of Statistical Mechanics: Theory and Experiment, 2008(10), P10008. https://doi.org/10.1088/1742-5468/2008/10/P10008
- Casado-Diaz, J. M. (2000). Local labour market areas in Spain: A case study. Regional Studies, 34(9), 843–856. https://doi.org/10.1080/00343400020002976
- Chen, Y., Liu, X., Li, X., Liu, X., Yao, Y., Hu, G., Xu, X., & Pei, F. (2017). Delineating urban functional areas with building-level social media data: A dynamic time warping (DTW) distance based k -medoids method. Landscape and Urban Planning, 160, 48–60. https://doi.org/10.1016/j.landurbplan.2016.12.001
- Fortunato, S., & Barthélemy, M. (2007). Resolution limit in community detection. Proceedings of the National Academy of Sciences, 104(1), 36–41. https://doi.org/10.1073/pnas.0605965104
- Frith, J., & Saker, M. (2020). It is all about location: Smartphones and tracking the spread of COVID-19. Social Media + Society, 6(3), Article 205630512094825. https://doi.org/10.1177/2056305120948257
- Gabrielli, L., Fadda, D., Rossetti, G., Nanni, M., Piccinini, L., Pedreschi, D., Giannotti, F., & Lattarulo, P. (2018). Discovering mobility functional areas: A mobility data analysis approach. In Springer proceedings in complexity (219279) (pp. 311–322). https://doi.org/10.1007/978-3-319-73198-8_27/COVER
- Gao, S., Janowicz, K., & Couclelis, H. (2017). Extracting urban functional regions from points of interest and human activities on location-based social networks. Transactions in GIS, 21(3), 446–467. https://doi.org/10.1111/tgis.12289
- Gutiérrez Puebla, J. (2018). Big Data y nuevas geografías: la huella digital de las actividades humanas. Documents D'Anàlisi Geogràfica, 64(2), 195. https://doi.org/10.5565/rev/dag.526
- Hu, T., Wang, S., She, B., Zhang, M., Huang, X., Cui, Y., Khuri, J., Hu, Y., Fu, X., Wang, X., Wang, P., Zhu, X., Bao, S., Guan, W., & Li, Z. (2021). Human mobility data in the COVID-19 pandemic: Characteristics, applications, and challenges. International Journal of Digital Earth, 14(9), https://doi.org/10.1080/17538947.2021.1952324
- Iacus, S. M., Santamaria, C., Sermi, F., Spyratos, S., Tarchi, D., & Vespe, M. (2020). Mapping mobility functional areas (MFA) using mobile positioning data to inform COVID-19 policies. Publications Office. https://doi.org/10.2760/076318
- Iacus, S. M., Santamaria, C., Sermi, F., Spyratos, S., Tarchi, D., & Vespe, M. (2022). Mobility functional areas and COVID-19 spread. Transportation, 49, 1999–2025. https://doi.org/10.1007/s11116-021-10234-z
- Lenormand, M., Louail, T., Cantú-Ros, O. G., Picornell, M., Herranz, R., Arias, J. M., Barthelemy, M., Miguel, M. S., & Ramasco, J. J. (2015). Influence of sociodemographic characteristics on human mobility. Scientific Reports, 5(1), 10075. https://doi.org/10.1038/srep10075
- Long, Y., & Shen, Z. (2015). Discovering functional zones using bus smart card data and points of interest in Beijing. GeoJournal Library, 116, https://doi.org/10.1007/978-3-319-19342-7
- Louail, T., Lenormand, M., Cantú, O. G., Picornell, M., Herranz, R., Frias-Martinez, E., Ramasco, J. J., & Barthelemy, M. (2014). From mobile phone data to the spatial structure of cities. Scientific Reports, 4(1), 1–12. https://doi.org/10.1038/srep05276
- Maeda, T. N., Mori, J., Hayashi, I., Sakimoto, T., & Sakata, I. (2019). Comparative examination of network clustering methods for extracting community structures of a city from public transportation smart card data. IEEE Access, 7, 53377–53391. https://doi.org/10.1109/ACCESS.2019.2911567
- Novak, J., Ahas, R., Aasa, A., & Silm, S. (2013). Application of mobile phone location data in mapping of commuting patterns and functional regionalization: A pilot study of Estonia. Journal of Maps, 9(1), 10–15. https://doi.org/10.1080/17445647.2012.762331
- Oliver, N., Lepri, B., Sterly, H., Lambiotte, R., Deletaille, S., De Nadai, M., Letouzé, E., Salah, A. A., Benjamins, R., Cattuto, C., Colizza, V., de Cordes, N., Fraiberger, S. P., Koebe, T., Lehmann, S., Murillo, J., Pentland, A., Pham, P. N., Pivetta, F., … Vinck, P. (2020). Mobile phone data for informing public health actions across the COVID-19 pandemic life cycle. Science Advances, 6(23), https://www.science.org. https://doi.org/10.1126/sciadv.abc0764
- Osorio Arjona, J., & García Palomares, J. C. (2020). Spatio-temporal mobility and Twitter: 3D visualisation of mobility flows. Journal of Maps, 16(1), 153–160. https://doi.org/10.1080/17445647.2020.1778549
- Pérez-Arnal, R., Conesa, D., Alvarez-Napagao, S., Suzumura, T., Català, M., Alvarez-Lacalle, E., & Garcia-Gasulla, D. (2021). Comparative analysis of geolocation information through mobile-devices under different COVID-19 mobility restriction patterns in Spain. ISPRS International Journal of Geo-Information, 10(2), 73. https://doi.org/10.3390/ijgi10020073
- Ponce-de-Leon, M., del Valle, J., Fernandez, J. M., Bernardo, M., Cirillo, D., Sanchez-Valle, J., Smith, M., Capella-Gutierrez, S., Gullón, T., & Valencia, A. (2021). COVID-19 flow-maps an open geographic information system on COVID-19 and human mobility for Spain. Scientific Data, 8(1), 310. https://doi.org/10.1038/s41597-021-01093-5
- Poom, A., Järv, O., Zook, M., & Toivonen, T. (2020). COVID-19 is spatial: Ensuring that mobile Big Data is used for social good. Big Data & Society, 7, Article 2053951720952088. https://doi.org/10.1177/2053951720952088
- So, M. K. P., Tiwari, A., Chu, A. M. Y., Tsang, J. T. Y., & Chan, J. N. L. (2020). Visualizing COVID-19 pandemic risk through network connectedness. International Journal of Infectious Diseases, 96, 558–561. https://doi.org/10.1016/j.ijid.2020.05.011
- Yang, X., Fang, Z., Xu, Y., Shaw, S. L., Zhao, Z., Yin, L., Zhang, T., & Lin, Y. (2016). Understanding spatiotemporal patterns of human convergence and divergence using mobile phone location data. ISPRS International Journal of Geo-Information, 5(10), 177. https://doi.org/10.3390/ijgi5100177