
ABSTRACT
Participation is becoming not only a theoretical framework of EU and UN documents, but also a practical approach that many municipalities explore in order to build resilient, sustainable and smart cities. The paper presents a weighted Index of Geoparticipation for all municipalities in the Czech Republic (n = 6258). The index is an indicator-based value divided into three dimensions (communication, participation, transparency) that helps to evaluate the state of geoparticipation among Czech municipalities. The size of the municipality (measured by population) and the significance of the municipality are both highly related to the values of the Index of Geoparticipation. Regional capitals, major cities, and big towns that are part of the Healthy Cities Network all have higher values for the Index of Geoparticipation.
1. Introduction
Community participation in planning and development has become a buzzword in past decades. This became visible also on the national and international level, as one of the key principles of the new EU Cohesion Policy (2021–2027) is to bring Europe closer to citizens by fostering the sustainable and integrated development of all types of territories (CitationEuropean Commission, 2022). Even at the level of the United Nations, participation has a prominent role in the Agenda 2030 – specifically as a part of SDGs goal 11 target 11.3 – By 2030, enhance inclusive and sustainable urbanisation and capacity for participatory, integrated and sustainable human settlement planning and management in all countries (CitationUN, 2014) and SDGs goal 16 target 16.7 – Ensure responsive, inclusive, participatory and representative decision-making at all levels (CitationUN, 2014). Nevertheless, the question remains unanswered: ‘How/Can we measure (geo)participation?’ Researchers analysing participation with spatial elements often speak about geoparticipation (CitationPánek, 2016) to reach sustainable and/or smart cities (CitationOlszewski & Turek, 2018). When measuring (geo)participation, one can find various indexes on the international level (the e-participation index (EPI) designed by the UN Department of Economic and Social Affairs) or even the national level, i.e. Czech Index of Participation 2015/16 (ranking the 101 largest cities of the Czech Republic and urban districts over 10 thousand inhabitants according to public participation). The quality/level of e-participation in the Czech Republic is low, compared to the other European countries, as in the latest UN E-Government Survey 2022 (CitationUN, 2022), the Czech Republic was ranked 57th from 193 evaluated countries. This is an improvement from 65th place (2020) and 92nd place (2018), but still below its neighbouring countries – Austria (21st), Germany (32nd), and Poland (51st) – except Slovakia (83rd place). This paper builds upon the Index of Geoparticipation (CitationPánek et al., 2021) – an indicator-based index divided into three dimensions (communication, participation, transparency) that helps to evaluate the state of geoparticipation among all Czech municipalities (n = 6258). The added value of this paper is that the original Index of Geoparticipation, where all indicators had the same weight, was adjusted by the pairwise rating of all indicators via the Saaty method (CitationSaaty, 1983) where domain specific experts were used to set-up the weights. This process allowed us to understand better the key factors affecting the success or failure of the performance within the Index of Geoparticipation. One can easily argue that our index is actually not measuring (geo)participation, especially if we accept the original definition from Sherry Arnstein stating that
… citizen participation is a categorical term for citizen power. It is the redistribution of power that enables the have-not citizens, presently excluded from the political and economic processes, to be deliberately included in the future. It is the strategy by which the have-nots join in determining how information is shared, goals and policies are set, tax resources are allocated, programs are operated, and benefits like contracts and patronage are parcelled out. (CitationArnstein, 1969, p. 216)
2. Methods
2.1. Data
In response to the lack of data on geoparticipation at the municipal level in Central and Eastern Europe, we created an extensive geodatabase of indicators on Czech municipal governance and the use of geoparticipation tools. Using crowdsourcing, overall we collected 55 attributes for 6258 municipalities (Local Administrative Unit 2; LAU2) in Czechia. The attributes were compiled from 24 questions and joined with spatial data for further ease of processing in GIS. Data is described in detail in CitationPászto et al. (2021). From the whole dataset we have selected 12 indicators dividing them into three dimensions (see ).
Table 1. Overview of indicators used for the Index of Geoparticipation calculation.
2.2. Data processing
The ‘Cubed’ approach (CitationFung, 2015; CitationPoplin, 2013; CitationThoneick, 2021) was used as the main research framework to create the Index of Geoparticipation. The three dimensions used in the Index of Geoparticipation (Participation, Communication, and Transparency) were inspired by the work of CitationLysek (2016) and CitationHurtíková and Soukop (2019), who analysed 205 municipalities with extended jurisdiction (ORP) in Czechia. Unlike CitationLysek (2016) and CitationHurtíková and Soukop (2019), our analysis was elaborated at a higher level of detail, namely at the municipality level. Based on the research of CitationLysek (2016), CitationHurtíková and Soukop (2019), twelve indicators were finally identified and divided into three dimensions of the Index of Geoparticipation (see ). Only binary values of 0/1 were used for the purposes of the Index, even for data where higher contextual detail was known. This step was taken both (a) to allow for further quantitative processing of the data and (b) to consider some inconsistencies in the data collection at a finer level. The procedure mentioned above is described in CitationPánek et al. (2021).
2.3. Weight settings
In our previous research, input indicators had equal weights, thus equally significant. That approach did not adequately reflect the different importance and usage of various (geo)participatory methods/tools/events. Therefore, the next step was to weigh Index of Geoparticipation by calculation weighted indicators’ sum ().
Figure 1. Index of Geoparticipation calculation equation.
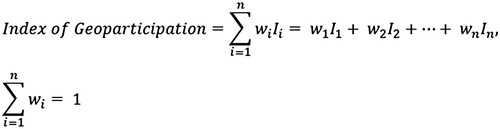
Weights were determined using the Saaty method (CitationSaaty, 1983). Pairwise ratings of all indicators against each other were processed using the AHP Online System web application – https://bpmsg.com/ahp (CitationGoepel, 2018), allowing all pairs’ ratings to be converted into an interactive environment. The web project is then shared using a unique link and allows independent ratings with possible backward identification of the rater. Using this procedure, pairwise evaluations were conducted by nine experts (partly the authors of the paper) from the fields of geography, political science and development studies. However, the resulting weights showed considerable variance, so each rater was asked to justify their ratings for each criterion. These comments were subsequently shared with all the evaluators, and a detailed joint discussion of the sub-ratings was conducted. In the last step, the online paired ratings were repeated (this time by only six key experts), and an average was calculated from the resulting weights (). The sub-ratings already showed minimal variance; however, for control purposes, the minimum and maximum outliers were removed from the ratings. The mean value without outliers differed only minimally from the ratings of all raters, so all six additional raters were used to determine the final weights ().
Figure 2. Index of Geoparticipation calculation scheme.
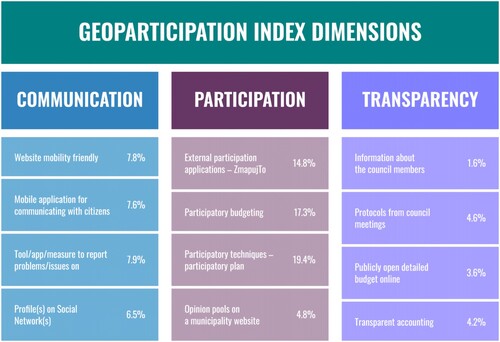
Table 2. Expert weights (outliers in italics, final weight in bold).
As the last step, a typology of municipalities was created based on the values of the Index of Geoparticipation (top right corner on Map 1). The typology was developed from the individual dimensions of the Index: Communication, Participation and Transparency. Since the inputs for each dimension are binary numbers, a score was calculated for each LAU 2 unit (municipality) in the respective dimension.
Thus, each municipality scored between 0 and 4 in each dimension. The input values (0–4) were categorised into only two possible values to create a typology with a reasonable number of resulting types. For each geoparticipation dimension, a municipality was assigned a ‘−’ (minus sign) if it scored 0 or 1 on that dimension. If a municipality scored two or more points, it was given a ‘+’ (plus sign). This way, all municipalities were assigned to one of eight types (maximum number of combinations of three dimensions and two values). For a clearer visualisation, these eight types were further grouped into four main types: (1) fully positive (+++), (2) positive (++−, +−+, −++), (3) negative (+−−, −+−, −−+) and (4) full negative (−−−).
2.4. Statistical evaluation
To interpret the spatial distribution of the Index of Geoparticipation more accurately, a hot spot analysis (Getis-Ord Gi*) was performed. The global spatial correlation was used to determine the distance where clustering occurs most. The peak value at 30 km was the best fit (z-score 65.48 with p-value < 0.0000001). The 30 km value was further used to calculate local spatial autocorrelation (Getis-Ord Gi*). The analysis resulted in areas where high and low value clusters occur, ignoring outliers. A specific feature of this analysis is that even if a municipality has a high value, it can be identified as a cold spot because it does not enter the calculation alone but together with its neighbours (). Thus, the analysis emphasised areas where high or low values generally prevail, which is not obvious from simply looking at the input values of the Index of Geoparticipation. Furthermore, the local Moran's I was used to identify outliers within each cluster () in order to refine interpretation of the phenomena.
3. Results
The Index of Geoparticipation (Map 1) was calculated using a weighted sum of twelve input indicators divided into three dimensions. The assigned sub-weights show that the dimension of participation (56%) has the highest impact on the final score, followed by the dimensions of communication (30%) and transparency (14%), and the range of values in the sub-maps corresponds to this. The overall Index of Geoparticipation ranges from 1 to 100.
The average values for the different categories of municipalities (by municipal status and population) are shown in . There is a clear relationship between the Index values and the municipality status/the number of inhabitants. The highest average values are achieved by regional capitals, followed by major cities, municipalities with extended competence, municipalities of the Healthy Cities Network of the Czech Republic (HCCZ) and towns (municipalities with more than 3000 inhabitants). Similarly, municipalities with a higher number of inhabitants (the population classification corresponds to the standard categories used by the Czech Statistical Office) possess higher Index values. This situation is related to the fact that a larger population is related not only to the town's status but also to its budget and the range of services provided. This may also result in a higher participation intensity, reflected in all three dimensions assessed. It is also important to be noted that smaller municipalities often use different (geo)participatory methods (offline notice boards, community meetings in local pubs, etc.) that may not be covered by our indicators, as all our data was collected online only. Therefore, the performance of smaller municipalities can be underrated.
Table 3. Average values for different municipality categories.
It is interesting to note the significant position of the municipalities that are members of the Healthy Cities Network of the Czech Republic (HCCZ). Some of them are cities with a higher population, but this is only true for some of them. Nevertheless, the values of all sub-dimensions and the overall Index of Geoparticipation are very high for these municipalities. This is related to the high support for participatory activities and the implementation of Local Agenda 21 within the network. The results are, to some extent, comparable to the original research (CitationPánek et al., 2021), in which sub-indicators’ weighting was not used. However, the transparency dimension was slightly neglected compared to the initial approach, and the participation dimension was accented. Thus, differences and changes can be observed, especially at the detailed level in the evaluation of individual municipalities; in the overall assessment at the level of the whole Czech Republic, the influence of weighting is not that noticeable.
The spatial evaluation of the results (Map 1) depicts higher values of the Index of Geoparticipation and sub-dimensions in larger cities, especially regional ones. This trend is most pronounced in the case of the participation dimension, while it is least distinct for the communication dimension. In this case, the sub-values of the communication dimension are spread much more evenly. The participation dimension (which has the greatest influence on the overall score) shows a trend towards lower values in each region's inner and outer peripheries, often rural areas (based on CitationPaszto et al., 2015). Although not that (strongly) apparent spatially on the results from hot-spot analysis ( and ), there is a strong numerical (non-spatial) relationship between the municipality size and Index value – see . This trend is also partly visible considering the overall Index scores, but here it is slightly reduced by the influence of the other dimensions, which do not show this trend so strongly.
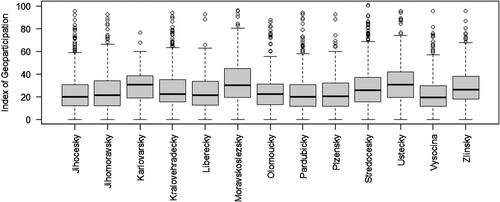
Within individual regions, higher values of the Index can be observed in the north of the Hradec Králové Region, in the Ústí nad Labem, Zlín and Moravian-Silesian Regions. However, the sum of municipalities is different in each of the regions, so in the statistical evaluation (), higher values of the Index slightly vary in the Moravian-Silesian, Karlovy Vary and Ústí nad Labem regions. Nevertheless, these are not statistically significant differences. The values of outliers are spread more or less evenly throughout the Czech Republic.
Figure 3. Comparison of Czech regions.
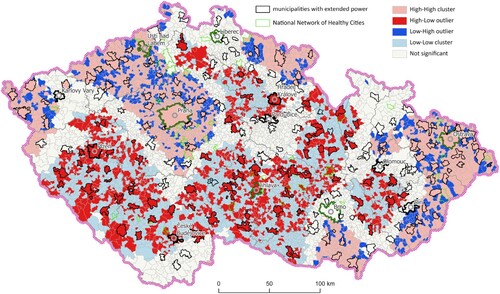
Hotspot analysis was performed to statistically characterise the spatial distribution of the Index of Geoparticipation. Significant clusters of high and low values can be interpreted based on . High values cluster in five areas, namely in a belt in the east of Czechia (on the border of the Zlín and Moravian-Silesian regions), south of Brno, in the northern part of the Hradec Králové Region, in the west of Czechia (Karlovy Vary Region) and a northwestern belt from Prague towards borders with Germany. Significant clusters of low values occur in four main areas, at the inner peripheries between the cities of Olomouc, Zlín and Brno; western from Hradec Králové and then in two very distinct belts of municipalities stretching from southwest to the central part of Czechia and then heading to the north. Especially the south–north part of the belt in the central part of the country corresponds with the most rural areas following the border between Moravia and Bohemia (two major national parts of Czechia). At the same time, it is very important to note that there are a few outliers within these significant clusters of high and low values (). These outliers are spread very evenly across the whole area. The relatively uniform distribution of outliers with no apparent spatial pattern indicates the continued presence of heterogeneity within otherwise (statistically) homogeneous clusters. The disruption of the spatial pattern homogeneity of the index is attributed to the presence of municipalities that, relative to their surroundings (considering a 30-kilometre neighbourhood), exhibit higher values. Almost invariably, these are municipalities with extended power (municipalities with a black outline), which are sub-regional administrative centres and have a higher population, or HCCZ member municipalities where higher activity in the field of (geo)participation is anticipated. Other high-low clusters within cold spot areas deserve to be examined individually, but that is beyond the scope of this paper. For completeness, we just add that the inverse situation in terms of outliers occurs in hot spot locations.
Figure 4. Results of hot spot analysis (Getis-Ord Gi*).
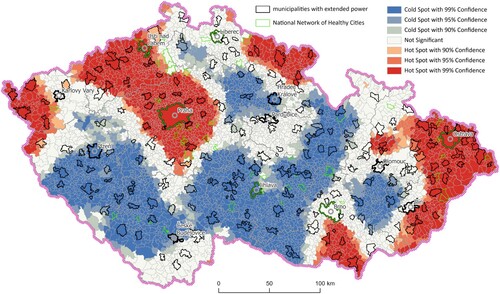
Figure 5. Results of local Moran’s I.
4. Discussion and conclusions
The results presented in this paper are based on a quantitative assessment of geoparticipation at a detailed municipal level (LAU2 units) for the entire Czechia. Most existing research has focused on qualitative evaluations, assessing sub-factors or geographically covering much smaller areas, or comparing countries among each other. The authors of this study follow up on an earlier research and publication (CitationPánek et al., 2021), in which the Index was constructed at the municipal level (yet covering the whole country) for the first time. The results described here differ from the earlier research mainly in the use of weights, cluster analyses and emphasising cartographic visualisation of the findings.
The results confirm previous assumptions presented earlier, i.e. that the values of the Index of Geoparticipation are directly related to the size of the municipality (by population) and also to the municipality’s status (by importance). Higher values of the Index of Geoparticipation are found in regional capitals, bigger towns and municipalities that are members of the Healthy Cities Network of the Czech Republic (HCCZ). The Healthy Cities program by the World Health Organisation encourages cities to take actions and adopt policies that improve public health and create supportive environments for their residents. The program focuses on areas such as health promotion, disease prevention, healthy urban planning, and community participation. The WHO collaborates with cities around the world to support the implementation of the Healthy Cities approach. Participating cities receive guidance, technical support, and access to a network of knowledge and best practices. The program encourages cities to develop comprehensive policies that integrate health considerations into urban planning, transportation, housing, environmental protection, and other sectors. This can be one of the reasons why participating municipalities (not just cities) in Czechia perform better in the Index of Geoparticipation.
Compared to the original study, the use of weights implies a greater emphasis on the participation dimension itself, while the less important dimension of transparency is suppressed. However, the resulting values of the Index tend to follow a very similar spatial pattern to the original study. The changes are particularly noticeable in the detailed evaluation of individual municipalities, allowing for a more accurate assessment of the Index. Results from the cluster analyses delineated several statistically significant clusters of high and low values, which gave us valuable insights into geoparticipation evaluation and its spatial distribution. At the same time, however, these clusters must be considered in the context of larger outliers. Although clusters outlined the most significant areas/regions, inner heterogeneity remains to some degree.
Several limitations can be identified in the conducted study, which can pose potential challenges for further research. First, it is necessary to mention the quality and timeliness of the data used and collected for the research. Since the data were crowdsourced, the authors checked data quality on a random sample (more on this process in CitationPászto et al., 2021). The overall error rate was found to be 10.3%. The data are gradually becoming outdated due to many factors (e.g. new elections that might influence the political atmosphere in municipalities, covid-19 behavioural change towards digital technologies and increasing digitalisation of the governmental bodies). Thus a gradual improvement of the Index of Geoparticipation in a larger number of municipalities can be expected. However, no data other than those generated by our research are yet available.
Another limitation is undoubtedly the choice of input criteria and their subsequent weighting. The authors have tried to draw on the available literature and their knowledge gained from interviews with municipal representatives. Given the absence of studies of a similar nature, it is impossible to assess the validity of this approach, and therefore, there is considerable potential for future follow-up studies.
Despite these limitations, the results are sufficiently valid and unique, especially in Czechia. To this date, we have yet to be aware of any other research that evaluates all municipalities within one country in such a level of detail.
Software
All analytical results presented in this paper were calculated in ArcGIS Pro. Spatial data and maps were managed, processed and created in the Esri platform. Graphic components were designed in Adobe Illustrator software and incorporated into the final map layout.
Supplemental Material
Download MS Word (12.9 KB)Geoparticipation_layout7_230605.pdf
Download PDF (6.4 MB)Acknowledgements
We would like to thank all experts involved in setting the weights and discussion about their limitations. Without this discussion, our research would not be possible.
Disclosure statement
No potential conflict of interest was reported by the author(s).
Data availability statement
The data that support the findings of this study are available from the corresponding author on reasonable request. In addition, the data are available for download at https://tiny.cc/geoparticipation.
Additional information
Funding
References
- Arnstein, S. R. (1969). A ladder of citizen participation. Journal of the American Institute of planners, 35(4), 216–224. https://doi.org/10.1080/01944366908977225
- European Commission: EU regional and urban development. (2022). Priorities for 2021–2027 [online]. [cit. 2022-11-29]. https://ec.europa.eu/regional_policy/policy/how/priorities_en.
- Fung, A. (2015). Putting the public back into governance: The challenges of citizen participation and its future. Public Adminstration Review, 75(4), 513–522. https://doi.org/10.1111/puar.12361
- Goepel, K. D. (2018). Implementation of an online software tool for the analytic hierarchy process (AHP-OS). International Journal of the Analytic Hierarchy Process, 10(3), 469–487. https://doi.org/10.13033/ijahp.v10i3.590
- Hurtíková, H., & Soukop, M. (2019). Participative and deliberative democracy on the local level: How the political characteristics of municipalities in the Czech Republic relate to the use of selected democratic innovation within their territory? Lex Localis, 17(2), 369–393. https://doi.org/10.4335/17.2.369-393(2019)
- Lysek, J. (2016). Participatory democracy and local representation: A Czech case study. Retrieved March 10, 2021 from: https://ecpr.eu/Events/Event/PaperDetails/28794.
- Olszewski, R., & Turek, A. (2018). Using fuzzy geoparticipation methods to optimize the spatial development process in a smart city. In 2018 IEEE 4th International Conference on Collaboration and Internet Computing (CIC) (pp. 430–437). IEEE.
- Pánek, J. (2016). From mental maps to geoparticipation. The Cartographic Journal, 53(4), 300–307. https://doi.org/10.1080/00087041.2016.1243862
- Pánek, J., Pásztó, V., Burian, J., Bakule, J., & Lysek, J. (2021). What is the current state of geoparticipation in Czech municipalities? GeoScape, 15(1), 90–103. https://doi.org/10.2478/geosc-2021-0008
- Paszto, V., Brychtová, A., Tuček, P., Marek, L., & Burian, J. (2015). Using a fuzzy inference system to delimit rural and urban municipalities in the Czech Republic in 2010. Journal of Maps, 11(2), 231–239. https://doi.org/10.1080/17445647.2014.944942
- Pászto, V., Pánek, J., & Burian, J. (2021). Geodatabase of publicly available information about Czech municipalities’ local administration. Data, 6(89), 1–13. https://doi.org/10.3390/data6080089
- Poplin, A. (2012). Playful public participation in urban planning: A case study for online serious games. Computers, Environment and Urban Systems, 36(3), 195–206. https://doi.org/10.1016/j.compenvurbsys.2011.10.003
- Saaty, T. (1983). Priority setting in complex problems. IEEE Transactions on Enigneering Management, 3(3), 140–155. https://doi.org/10.1109/TEM.1983.6448606
- Thoneick, R. (2021). Integrating online and onsite participation in urban planning: Assessment of a digital participation system. International Journal of E-Planning Research (IJEPR), 10(1), 1–20. https://doi.org/10.4018/IJEPR.2021010101
- UN General Assembly. (2014). Report of the open working group of the general assembly on sustainable development goals (A/68/970), New York, 24 p. https://digitallibrary.un.org/record/778970/files/A_68_970-EN.pdf.
- United Nations. (2022). United nations E-government survey 2022. New York, 280, ISBN: 978-92-1-123213-4.