
ABSTRACT
Numerous studies have concentrated on developing user-centered designs for hazard zone maps but rarely for hazard-oriented geomorphological maps, named as Geomorphological Hazard Thematic Maps (GHTMs) in this study, which provide more detailed information about natural hazards. This study developed a user-centered mapping design for GHTMs for nonexperts in geomorphology. We invited civil engineers and high school educators to evaluate a sample GHTM’s design in group and focus group panel interviews. The civil engineers preferred maps with more geomorphological features, whereas the educators preferred simple designs. Both groups indicated that the inclusion of essential facilities and road networks is essential. The map was also adjusted by adding hillshade layer and by changing the symbology for mass wasting, fault scarps, and fluvial features to increase clarity and simplicity. This case study is the first step toward developing user-centered mapping designs for hazard communication that will deepen their understanding of natural hazards.
Highlights
This study developed and explored a user-centered design for a geomorphological hazard thematic map.
Civil engineers and educators were invited to provide feedback.
The engineers preferred detailed designs, and the educators preferred simplified designs.
Both groups considered essential facilities and roads useful reference points.
This study offers a geomorphological mapping design for nonexperts in geomorphology.
1. Introduction
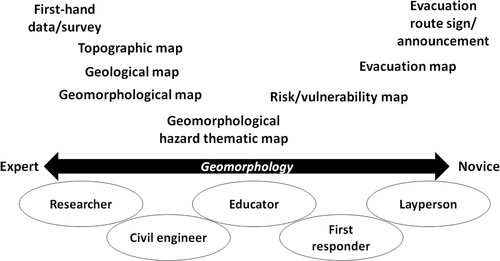
Maps are essential tools for hazard communication. Mapping geomorphological hazards involves compiling environmental characteristics, identifying hazard-related geomorphological features, and delineating the hazard zones that are the most relevant to stakeholders and users in hazard assessment and management. Because many natural hazards are associated with geological and geomorphological characteristics, maps delineating geomorphological features are often used to evaluate related hazards (CitationChelli et al., 2021) such as landslides (CitationBera et al., 2019; CitationSegoni et al., 2018), debris flow (CitationBlais-Stevens & Behnia, 2016; CitationFarabollini et al., 2021), and floods (CitationDottori et al., 2016; CitationMandarino et al., 2021). For the purpose of geomorphological hazard management and effective communication, a variety of hazard-related maps are created to cater to the diverse needs of different users (). Geomorphological experts collect and compile primary and secondary data to delineate geomorphological features on these maps. On the other hand, government agencies take the responsibility of preparing hazard zone maps that are simplified and contain limited information, ensuring easy understanding and accessibility for the general public. Take landslide for example, geological and geomorphological data obtained from field surveys, remote sensing data, and survey maps can be used to interpret the movement of bedrock and develop a geomorphological map showing various landslide features, such as landslide types and deposits. For nonexperts of geomorphology, landslide hazard zone maps can be created to visualize danger in each zone with colors and symbols (CitationGriffiths & Abraham, 2008). While geological and geomorphological maps may appear complex and challenging for non-experts to interpret, there are specific user groups, such as civil engineers and hazard educators, whose work is closely linked to hazard management. These professionals would greatly benefit from accessing more detailed and comprehensive information provided by these maps. Therefore, the development of a user-centered hazard-oriented geomorphological map is crucial for effective hazard management and communication. It is named as the Geomorphological Hazard Thematic Map (GHTM) in the current research.
Figure 1. A conceptual diagram is presented to illustrate the relationship between maps utilized in geomorphological hazard management and the corresponding map users. The double-head arrow symbolizes the varying levels of expertise in geomorphology. It is important to note that this diagram illustrates the relative relationships between different maps and end-users in hazard communication. However, it does not explicitly indicate any limitations or constraints on their usage.
Priori studies have focused on developing user-centered designs for hazard zone maps for first responders and the general public. Because hazard maps are created by experts, they can be difficult to interpret for nonexperts and stakeholders (CitationHaynes et al., 2007; CitationHenstra et al., 2019; CitationMarti et al., 2019). One case study involving seismic hazard mapping in Switzerland suggested that nonexperts could distinguish areas with higher degree of hazard from the lower areas. However, they struggled to completely understand the magnitude because of color designs (CitationMarti et al., 2019). CitationHenstra et al. (2019) used nine criteria to analyze 239 flood maps of Canadian communities and suggested 62% of the maps did not meet half of the criteria. Numerous studies have focused on user-centered mapping designs to increase the efficiency of hazard communication and thereby improve emergency responses and decision-making (CitationHaynes et al., 2007; CitationLuke et al., 2018; CitationMorrow et al., 2015; CitationMorss et al., 2017; CitationThaler & Seebauer, 2019). For example, CitationSanders et al. (2020) collected fine-resolution geospatial data and invited experts and residents of Newport Bay and the Tijuana River Valley in the United States to participate in collaborative flood modeling based on the residents’ sense of place to increase awareness of hazards and improve decision-making. CitationMeyer et al. (2012) conducted five case studies in Europe involving interviews, workshops, and eye-tracking tests to evaluate maps created for strategic planners, emergency planners, and the general public. They identified required elements of maps in each group, namely information density and complexity, consequences and risk, and additional information for emergency management. Most studies have targeted designs for hazard zone maps of one specific type of hazard. To date, previous studies have rarely investigated user-centered designs for GHTMs, which offer comprehensive information on various geomorphological hazards.
Geomorphological mapping involves interpreting and delineating terrain into conceptual spatial units on the basis of the morphological characteristics, geomorphological processes, and/or geomorphic evolution. Map markers convey multidisciplinary information, including field survey data, remote sensing data, and other cartographic products (CitationBishop et al., 2012). Several European countries have developed national mapping systems and map symbols for geomorphological mapping, such as the British Geomorphological Maps and the German Geomorphologische Karte (CitationOtto et al., 2011; CitationParon & Claessens, 2011). Since the 1960s, the Commission on Geomorphological Survey and Mapping of the International Geographical Union has hosted multiple meetings and compiled the ‘Manual of Detailed Geomorphological Mapping.’ The objective of this endeavor was to establish a standardized mapping framework for classification schemes and symbology designs (CitationDemek, 1972; CitationKlimaszewski, 1982). Thus far, an international standard for geomorphological mapping is still lacking (CitationSeijmonsbergen, 2013). CitationParon and Claessens (2011) reviewed various geomorphological thematic maps and reported that most were primarily used by experts. This indicates that effective dialogue between geomorphologists and other professionals is required.
GHTMs present more detailed information than do hazard zone maps, which illustrate only the degree of hazard. GHTMs can help users proceed with a more comprehensive understanding of the natural hazards of a given area. For instance, point bars and backswamps, despite both being susceptible to flooding, require distinct management practices due to their differing characteristics, such as flow energy, sediment structures, and water drainage. Map users, who may have basic training in environmental sciences but not be geomorphological experts, can benefit from experience with and knowledge of GHTMs. To develop a user-centered design for GHTMs targeting non-experts in geomorphology, we focused on two user groups. The first group comprised civil engineers involved in designing structures to mitigate hazards and conducting hazard response and prevention. The second group consisted of geography teachers in senior high schools, who shared the duty on natural hazard education in Taiwan. We obtained their opinions through group interviews and a focus group panel interview. This study introduces GHTMs designed to offer non-experts in geomorphology detailed insights into geomorphological hazards, facilitating their practical application in hazard planning, management, and education.
2. Study area
Because of its unique location and geological and geomorphological setting, Taiwan has multiple natural hazards (e.g. tropical cyclones, debris flows, landslides, and earthquakes) that can lead to considerable loss of life and property damage. An analysis based on a global database indicated that approximately 97% of Taiwan is exposed to more than three natural hazards (CitationDilley et al., 2005). Taiwan is located in the zone of collision between the Philippine Sea Plate and Eurasian Plate, which results in strong folding, faulting, and uplifting that leads to steep slopes and a high frequency of earthquakes. During summer and fall, typhoons (tropical cyclones) cause extensive precipitation, which often causes landslides, debris flow, and floods (CitationChang, 1996; CitationTeng et al., 2006) with extremely high sediment discharge. This combination of natural hazards has considerably affected Taiwan. For example, on September 21, 1999, Taiwan experienced a 7.7-Mw earthquake known as the Chi-Chi Earthquake, with a Richter magnitude of 7.3. This seismic event resulted in loosened soil and the formation of rock fragments on mountain slopes. Two years later, in late July 2001, the loose sediment triggered by the earthquake, combined with heavy rainfall from Typhoon Toraji, led to devastating debris flows and floods in multiple regions. The catastrophic event resulted in 103 casualties and 111 people reported missing (CitationCheng et al., 2005).
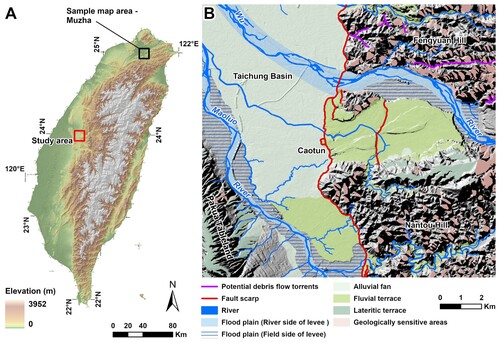
Our study area was the midwest of Taiwan, at the middle reach of the Wu River ((A)). The most populous town in the region is Caotun in Nantou County. Wu River is the sixth largest river in Taiwan, and the watershed area and river length are approximately 2025 km2 and 119 km. We selected this area because of the diversity of its landforms, hazard-related geomorphological features, and land use and land cover. The landforms in this region include mountainous hilly areas, floodplains, river terraces, and various fluvial landforms (i.e. creeks, tributaries, and the mainstem; (B)). The major geomorphological zones are Pakua Tableland and Taichung Basin in the west; the middle reach of Wu River Terrace and Floodplain in the center; and hill zones in the east, including Fengyuan Hill and Nantou Hill on either side of the Wu River (CitationYang & Shen, 2010). For the geochronology of the study area, the ages of Fengyuan and Nanton Hills are classified as Pliocene, Pakua Tableland and Wu River Terrace as Pleistocene, and Taichung Basin and Wu River Floodplain as Holocene, arranged in order from oldest to youngest epochs. This region experiences several natural hazards, such as earthquakes, landslides, debris flows, and flooding, which have potential for recurrence. The Chelungpu Fault, which is associated with the Chi-Chi Earthquake in 1999, is located at the front edge of the hill area (red lines in (B)).
Figure 2. (A) Map of Taiwan’s elevation and the indication for location of sample map (Muzha) and study area (Caotun), and (B) geomorphological zones and landform features related to natural hazards in the study area.
3. Methods
3.1. Data preparation and sample map
Creating GHTM from a geomorphological perspective is a novel method in Taiwan. Although government agencies have developed geographic information system databases that include abundant information on natural and human environments (e.g. topographical maps and environmental geology maps), the outcomes of geomorphological studies are rarely systematically integrated into government map series or databases. CitationShen et al. (2017) initiated a study to develop a series of geomorphological maps illustrating surface processes, topographic relief elements, and geological features that can be applied to environmental and hazard management. CitationShen et al. (2017) selected the Muzha area in northern Taiwan ((A)) as the pilot study area and adopted a mapping design (e.g. the symbology and order of the layer overlapping) based on the Geomorphology Map of the Istituto Superiore per la Protezione e la Ricerca Ambientale of Italy (CitationServizio Geologico d'Italia, 1994, Citation2007) and the Land Condition Map of Japan (CitationGeospatial Information Authority of Japan, 2010). The sample map, which had a scale of 1:25000, was mainly based on secondary data, and the researchers conducted several site visits to identify mapping error and reduce uncertainty. In addition, landform features (i.e. minor fluvial terraces, debris flow fans, floodplains, and flat-bottom valleys) associated with geomorphic hazards that were not included in the secondary data were interpreted, digitized with reference to aerial photos and a digital elevation model, and verified in the field. We used the map developed in CitationShen et al. (2017) () as a sample for the group and focus group panel interviews and used the findings of the interviews to develop a GHTM for the Caotun area in central Taiwan. Similar to CitationShen et al. (2017) we acquired secondary geospatial data for the Caotun area, which comprised topographic maps, land use, land cover data, aerial photos, a digital elevation model, an environmental geology map, and other feature layers. Mass wasting, neotectonics, and fluvial landform features that are associated with geomorphological hazards, as well as anthropogenic landforms were selected for mapping. We also conducted additional digitalization and verification in the field (). For example, some minor river terraces were visualized with reference to aerial photos which were not included in previous studies (CitationChang et al., 2002, Citation2003).
Figure 3. Sample map used in group and focus group panel interviews. The map was retrieved from the geomorphological mapping study of CitationShen et al. (2017). The enlarged area (A) on the right provides a closer look at the original symbology and feature designs of the sample map. The red rectangular frame on the left indicates the proximate location of the enlarged area. For a more detailed and higher-resolution map, please refer to the supplement included with this study.
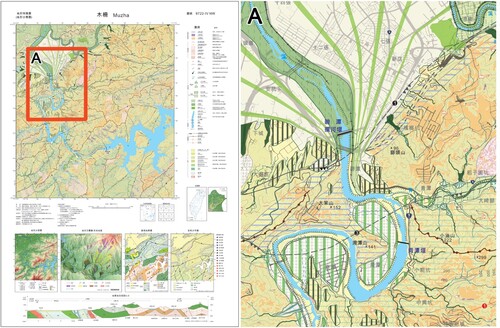
Table 1. Resolution and mapping scale, source of secondary data for Caotun GHTM.
3.2. Group and focus group panel interviews with civil engineers and educators
Professionals associated with civil engineering and natural hazard education in Taiwan were interviewed. We carefully selected civil engineers from various institutes involved in designing structures for hazard prevention and control, as well as engaging in hazard response and prevention activities at the local level. The engineers encompassed researchers from hazard management centers in research organizations, managers from slopeland hazard or disaster research institutes, geotechnical engineers, water and soil conservation technicians, and skilled professional civil engineers. Involving professionals engaged in hazard education, we extended invitations to geography teachers from senior high schools (10th–12th grade), recognizing their pivotal role in delivering natural hazard education within Taiwan's school system. Both groups of professionals had received foundational training in environmental sciences, although they did not possess expertise in geomorphology.
The process of obtaining information from civil engineers and educators consisted of three stages, conducted between June and October 2018. In stage 1, two separate group interviews were conducted with civil engineers and educators to gather suggestions for adjusting the map designs. In stage 2, a focus group panel was formed, comprising representatives from both groups, where the modified GHTM was presented, and feedback from the participants was obtained. In stage 3, the subsequent version of the modified GHTM was presented during a group interview conducted in the field with civil engineers, while educators were sent the print-out map by mail to gather further comments ().
Table 2. Date, purpose, and number of attendees of the group and focus group panel interviews.
In the two group interviews in stage 1, the interviewees were provided the sample geomorphological map of Muzha () and related information. The interviews lasted approximately 2 hours and were video recorded. The interview groups comprised two to three people. The group interviews focused on the aspects of the sample map requiring adjustment and the interviewees were asked to answer following open-ended questions:
Q1. Considering the purpose of GHTMs, what are the necessary information and features in the main map?
Q2. What should be highlighted or added to the main map?
Q3. What should be included as a side map?
Q4. Do you have any other suggestions?
The engineers were also asked to offer their opinions regarding the applicability of the sample map to their field work, and the educators were asked to offer their opinions regarding using the map in indoor and outdoor classes.
In stage 2, we hosted a focus group panel event and invited the civil engineers and educators from the group interviews. A revised sample map was provided, and the panel was asked to provide suggestions to modify the map. We also invited professional cartographers, geomorphologists, and geologists to the panel discussion to provide their opinions regarding the layout, font, and symbology of the map. The participants were four civil engineers, five educators, five cartographers, and six geomorphologists and geologists. In stage 3, a final group interview with the engineers was conducted in the field to obtain their feedback on the revised map. We also mailed each educator the revised map and requested their feedback. We used the findings of the group and focus group panel interviews and secondary data layers to create a new map – Caotun GHTM.
4. Results
4.1. Group and focus group panel interviews
The engineers preferred the maps to have more details related to the tasks they were performing (). During the group interview in the field (stage 3), the engineers offered minor suggestions regarding the design and suggested a larger scale map to visualize the details. The engineers also suggested adding catchment boundaries and fault lines, which are related to civil engineering design, to the main map. The engineers’ suggestions for symbology (i.e. the landslide categories, lithology, and attitudes) and side maps (i.e. the landslide probability and slope activity) were also related to civil engineering design and hazard mitigation. They recommended adding major roads and critical facilities to help readers identify their relative location, too.
Table 3. Civil engineers’ suggestions from group interview and panel discussion. The asterisks (*) accompanying the numbers in the ‘Applied in Caotun GHTM’ section indicate two possibilities: (1) the suggestion was partially implemented, or (2) the suggestion was applied to the side map instead of the main map, or vice versa.
The educators were most concerned with whether the map would be clear and easy to interpret (). Some of the educators’ concerns related to the readability of the map because senior high school students may struggle to interpret complex features. The educators suggested that grid lines shall be added to both the main and side maps to ensure users can easily locate and compare features. The educators also offered suggestions regarding the symbology and side maps, namely differentiating geomorphological zones by using colors and replacing the lithological layer with hillshade layer to improve the stereoscopic sense of depth. The educators also reported that although the sample map could be used for teachers to prepare the classes, the map required further simplification for students.
Table 4. Educators’ suggestions from group interview and panel discussion. The asterisks (*) accompanying the numbers in the ‘Applied in Caotun GHTM’ section indicate two possibilities: (1) the suggestion was partially implemented, or (2) the suggestion was applied to the side map instead of the main map, or vice versa.
4.2. Caotun GHTM design
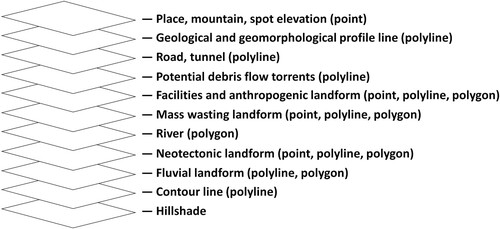
The information from the group and focus group panel interviews were compiled, and the suggestions were analyzed and applied to the final version of the Caotun GHTM (). The group and focus group panel interviews revealed that two groups had different preferences. To increase the applicability of the GHTM for stakeholders, we applied more suggestions from the educators ( and ), who preferred simpler designs. To determine the order of the map’s layers, we considered the geometric characteristics, importance, and size/extension of each layer. We overlaid place names, geological and geomorphological profile lines, roads, potential debris flow torrents (PDFTs), facilities, and landmarks onto the layers ().
Figure 4. Layout of Caotun GHTM.
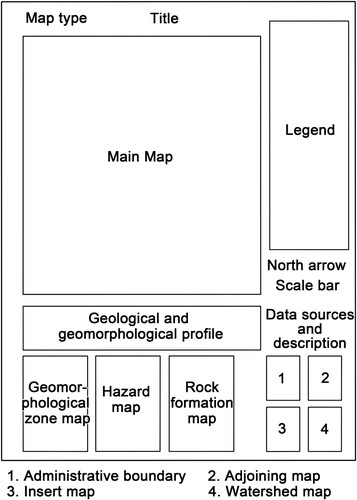
Figure 5. Layers of Caotun GHTM.
4.2.1. Symbology
Symbology should account for spatial dimensions, visual variables, and levels of measurement (CitationSlocum et al., 2008). We used the suggestions from the group and focus group panel interviews to simplify the symbology by
Applying hillshade layer to the bottom layer: Hillshade can be used to illustrate surface relief for various features, such as gullies, which can help users identify these features and understand the steepness of landform features.
Adding public facilities: Public facilities, such as schools, police departments, local government offices, fire departments, and hospitals, which are essential in hazard response management, were labeled on the map. These facilities can also help users identify relative location.
Simplifying mass wasting landform categories: To reduce the complexity of the symbols and increase the map’s readability, a single symbological design was used for rock fall scarps, debris slide scarps, and rock slides ().
Replacing low-certainty fault lines, ephemeral streams and abandoned channels with dashed lines: Because the certainty of the fault lines varied across the study area, certainty was differentiated through four symbological styles. To differentiate ephemeral streams and abandoned channels from the perennial rivers, we used dashed lines as symbology ().
Establishing a standard for road network placement: The density of road networks varied across the study area. Major roads were prioritized in the plain areas, and most road networks were included in the hilly and mountainous areas to help users identify locations and features. The standards were peculiarity, continuity, and importance. (i) Peculiarity: The road was included if only one road was present in an area and if the map could be misinterpreted if the road were omitted. (ii) Continuity: The road was connected to adjacent regions or the road was long and its omission would cause the map to be misinterpreted. (iii) Importance: The road was a local landmark or strongly associated with local characteristics.
Differentiating landform categories with colors: To clearly distinguish landforms, colors were assigned to each category. Purple, red, blue, and gray and black were used for the neotectonic, mass wasting, fluvial, and anthropogenic landforms, respectively.
Table 5. Adjustment to symbology.
4.2.2. Side maps
After considering the suggestions of the civil engineers and educators, we created a geological and geomorphological profile and three side maps, namely (1) geomorphological zone map, (2) hazard map, and (3) rock formation map. The geological profile (A-A’; location indicated in ) was based on the geological map, and the geomorphological zones were listed at the top of the profile. Three hazard zone layers associated with mass wasting, debris flow, and flooding hazards were presented in the hazard map. The mass wasting hazards were those of rock fall, debris slump and slide, and rock slides. Six PDFTs were presented in the study area, and all torrents were in the Fengyuan Hill area. The PDFTs were government designated because of their proximity to settlements, and all of the debris flow fans, regardless of whether they were designated as PDFTs, were illustrated on the main map. We included an inundation layer indicating which areas will be inundated based on modeling of rainfall amount up to 650 mm within 24 h. In addition, the rock formation layers were generalized on the basis of the thickness of the primary and secondary formations in a rock formation side map.
5. Discussion
5.1. User-centered GHTM design
The purpose of this study was to create a user-centered GHTM design for users who were not geomorphological experts (i.e. civil engineer and educators) and could benefit from experience with knowledge of geomorphological maps. The outcomes of the group and focus group panel interviews indicated that the two targeted user groups had different preferences for mapping designs. The engineers suggested including more detailed information (i.e. landform genesis, age, lithology, structure and morphology, and hazard-related features) associated with their work. For example, rock lithology is essential for debris source identification and size estimation (). Engineering designs involve variability and uncertainty, and other studies have suggested that a comprehensive geomorphological investigation is required for large-scale construction or alteration projects (CitationGriffiths, 2014; CitationGriffiths & Lee, 2021) because these projects can have prolonged effects on the environment (CitationKondolf, 1997; CitationMossa & Chen, 2022; CitationSurian, 1999). As geospatial techniques have improved, geomorphologists have begun to work with engineers to identify geomorphological features and quantify risks (CitationGriffiths & Lee, 2021). CitationLee (2001) reported that three major forms of geomorphological mapping including regional surveys of terrain conditions, general assessments of geohazards and resources, and specific purpose surveys, are applicable to engineering design. Unlike large scale (i.e. 1:1000), specific purpose survey maps, the Caotun GHTM is medium scale (1:25000) and has a simple design (). Therefore, it can serve as a regional survey map that provides a more holistic view of the region. In Taiwan, managers and planners associated with hazard management often have backgrounds in civil engineering, and their work is associated with the response and recovery stages of hazard management. By employing a GHTM, these managers and planners can effectively differentiate the dynamics of landform features to develop more comprehensive mitigation plans.
The educators reported that clear and simple maps suited teaching. In the group interview, the educators provided opinions regarding the applicability of the GHTM to indoor and outdoor class settings. Because the educators were high school geography teachers, their main concern was that the maps would be understandable to students. Most educators indicated that the background of the sample map was overly complicated because it had too many geological and geomorphological features and colors. Unlike civil engineers, who are familiar with reading survey maps, high school students are not familiar with interpreting complicated information on maps. While the interviews revealed that the two groups had distinct preferences for the GHTM design, we used more suggestions from the educators ( and ) because our goal was to create a mapping design for nonexperts in geomorphology. The Caotun GHTM offers a general geomorphological background and provides intermediate-level information in a clear manner. The Caotun GHTM design was similar to that recommended for strategic planners in CitationMeyer et al. (2012) because it has high information density and complexity. According to CitationMeyer et al. (2012) strategic planners are professionals who make decisions regarding flood risk management and protection measures and have a sufficient amount of time to interpret maps.
5.2. Limitations and implications
Because the participants in the group and focus group panel interviews were asked open-ended questions, quantitative analysis could not be performed. A detailed questionnaire with a standard question design would enable quantitative analysis. CitationThompson et al. (2015) conducted a quantitative online survey to determine the effects of the design elements (e.g. feature classification and color scheme) of probabilistic volcanic hazard maps. Their quantitative survey indicated that red–yellow gradients are suitable for volcano hazard thematic maps. While we consulted only engineers and educators, additional stakeholders, such local authorities and nongovernmental organizations, should be involved in GHTM design (CitationMarti et al., 2019; CitationMeyer et al., 2012; CitationThompson et al., 2015). Input from a range of users would enable the development of an integrated design. Studies should consider using research techniques other than individual and group interviews, such as work observation, think-aloud protocols, and task analysis, to encourage the engagement of stakeholders and other users (Citationde Sherbinin et al., 2017; Citationde Sherbinin et al., 2019).
We applied secondary open-access data layers covering the entirety of Taiwan (). Therefore, the Caotun GHTM could protentially serve as a starting point for a GHTM series for Taiwan. Systematic national geomorphological hazard thematic mapping was used to develop the Land Condition Maps and Landform Classification Map for Flood Control Map series by the Geospatial Information Authority of Japan. This map series presents natural and anthropogenic landforms linked to flood related hazards (CitationGeospatial Information Authority of Japan, 2007). Studies should consider developing a GHTM on an online platform to offer flexibility with respect to comparing features associated with geomorphological hazard across time, space, and demographic areas, and the managers of such a platform can update the data layers. A multilayer, interactive user interface would enable stakeholders to explore the potential effects of hazards across the hierarchy of administrative divisions (CitationRetchless et al., 2021) and customize the layers to suit their needs.
Hazard management and communication maps can be presented as a series (i.e. survey, GHTM, and hazard zone maps). Although this study solely focused on GHTM, investigating other hybrid maps that contain hazard-related information would improve hazard communication. For example, the Land Condition Map by the Geospatial Information Authority of Japan includes both hazard-related geomorphological features and hazard zones and a detailed manual describing how users can determine the degree of risk (CitationGeospatial Information Authority of Japan, 2007). This enables stakeholders to retrieve information to facilitate decision-making.
6. Conclusion
Maps are crucial for hazard communication, and employing user-centered map designs can enhance the effectiveness of this communication process. Whereas most studies on user-centered design have focused on hazard zone maps, we investigated the designs of geomorphological hazard thematic maps (GHTMs) for nonexperts in geomorphology. We targeted civil engineers who designed structures and managed natural hazards, and educators who taught geography in high school as users, and invited them for group and focus group panel interviews. The interviewees were asked to answer open-ended questions regarding the design of the main and side maps of a sample map of Muzha in northern Taiwan developed in another study. The suggestions of the two user groups and professional cartographers were used to create a GHTM for Caotun in central Taiwan.
The group and focus group panel interviews revealed that the two groups had distinct preferences. The civil engineers favored details regarding geomorphological features, whereas the educators preferred clearer and simpler designs that would facilitate interpretation. Both groups reported that essential facilities and road networks are crucial on maps because they serve as reference points to determine location in the field. Because we sought to create a more generalized GHTM, we used more suggestions from the educators than from the engineers. Major adjustments we made to the sample map included hillshade layer, essential facilities, and road networks and changing the symbology for mass wasting, fault scarps, and fluvial landform features. With GHTMs, stakeholders can obtain a holistic understanding of a region and more comprehensively manage hazards. In addition, user-centered maps can be used to improve communication with the public and increase awareness of natural hazards. This study may serve as reference for user-centered geomorphological maps used for hazard assessment, management, and education.
Software
ESRI® ArcMap 10.X and ArcGIS Pro 2.X were applied to process vectors and raster data, and create main map and side map elements. CorelDRAW was utilized to compile map elements and enhance details for the final map product.
Caotun Map.pdf
Download PDF (49.9 MB)Acknowledgement
We thank National Science and Technology Center for Disaster Reduction, Taiwan, ROC for providing funding (project #NCDR -S-107019, NCDR -S-108030, PI: Su-Min Shen), Yu-Cheng Kang for preparing Muza Map and Chin-Chern Kao for cartographic suggestions.
Disclosure statement
No potential conflict of interest was reported by the author(s).
Data availability statement
The data that support the findings of this study are available from the corresponding author, S.-M. Shen, upon reasonable request.
Additional information
Funding
References
- Bera, A., Mukhopadhyay, B. P., & Das, D. (2019). Landslide hazard zonation mapping using multi-criteria analysis with the help of GIS techniques: A case study from Eastern Himalayas, Namchi, South Sikkim. Natural Hazards, 96(2), 935–959. https://doi.org/10.1007/s11069-019-03580-w
- Bishop, M. P., James, L. A., Shroder, J. F., & Walsh, S. J. (2012). Geospatial technologies and digital geomorphological mapping: Concepts, issues and research. Geomorphology, 137(1), 5–26. https://doi.org/10.1016/j.geomorph.2011.06.027
- Blais-Stevens, A., & Behnia, P. (2016). Debris flow susceptibility mapping using a qualitative heuristic method and Flow-R along the Yukon Alaska Highway Corridor, Canada. Natural Hazards and Earth System Sciences, 16(2), 449–462. https://doi.org/10.5194/nhess-16-449-2016
- Central Geological Survey. (2008). Duhuiqu ji zhouyuan podi huanjing dizhi ziliao kutuji [Geological database of urban and surrounding slope region environment]. Central Geological Survey Ministry of Economic Affairs.
- Central Geological Survey. (2019, August 1). Geological map for Taichung and Nantou. Central Geological Survey Ministry of Economic Affairs. https://gis3.moeacgs.gov.tw/
- Central Geological Survey. (Unpublished). Airborne laser scanning (ALS) LiDAR data for Caotun area. Central Geological Survey Ministry of Economic Affairs.
- Chang, J.-C. (1996). Natural hazards in Taiwan. GeoJournal, 38(3), 251–257. https://doi.org/10.1007/BF00204716
- Chang, J.-C., Yang, G.-S., & Shen, S.-M. (2002). Taiwandao hejie dixing ziliaoku de jianzhi (1/3) - Beibu diqu [Report of trenching and paleoearthquake research program (1/3) - Construction of database of fluvial terraces, Northern Taiwan]. Central Geological Survey Ministry of Economic Affairs.
- Chang, J.-C., Yang, G.-S., & Shen, S.-M. (2003). Taiwandao hejie dixing ziliaoku de jianzhi (2/3) - Nanbu diqu [Report of trenching and paleoearthquake research program (2/3) - Construction of database of fluvial terraces, Southern Taiwan]. Central Geological Survey Ministry of Economic Affairs.
- Chelli, A., Bordoni, M., Cappadonia, C., Pepe, G., Rotigliano, E., & Smith, M. (2021). Geomorphological tools for mapping natural hazards. Journal of Maps, 17(3), 1–4. https://doi.org/10.1080/17445647.2021.1920794
- Cheng, J. D., Huang, Y. C., Wu, H. L., Yeh, J. L., & Chang, C. H. (2005). Hydrometeorological and landuse attributes of debris flows and debris floods during typhoon Toraji, July 29–30, 2001 in central Taiwan. Journal of Hydrology, 306(1), 161–173. https://doi.org/10.1016/j.jhydrol.2004.09.007
- Demek, J. (1972). Manual of detailed geomorphological mapping (pp. 1–368). Czechoslovak Academy of Sciences.
- de Sherbinin, A., Apotsos, A., & Chevrier, J. (2017). Mapping the future: Policy applications of climate vulnerability mapping in West Africa. The Geographical Journal, 183(4), 414–425. https://doi.org/10.1111/geoj.12226
- de Sherbinin, A., Bukvic, A., Rohat, G., Gall, M., McCusker, B., Preston, B., Apotsos, A., Fish, C., Kienberger, S., Muhonda, P., Wilhelmi, O., Macharia, D., Shubert, W., Sliuzas, R., Tomaszewski, B., & Zhang, S. (2019). Climate vulnerability mapping: A systematic review and future prospects. WIREs Climate Change, 10(5), e600. https://doi.org/10.1002/wcc.600
- Dilley, M., Chen, R. S., Deichmann, U., Lerner-Lam, A. L., & Arnold, M. (2005). Natural disaster hotspots: A global risk analysis (Vol. 5). World Bank Publications. https://documents1.worldbank.org/curated/en/621711468175150317/pdf/344230PAPER0Na101official0use0only1.pdf
- Dottori, F., Salamon, P., Bianchi, A., Alfieri, L., Hirpa, F. A., & Feyen, L. (2016). Development and evaluation of a framework for global flood hazard mapping. Advances in Water Resources, 94, 87–102. https://doi.org/10.1016/j.advwatres.2016.05.002
- Farabollini, P., De Pari, P., Discenza, M. E., Minnillo, M., Carabella, C., Paglia, G., & Miccadei, E. (2021). Geomorphological evidence of debris flows and landslides in the Pescara del Tronto area (Sibillini Mts, Marche Region, Central Italy). Journal of Maps, 17(3), 90–99. https://doi.org/10.1080/17445647.2020.1827055
- Geospatial Information Authority of Japan. (2007). Tochi jōkenzu no sūchi de-ta o shiyōshita: Kanbenna saigai kikensei hyōka shuhō [Manual of digital data for land condition map: A brief method to estimate the degree of risk for hazard]. Geospatial Information Authority of Japan. https://www1.gsi.go.jp/geowww/landcondition/manual.pdf
- Geospatial Information Authority of Japan. (2010). Tochi jōken chōsa kaisetsusho - Hakodate chiku [Guide book for Land Condition Map - Hakodate Area]. https://www1.gsi.go.jp/geowww/landcondition/report/D001-temp-004u.pdf
- Griffiths, J. S. (2014). Feet on the ground: Engineering geology past, present and future. Quarterly Journal of Engineering Geology and Hydrogeology, 47(2), 116–143. https://doi.org/10.1144/qjegh2013-087
- Griffiths, J. S., & Abraham, J. K. (2008). Factors affecting the use of applied geomorphology maps to communicate with different end-users. Journal of Maps, 4(1), 201–210. https://doi.org/10.4113/jom.2008.89
- Griffiths, J. S., & Lee, E. M. (2021). Geomorphology in environmental management 1965–2000. Geological Society, London, Memoirs, 58, 135–149. https://doi.org/10.1144/m58-2020-22
- Haynes, K., Barclay, J., & Pidgeon, N. (2007). Volcanic hazard communication using maps: An evaluation of their effectiveness. Bulletin of Volcanology, 70(2), 123–138. https://doi.org/10.1007/s00445-007-0124-7
- Henstra, D., Minano, A., & Thistlethwaite, J. (2019). Communicating disaster risk? An evaluation of the availability and quality of flood maps. Natural Hazards and Earth System Sciences, 19(1), 313–323. https://doi.org/10.5194/nhess-19-313-2019
- Klimaszewski, M. (1982). Detailed geomorphological maps. ITC Journal, 3, 265–271.
- Kondolf, G. M. (1997). Profile: Hungry water: Effects of dams and gravel mining on river channels. Environmental Management, 21(4), 533–551. https://doi.org/10.1007/s002679900048
- Lee, E. M. (2001). Geomorphological mapping. Geological Society, London, Engineering Geology Special Publications, 18(1), 53–56. https://doi.org/10.1144/GSL.ENG.2001.018.01.08
- Luke, A., Sanders, B. F., Goodrich, K. A., Feldman, D. L., Boudreau, D., Eguiarte, A., Serrano, K., Reyes, A., Schubert, J. E., AghaKouchak, A., Basolo, V., & Matthew, R. A. (2018). Going beyond the flood insurance rate map: Insights from flood hazard map co-production. Natural Hazards and Earth System Sciences, 18(4), 1097–1120. https://doi.org/10.5194/nhess-18-1097-2018
- Mandarino, A., Luino, F., & Faccini, F. (2021). Flood-induced ground effects and flood-water dynamics for hydro-geomorphic hazard assessment: The 21–22 October 2019 extreme flood along the lower Orba River (Alessandria, NW Italy). Journal of Maps, 17(3), 136–151. https://doi.org/10.1080/17445647.2020.1866702
- Marti, M., Stauffacher, M., & Wiemer, S. (2019). Difficulties in explaining complex issues with maps: Evaluating seismic hazard communication – the Swiss case. Natural Hazards and Earth System Sciences, 19(12), 2677–2700. https://doi.org/10.5194/nhess-19-2677-2019
- Meyer, V., Kuhlicke, C., Luther, J., Fuchs, S., Priest, S., Dorner, W., Serrhini, K., Pardoe, J., McCarthy, S., Seidel, J., Palka, G., Unnerstall, H., Viavattene, C., & Scheuer, S. (2012). Recommendations for the user-specific enhancement of flood maps. Natural Hazards and Earth System Sciences, 12(5), 1701–1716. https://doi.org/10.5194/nhess-12-1701-2012
- Morrow, B. H., Lazo, J. K., Rhome, J., & Feyen, J. (2015). Improving storm surge risk communication: Stakeholder perspectives. Bulletin of the American Meteorological Society, 96(1), 35–48. https://doi.org/10.1175/BAMS-D-13-00197.1
- Morss, R. E., Demuth, J. L., Lazrus, H., Palen, L., Barton, C. M., Davis, C. A., Snyder, C., Wilhelmi, O. V., Anderson, K. M., Ahijevych, D. A., Anderson, J., Bica, M., Fossell, K. R., Henderson, J., Kogan, M., Stowe, K., & Watts, J. (2017). Hazardous weather prediction and communication in the modern information environment. Bulletin of the American Meteorological Society, 98(12), 2653–2674. https://doi.org/10.1175/BAMS-D-16-0058.1
- Mossa, J., & Chen, Y.-H. (2022). Geomorphic response to historic and ongoing human impacts in a large lowland river. Earth Surface Processes and Landforms, 47(6), 1550–1569. https://doi.org/10.1002/esp.5334
- National Land Surveying and Mapping Center. (2018). Taiwan e-Map, Taiwan Map Service. https://maps.nlsc.gov.tw/
- Otto, J.-C., Gustavsson, M., & Geilhausen, M. (2011). Chapter nine - cartography: Design, symbolisation and visualisation of geomorphological maps. In M. J. Smith, P. Paron, & J. S. Griffiths (Eds.), Developments in earth surface processes (Vol. 15, pp. 253–295). Elsevier. https://doi.org/10.1016/B978-0-444-53446-0.00009-4
- Paron, P., & Claessens, L. (2011). Chapter four - makers and users of geomorphological maps. In M. J. Smith, P. Paron, & J. S. Griffiths (Eds.), Developments in earth surface processes (Vol. 15, pp. 75–106). Elsevier. https://doi.org/10.1016/B978-0-444-53446-0.00004-5
- Retchless, D., Mobley, W., Davlasheridze, M., Atoba, K., Ross, A. D., & Highfield, W. (2021). Mapping cross-scale economic impacts of storm surge events: Considerations for design and user testing. Journal of Maps, 17(1), 123–135. https://doi.org/10.1080/17445647.2021.1940325
- Sanders, B. F., Schubert, J. E., Goodrich, K. A., Houston, D., Feldman, D. L., Basolo, V., Luke, A., Boudreau, D., Karlin, B., Cheung, W., Contreras, S., Reyes, A., Eguiarte, A., Serrano, K., Allaire, M., Moftakhari, H., AghaKouchak, A., & Matthew, R. A. (2020). Collaborative modeling with fine-resolution data enhances flood awareness, minimizes differences in flood perception, and produces actionable flood maps. Earth's Future, 8(1), e2019EF001391. https://doi.org/10.1029/2019EF001391
- Segoni, S., Tofani, V., Rosi, A., Catani, F., & Casagli, N. (2018). Combination of rainfall thresholds and susceptibility maps for dynamic landslide hazard assessment at regional scale. Frontiers in Earth Science, 6. https://doi.org/10.3389/feart.2018.00085
- Seijmonsbergen, A. C. (2013). The modern geomorphological map. In J. F. Shroder (Ed.), Treatise on geomorphology (pp. 35–52). Academic Press. https://doi.org/10.1016/B978-0-12-374739-6.00371-7
- Servizio Geologico d'Italia. (1994). Carta geomorfologia d'Italia 1.50.000. Istituto superiore per la protezione e la ricerca ambientale.
- Servizio Geologico d'Italia. (2007). Carta Geomorfologica d'Italia 1:50.000 - Guida alla rappresentazione cartografica. Istituto superiore per la protezione e la ricerca ambientale. https://www.isprambiente.gov.it/it/pubblicazioni/periodici-tecnici/i-quaderni-serie-iii-del-sgi/carta-geomorfologica-ditalia-1-50-000-guida-alla
- Shen, S.-M., Chang, J.-C., Yang, G.-S., Lin, C.-M., & Su, H.-C. (2005). Dizhen dizhi diaocha ji huodong duanceng ziliaoku jianzhi jihua: Huodong gouzao dixing panshi ji ziliaoku jianzhi fenxi (1/2) [Report of landform interpretation and database construction of active structures (1/2)]. Central Geological Survey Ministry of Economic Affairs.
- Shen, S.-M., Lo, C.-M., & Wang, S. (2017). Xizhihua dizhi dimao tezheng ditu zhizuo yazjiu [Report of advance research on geomorphological mapping]. National Science and Technology Center for Disaster Reduction.
- Shen, S.-M., Lo, C.-M., & Wang, S. (2018). Jiangou fangzai dixing fenlei yu ditu zhitu guifan yanjiu [Report of construction of landform classification and map specifications for geomorphological map]. National Science and Technology Center for Disaster Reduction.
- Slocum, T. A., Mcmaster, R. M., Kessler, F. C., & Howard, H. H. (2008). Thematic cartography and geographic visualization (3rd ed.). Prentice Hall.
- Soil and Water Conservation Bureau. (2019). Tushiliu qianshi xiliu [Potential debris flow torrents]. https://data.coa.gov.tw/OpenData
- Surian, N. (1999). Channel changes due to river regulation: The case of the Piave River, Italy. Earth Surface Processes and Landforms, 24(12), 1135–1151. https://doi.org/10.1002/(SICI)1096-9837(199911)24:12<1135::AID-ESP40>3.0.CO;2-F
- Teng, W.-H., Hsu, M.-H., Wu, C.-H., & Chen, A. S. (2006). Impact of flood disasters on Taiwan in the last quarter century. Natural Hazards, 37(1), 191–207. https://doi.org/10.1007/s11069-005-4667-7
- Thaler, T., & Seebauer, S. (2019). Bottom-up citizen initiatives in natural hazard management: Why they appear and what they can do? Environmental Science & Policy, 94, 101–111. https://doi.org/10.1016/j.envsci.2018.12.012
- Thompson, M. A., Lindsay, J. M., & Gaillard, J. C. (2015). The influence of probabilistic volcanic hazard map properties on hazard communication. Journal of Applied Volcanology, 4(1), 6. https://doi.org/10.1186/s13617-015-0023-0
- Water Resources Agency. (2016). Taiwan yanshui qianshitu- Disandai (2014–2016) [Inundation probability maps - 3rd Version (2014–2016)]. https://wra.bse.ntu.edu.tw/flood-riskmap/
- Yang, G. S., & Shen, S.-M. (2010). Taiwan quanzhi - Juan 2, Tudizhi - Dixingpian [Taiwan chronicles - vol. 2, Land- Geomorphology]. In Taiwan Historica (pp. 627). Taiwan Historica.