
 ?Mathematical formulae have been encoded as MathML and are displayed in this HTML version using MathJax in order to improve their display. Uncheck the box to turn MathJax off. This feature requires Javascript. Click on a formula to zoom.
ABSTRACT
Nightlife in urban areas is gaining interest due to its role as a stimulus of the local economy, tourism, safety, and public services. However, most studies analyse nighttime activity from a qualitative perspective and at a general urban scale, without going into a detailed spatial analysis. In this paper, we have used the spatio-temporal details of Google Places data, and the activity trends at a variety of facilities that provide Google Popular Times. We studied and mapped the recovery of nighttime activity in the city of Madrid after the pandemic restrictions. The results reveal that there was a significant decrease of over 80% in the activity levels of open premises, which also led to a decrease in their average occupancy rate. These reductions were particularly noticeable in the city center and during the late-night hours.
1. Overview
Traditionally, urban geography has focused on daytime activities and on the geographies of everyday life, ignoring nighttime activities (Citationvan Liempt et al., 2015). However, in recent years there has been a growing interest in studying the nightlife in cities, especially the role of the so-called ‘nighttime economy’ and its capacity for stimulating the economy of urban centres. Nighttime activities are a major attraction for the urban economy due to their direct connection to leisure and tourism. In fact, since the end of the last century, many local governments began to promote nightlife as one of the main revitalisers of urban centres (CitationHeath, 1997; CitationLovatt & O’Connor, 1995). In addition, the growing attention to nightlife is also related to its effects on issues such as safety and violence, gender, ethnic and social integration/exclusion perspectives, as well as to the importance of nightlife for the planning and provision of public services.
The nightlife or nighttime economy comprises the activities that take place from 6 p.m. to 6 a.m., although hours may vary depending on regions and local customs. Also, it is usually related to activities such as catering, shopping, culture, recreation, festivals, events, sports, and tourism (CitationLin et al., 2022). The scientific literature on nightlife initially focused on these leisure and cultural activities, and on the role of cultural revitalisation strategies to enhance the vitality of urban centres beyond the closing hours of shops and regular activities (CitationHadfield, 2015). Some works focused on the impact that this nighttime revitalisation had on urban centres, including its security implications and the resulting damage to urban spaces (CitationShaw, 2014). Recently, attention has focused on the economic impact of this nightlife revitalisation and on analysing who benefits and who is negatively affected by the decisions and policies that shape urban nightlife.
Reviews such as (CitationLovatt & O’Connor, 1995), (CitationYeo & Heng, 2014) or (CitationLin et al., 2022) provide examples of research in this area. In most studies, the characterization and measurement of nighttime activities tend to have a general economic impact view of the city or a qualitative view that does not focus on spatial analysis or local differences within the city. This is mainly explained by the limited availability of data with sufficient spatial and temporal resolution to allow for a highly spatially disaggregated approach. However, modern cities integrate countless sensors of various types which collect large volumes of geo-referenced data quickly and at low cost. Apart from these sensors, we also have the geo-referenced information generated by the population itself through their mobile phones and the social networks they use (Location Based Social Networks, LBSNs) (CitationMartí et al., 2019). Geo-referenced big data provide a more detailed spatial analysis and real-time monitoring with a fine granularity. This growing amount of data associated with new sources and the big data revolution gives us a detailed insight into nightlife.
The aim of this paper is to explore the possibilities offered by the data retrieved from Location Based Social Networks for mapping nighttime activity and assessing the impact of the pandemic on these activities, and the and subsequent recovery. Specifically, we used data from Google Places and its activity according to Google Popular Times (GPT) to analyse the impact of the COVID-19 pandemic on nightlife in the city of Madrid.
Few works have used Google Places and GPT data to study urban activities. Google Places points of interest (POIs) provide rich information to analyse the distribution of land use (CitationYao et al., 2017) and to predict mobility (CitationCui et al., 2018) or assess pollution levels (CitationLu et al., 2018). However, only a few studies have also used GPT information and, in such cases, they did it to explain and predict public transport demand (CitationMahajan et al., 2021; CitationVitello et al., 2023). Another study used GPT to assess the impact of extreme weather events on activity decline (CitationSantiago-Iglesias et al., 2023). All these works demonstrate the usefulness of this source for exploring the spatio-temporal patterns of urban activities, in particular the understudied aspect of nightlife.
In our work, we focused our analysis on the spatial aspects of nightlife by mapping two distinct periods: one affected by the restrictions and limitations on mobility and nightlife during the pandemic, and another period once pandemic restrictions were lifted. We conducted the analysis using spatio-temporal analysis techniques in Geographic Information Systems (GIS). The results and mapping obtained allowed us to assess the impact of the restrictions on the city’s nightlife, as well as to analyse the pace of recovery and the spatial patterns and trends during the recovery. In our opinion, this spatial analysis provides a deeper understanding of a city’s nightlife and can be very useful for urban planners. A better understanding of the geographical distribution of nightlife makes it possible to work towards improving the quality of life in cities and to offer a more diverse and inclusive nightlife experience to residents and visitors.
2. Case study
Madrid is the most populated city in Spain, with 3.3 million inhabitants in 2020. Madrid is well known for its nightlife, with more than 20,000 restaurants and entertainment (CitationMadrid City Council, 2023) that were severely impacted during the COVID-19 pandemic. With the outbreak of the pandemic, a state of emergency was declared in the country, resulting in a nationwide lockdown that began on 14 March 2020. The lockdown led to the closure of non-essential activities such as restaurants, entertainment, and services unrelated to health and food. On May 2nd, a new phase of de-escalation began towards the so-called ‘a new normality’. This de-escalation phase ended on the 21st of June, marking the end of the nationwide state of emergency. From that moment on, restrictions were implemented at regional level.
In the specific case of Madrid, the following measures were adopted in the following months: (1) curfew from 23 h to 6 h, (2) limitation of establishments’ capacity, with a maximum of 4 people per table indoors, and of 6 people per table on the terrace in the case of bars and restaurants, (3) division of the territory into health zones and, depending on the evolution of cases, possibility of confinements in specific areas, (4) closure of nightlife establishments, such as pubs and night clubs.
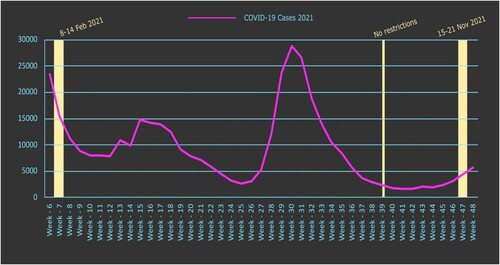
These restrictions were lifted on 20 September 2021, and the city’s nightlife resumed gradually. shows the evolution of COVID cases in Madrid between February 2021 and November 2021.
Figure 1. Evolution of COVID-19 cases in Madrid between February 2021 and November 2021. Source: Data from the Ministry of Health of Spain. https://www.sanidad.gob.es/
3. Data & periods
Data used in this paper and in the main map were retrieved from Google Places and Google Popular Times (GPT). Google Places is currently one of the most comprehensive POI databases containing land use attributes of a city because data are disaggregated at the level of individual venues, providing its precise location, and activity category. GPT shows the busyness of a venue and is available at some specific places and specific times, so time-varying levels of activity demand can be deduced considering the activity type associated with the POI having GPT data.
The POI and GPT data used were obtained through a Python download process. While POI data are available via Google Places API CitationGoogle (2024), GPT data are not. Alternatively, we developed a web crawler for downloading GPT data. For interested readers, we refer to the open resources of a GitHub Repository (CitationM-wrzr, 2024) and a Python library (CitationLivePopularTimes, 2024) that help to download the GPT data, and we modified our web crawler codes based on them. Initially, the download consisted of 7,728 points of interest (POI) in the city of Madrid. Not all POIs broadcast live all the time, so those who do not broadcast live during the dates and times of this study are left out. In any case, it is a very large and representative sample, which is distributed homogeneously over the city.
From this initial set, a subset of data was extracted from the POIs that had been broadcasting live at night (21 – 01 h) in order to obtain a schedule, a couple of hours before the closing restrictions (23 h) and two hours after. Furthermore, the selection of these hours for the focus on nightlife is grounded in the rhythm of Spanish culture when it comes to dining out and socializing with friends or family (CitationMedina, 2005). With the aim of analysing the impact of the restrictions and the effects of the pandemic, two different weeks were considered: 8th to 14th February 2021, and 15th to 21st November 2021.
These two-time points allowed us to collect data from a situation conditioned by pandemic restrictions and from one where the restrictions had already been lifted. We selected a first week somewhat distant in time from the strictest moments of the lockdown, which in the city of Madrid affected a significant part of 2020 and meant the complete closure of all nightlife activity. The chosen week of February 2021 saw a surge in COVID cases and was a time of significant restrictions. During this period, perimeter confinements were imposed in several health areas in the city of Madrid. As a counterpart to the week of restrictions, we chose a second week of return to normality in November 2021.
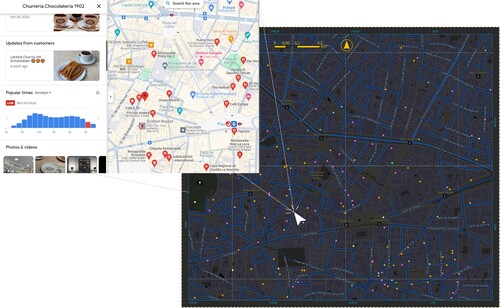
The data downloaded were: (1) Name, type, and address of POI, (2) number and rating of opinions, (3) average occupancy history and (4) POI’s occupancy at the time of download. The latter datum was only available for POIs broadcasting ‘live’ from GPT. All POIs were geolocated with latitude and longitude coordinates and were incorporated into a GIS, in this case, ArcGIS Pro. shows the activity profile of a venue, with its historical occupations (in blue) and its ‘live’ occupation at the time of downloading (in red) for one of the restaurant premises.
Figure 2. Information from Google Places. Source: The image was obtained by searching for a point of interest on the Google website.
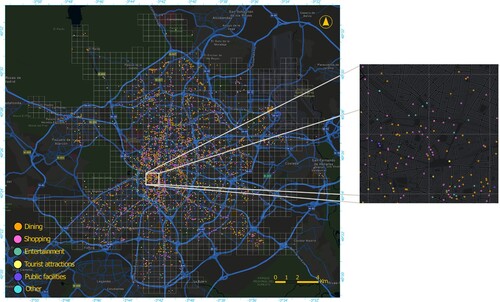
Google classifies POIs into 87 different types of activity. Based on this classification, we grouped them into 6 categories: Dining (3,423 POIs), Entertainment (106), Tourist attractions (363), Public facilities (314), Shopping (2,855) and Other (667).
4. Methods
4.1. Temporal and spatial analysis
In the first step, we analysed the differences in the total number of venues broadcasting live and the average occupancy of these venues during the two-week period under evaluation. These two variables were also analysed in terms of the days of the week and of each hour within the nighttime slot.
The analysis of the spatial distribution was performed by incorporating the POI data into a grid of 1,641 regular cells with a size of 500 × 500 metres (). This grid corresponds to the urban area of the city of Madrid. With the geolocation of the POIs, we calculated the number of POIs active each hour and in each of the grid cells, as well as the average occupancy of those POIs at that hour. The analysis was conducted for the two scenarios (February and November 2021). In the analysis of the differences between both scenarios, we used two different times during the night: 21 h and 23 h. In the main map and in the results shown here, the focus was on the Dining category, since it is the largest category and the one that most clearly represents nightlife-related activities. It also represents the activities most affected by the pandemic restrictions.
Figure 3. Map of POIs classified by category in the urban area of Madrid. Source: Prepared by the authors using Google Places.
4.2. Time series clustering analysis
The spatio-temporal analysis retrieves the data for the entire nighttime slot (from 21 h to 1 h) for the two scenarios under study. The analysis was performed on the basis of a Time Series Clustering analysis in which the spatio-temporal cubes were created with ArcGIS Pro software. The spatial reference of the cube is the grid of 500 × 500 metre cells. The vertical axis represents the time dimension ‘t’. All days of the week and the five one-hour slots between 21 h and 1 h were considered. The Time Series Clustering method identifies the locations in a Space-Time Cube (STC) that are most similar and partitions them into distinct clusters in which members of each cluster have similar time series characteristics (CitationAghabozorgi et al., 2015). To measure the similarities in occupancy, the Euclidean distance between the values of the time series for each cell is employed. This value is computed by taking the square root of the sum of squared differences in values over time. For instance, considering the data from two cells, y
, with their respective time series being (
,
, … ,
,
) and (
,
, … ,
,
) where
represents the average occupancy on Sunday at 22:00 in a cell
. The Euclidean distance between cells
y
would be:
This method clusters cells based on the similarity of their time series values, focusing on how close the occupancy values are over time. The number of clusters is selected using the pseudo F-statistic Calinski-Harabasz, which is a ratio of the variance between clusters to the variance within the cluster.
5. Results
5.1. Time evolution
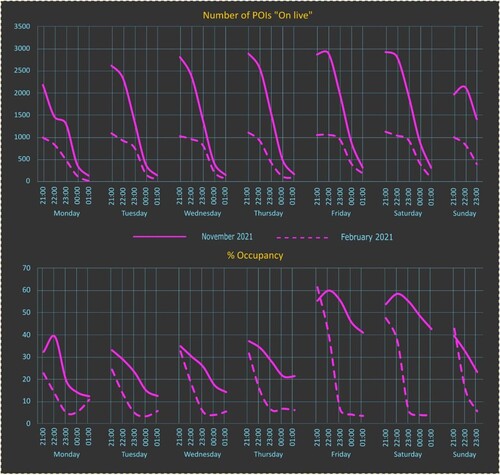
The total number of venues broadcasting live at some time during the night increased by more than 86%, with peaks of more than 130% in the 22 h slot. This increase was mainly due to the recovery of leisure activities, especially bars and restaurants (Dining category). In fact, among open POIs, the weight of bars and restaurants increased from 50.8% at 22 h in February to 62.9% in November ().
Table 1. POIs active for each hour and increase in the second period vs. the first one.
On working days, the number of POIs classified as Dining activities that were broadcasting live peaked at 21 h and declined sharply after 22 h. However, during the weekends (Friday, Saturday, and Sunday), the peak extended until 22 h and 23 h in the week of November. The drop in activity as a result of the pandemic significantly reduced the differences between the 21 h and the 23 h slots, and even between the working and the non-working days. After 23 h, the fact that no venues were open was due to restrictions.
The effect of restrictions during the week of February 2021 is even clearer in the hourly average occupancy profiles (). The closure of venues at 23 h is perfectly reflected in a drop in occupancy levels during the whole week, with a reduction in occupancy to less than 5% at that hour. In November 2021, average occupancies were always higher, especially during the weekend. Also, the decline in average occupancy was more gradual. It should be noted that during the week of November – on Fridays and especially on Saturdays – the peak of occupancy in venues was extended until 1 am.
Figure 4. Weekly evolution of the number of POIs in the ‘Dining’ category broadcasting live and average occupancy during the night. Source: Prepared by the authors with data from Google Places.
5.2. Spatial analysis
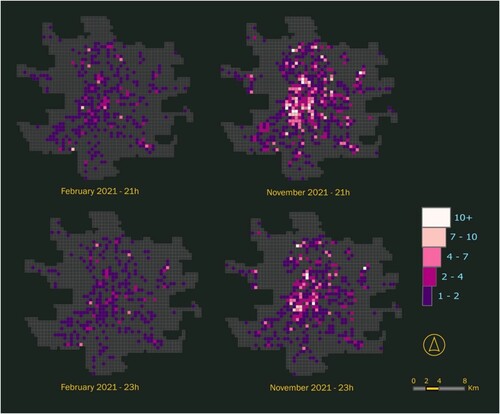
shows the spatial distribution of bars and restaurants in the municipality of Madrid broadcasting live on Google Places. Four specific moments of the Madrid night are shown: two in February 2021 (21:00 and 23:00 h) and two in November 2021 (21:00 h and 23:00 h). The maps show a big difference in the number of venues between the two periods, with very low densities in February 2021 in both time slots. The difference with November is particularly striking at 21 h. The city center’s most common nightlife areas had higher active venue densities in November, reflecting a ‘return to normality’. In fact, these central leisure spaces were particularly affected by the pandemic. Thus, it is noteworthy that the highest densities during February were not in the central area, but in scattered cells of the periphery.
Figure 5. Distribution of bars and restaurants broadcasting live (municipality of Madrid). Source: Prepared by the authors with data from Google Places.
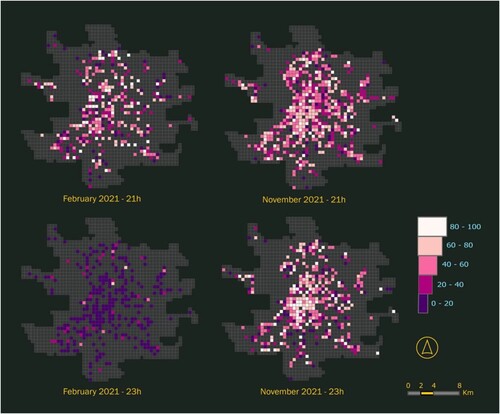
shows the average occupancy of active bars and restaurants in each of the cells in the municipality of Madrid. As with the POIs broadcasting live, the differences in average occupancy between the two periods were very significant. In February 2021, occupancy considerably decreased, especially at 23 h due to closing restrictions. The situation was not so pronounced at 21 h. However, in November, the occupancy of bars and restaurants at 21 h and 23 h was more concentrated in the city centre, a situation that did not arise in February.
Figure 6. Distribution of occupancy in bars and restaurants broadcasting live (municipality of Madrid). Source: Prepared by the authors with data from Google Places.
5.3. Spatio-temporal analysis
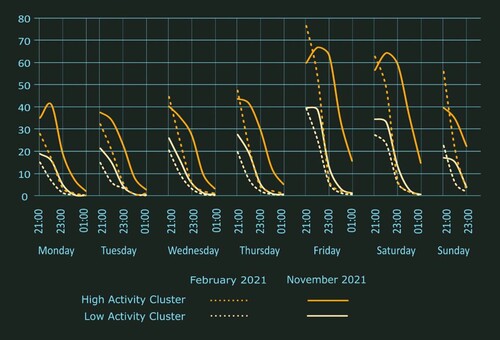
With the results of the spatio-temporal analysis, we identified areas with similar occupancy patterns throughout the nighttime period and the weeks under study ( and ). Two clusters were identified, differentiated mainly by the intensity of activity. In both periods, cluster 1 corresponds to the high activity zones, but for the first period (February 2021), it can be seen that the total number of active POIs in both clusters dropped drastically after 21 h. However, in the time profile of the second period (November 2021), in the high activity cluster, the total number of active venues did not decline drastically, but rather gradually during the course of the night. Also, during the weekend, peak hours extended almost until midnight. A noteworthy observation is that, during the February 2021 period, the high-activity cluster had more occupancy than in November. After a strict lockdown, the population was eager to go out and return to normality. With fewer establishments available, those that remained open experienced higher occupancy rates, and the peak of occupancy occurred earlier due to changes in habits driven by time restrictions. Typically, the peak of occupancy occurs between 22:00 and 23:00, as seen in November 2021
Figure 7. Spatio-temporal cluster for both periods, February 2021 and November 2021. Source: Prepared by the authors with data from Google Places.
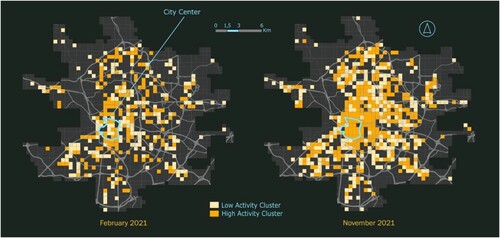
Figure 8. Time profile of the clusters for both periods. Source: Prepared by the authors with data from Google Places.
The high-activity cluster shows the areas with higher activity for bars and restaurants. In February, it can be observed that these areas are not located in the city center (Gran vía, Sol) but in residential areas. People did not travel to the city center but stayed in the establishments near their residences. On the other hand, In November, with no restrictions, the situation was quite different since the cells in the central area of Madrid and near to it were the ones with the highest occupancy levels.
6. Conclusions
Data from Location-Based Social Networks (LBSNs) have created new research opportunities, expanding spatial analysis and mapping of urban issues that have been understudied or studied in a general way (CitationArribas-Bel et al., 2015; CitationMartí et al., 2019). For example, Twitter has been used as a source to study mobility to urban green spaces and facilities (CitationOsorio Arjona & García Palomares, 2020; CitationSalas-Olmedo & Rojas Quezada, 2017), whereas other sources, such as the locations from geo-located Flickr images, have been used to map the visual magnitude of popular tourist sites (CitationBartie & Mackaness, 2016). As we mentioned, Google Places and GPT had been previously used to study urban activities. However, previous works did not look at the mapping of these sources to deepen the analysis of urban nightlife.
The pandemic had a significant impact on nighttime activities, particularly those related to leisure. After the lockdowns imposed in most of the world’s cities and the temporary closure of venues, when they reopened, they did not do so in the same way as before COVID. On the contrary, certain restrictions were in place for quite some time, which conditioned a new normality influenced by the definitive closure of some venues and changes in the habits of the population. That is why it is important to analyse how the recovery of nightlife in the city takes place. In this paper, we have conducted a detailed mapping to study the specific case of Madrid. Madrid was hit hard by the pandemic but was also one of the first cities to open up nightlife and to establish more permissive restrictions on this sector. We have seen the effects of the restrictions caused by the pandemic (capacity limits, early closing, ban on using the bar counter, limits on the number of people per table, etc.), but also the process of recovery to a situation that is increasingly similar to that of 2019.
The data and methods used in this research can be replicated in other spaces and have important implications for economic, social, and policy-making processes. The ability to make a spatio-temporal analysis of the recovery of nighttime activities due to events as significant as the pandemic, or other events of lesser impact, can be quite interesting for the management of smart cities. Spatial analysis makes it possible to identify the most affected areas, and also those that have recovered more quickly. The high spatial and temporal disaggregation of LBSN allows for the design of effective policies that reduce vulnerability and increase the resilience of our cities.
Software
Data were downloaded with Phyton. The analysis and initial mapping were done in ArcGIS Pro, while the final map composition was done in Inkscape 1.1.
Declaration of interest statement
The authors declare that they have no known competing financial interests or personal relationships that could have appeared to influence the work reported in this paper.
MainMap.pdf
Download PDF (32 MB)Acknowledgments
This paper is part of the projects of R&D+i DARUMA (PCI2020-120706-2/AEI/10.13039/501100011033/) and NEWGEOMOB (MCIN-AEI/10.13039/501100011033/Project PID2020-116656RB-I00). The authors would like to thank Dr. Vishal Mahajan, a former research associate at the Technical University of Munich, for creating and modifying the codes for downloading GPT data.
Disclosure statement
No potential conflict of interest was reported by the authors.
Data availability statement
The authors do not have the permission to share the data.
Additional information
Funding
References
- Aghabozorgi, S., Seyed Shirkhorshidi, A., & Ying Wah, T. (2015). Time-series clustering – A decade review. Information Systems, 53, 16–38. https://doi.org/10.1016/j.is.2015.04.007
- Arribas-Bel, D., Kourtit, K., Nijkamp, P., & Steenbruggen, J. (2015). Cyber cities: Social media as a tool for understanding cities. Applied Spatial Analysis and Policy, 8(3), 231–247. https://doi.org/10.1007/s12061-015-9154-2
- Bartie, P., & Mackaness, W. (2016). Mapping the visual magnitude of popular tourist sites in Edinburgh city. Journal of Maps, 12(2), 203–210. https://doi.org/10.1080/17445647.2014.1001453
- Cui, Y., Meng, C., He, Q., & Gao, J. (2018). Forecasting current and next trip purpose with social media data and Google Places. Transportation Research Part C: Emerging Technologies, 97, 159–174. https://doi.org/10.1016/j.trc.2018.10.017
- Google. (2024). Google Places API. Retrieved April 24, 2024, from https://developers.google.com/places/web-service/overview
- Hadfield, P. (2015). The night-time city. Four modes of exclusion: Reflections on the urban studies special collection. Urban Studies, 52(3), 606–616. https://doi.org/10.1177/0042098014552934
- Heath, T. (1997). The twenty-four hour city concept – A review of initiatives in British cities. Journal of Urban Design, 2(2), 193–204. https://doi.org/10.1080/13574809708724404
- Lin, V. S., Qin, Y., Ying, T., Shen, S., & Lyu, G. (2022). Night-time economy vitality index: Framework and evidence. Tourism Economics, 28(3), 665–691. https://doi.org/10.1177/13548166211042970
- LivePopularTimes. (2024). Retrieved April 24, 2024, from https://pypi.org/project/LivePopularTimes/
- Lovatt, A., & O’Connor, J. (1995). Cities and the night-time economy. Planning Practice & Research, 10(2), 127–134. https://doi.org/10.1080/02697459550036676
- Lu, T., Zhang, W., & Hankey, S. (2018). Leveraging Google Place of Interest (POI) data, crowdsourcing, and machine learning to predict urban NO2 concentrations for the contiguous U.S. ISEE Conference Abstracts, 2018(1), https://doi.org/10.1289/isesisee.2018.O01.04.08
- Madrid City Council. (2023). Open data portal (Local Census). Retrieved April 24, 2024, from https://datos.madrid.es/portal/site/egob
- Mahajan, V., Cantelmo, G., & Antoniou, C. (2021). Explaining demand patterns during COVID-19 using opportunistic data: A case study of the city of Munich. European Transport Research Review, 13(1), 1–14. https://doi.org/10.1186/s12544-021-00485-3
- Martí, P., Serrano-Estrada, L., & Nolasco-Cirugeda, A. (2019). Social media data: Challenges, opportunities and limitations in urban studies. Computers, Environment and Urban Systems, 74, 161–174. https://doi.org/10.1016/j.compenvurbsys.2018.11.001
- Medina, F. X. (2005). Food culture in Spain. Greenwood Publishing Group.
- M-wrzr. (2024). Populartimes. GitHub. Retrieved April 24, 2024, from https://github.com/m-wrzr/populartimes
- Osorio Arjona, J., & García Palomares, J. C. (2020). Spatio-temporal mobility and twitter: 3D visualisation of mobility flows. Journal of Maps, 16(1), 153–160. https://doi.org/10.1080/17445647.2020.1778549
- Salas-Olmedo, M. H., & Rojas Quezada, C. (2017). The use of public spaces in a medium-sized city: From Twitter data to mobility patterns. Journal of Maps, 13(1), 40–45. https://doi.org/10.1080/17445647.2017.1305302
- Santiago-Iglesias, E., Carpio-Pinedo, J., Sun, W., & García-Palomares, J. C. (2023). Frozen city: Analysing the disruption and resilience of urban activities during a heavy snowfall event using Google Popular Times. Urban Climate, 51, 101644. https://doi.org/10.1016/j.uclim.2023.101644
- Shaw, R. (2014). Beyond night-time economy: Affective atmospheres of the urban night. Geoforum, 51, 87–95. https://doi.org/10.1016/j.geoforum.2013.10.005
- van Liempt, I., van Aalst, I., & Schwanen, T. (2015). Introduction: Geographies of the urban night. Urban Studies, 52(3), 407–421. https://doi.org/10.1177/0042098014552933
- Vitello, P., Fiandrino, C., Connors, R., & Viti, F. (2023). Exploring the potential of Google Popular Times for transit demand estimation. Transportation Research Board (TRB) 102nd Annual Meeting, Washington, DC, 8-12 January.
- Yao, Y., Li, X., Liu, X., Liu, P., Liang, Z., Zhang, J., & Mai, K. (2017). Sensing spatial distribution of urban land use by integrating points-of-interest and Google Word2Vec model. International Journal of Geographical Information Science, 31(4), 825–848. https://doi.org/10.1080/13658816.2016.1244608
- Yeo, S. J., & Heng, C. K. (2014). An (extra)ordinary night out: Urban informality, social sustainability and the night-time economy. Urban Studies, 51(4), 712–726. https://doi.org/10.1177/0042098013489743