
ABSTRACT
The study area (Asturias, NW Spain) is a mountainous region extending over 10,000 km2, where shallow landslides triggered after heavy rainfall episodes are very frequent and pose a major threat and hazard to infrastructure and human populations, causing frequenteconomic losses and damage. In this regard, Shallow Landslide Susceptibility Mapping (SLSM) represents a very powerful tool for managers and agencies dealing with landslide hazards and land planning. Here we produced an SLSM based on basic geological/geomorphological maps and a heuristic approach. The regional-scale model built here has a cell resolution of 50 m and combines bedrock geology, and surface deposits mapped at a1:25k scale together with a digital slope model. The resulting map was compared with two local inventories of landslides, giving a goodness of fit of 80 and 77.5%. To better understand the results, the erroneous data have been reviewed individually and the causes of error were analysed.
1. Introduction
Landslides induced by prolonged and heavy rainfall are frequent and widespread in mountainous regions, posing significant hazards that can cause damage to human populations and result in economic losses. As with many other natural and geological hazards, appropriate land planning will prevent these damages and losses (CitationRuff & Czurda, 2008). Consequently, the development of regional-scale, landslide-susceptibility maps constitutes a very useful tool for the administrations and agencies in charge of land planning (CitationFell et al., 2008; CitationGazibara et al., 2023; Citationvan Westen et al., 2006).
The landslide susceptibility map done by CitationBrabb et al. (1972) broke new ground in the assessment of landslide susceptibility, by proposing a methodology that ‘portrays only those geologic factors that bear directly on the susceptibility of specific areas to landsliding’. Since then, geological and geomorphological maps have typically been applied to develop derived maps aimed at defining and delineating areas prone to landslide instability. Since the 1990s, digital terrain models (DTM), thematic maps and spatial analysis using GIS software have been the main tools for building Susceptibility Map of Shallow Landslides (SLSM), and several workflows and approaches have been developed (CitationCarrara et al., 1991, Citation1995; CitationChung et al., 1995; CitationChung & Fabbri, 2008; CitationGazibara et al., 2023; CitationGoetz et al., 2011; CitationGuzzetti et al., 1999; CitationHuang et al., 2020; CitationMenéndez-Duarte et al., 2003; CitationNandi & Shakoor, 2009; CitationPourghasemi et al., 2014; CitationPradhan et al., 2019; CitationRemondo et al., 2003; CitationSalciarini et al., 2012; CitationSoeters & van Westen, 1996; CitationSujatha & Rajamanickam, 2011; Citationvan Den Eeckhaut et al., 2010; CitationVergari et al., 2011). Used properly, these maps constitute an essential guidance document for urban planners, helping them to optimise the effort invested in designing corrective measures.
In many reviews of landslide-susceptibility, hazard, and vulnerability assessments, e.g. Citationvan Westen et al. (2006) or CitationReichenbach et al. (2018), four main approaches have been identified that can be followed in the development of landslide susceptibility maps: i. probabilistic models based on landslide inventories; ii. heuristic models; iii. statistical (bivariate or multivariate statistics) models; and iv. deterministic models. Probabilistic and statistical models are based on the analysis of numerical relationships between instability factors and the distribution of landslides. Deterministic models are physical models that simulate the physical laws governing stability/instability conditions. In the heuristic or expert-driven approach, investigators rank the known instability factors according to their assumed or expected importance in causing landslides.
A heuristic approach was used in this study; expert criteria are used to infer the type and degree of hazard for each area, using either a direct mapping or indirect qualitative map combination (CitationBarredo et al., 2000; CitationCastellanos-Abella & van Westen, 2008; Citationvan Westen et al., 2006). Heuristic models combining geology, geomorphology, and relief information for landslide-susceptibility assessment have been developed, for instance, by CitationBarredo et al. (2000), CitationDymond et al. (2006), CitationRuff and Czurda (2008), CitationDemoulin and Chung (2007), CitationWang and Peng (2009) or Citationvan Den Eeckhaut et al. (2010). An important advantage of heuristic models is that they do not require an extensive inventory of landslides for their construction. In this regard, we cannot ignore the fact that the acquisition of landslide inventories is costly and subject to important biases (CitationBucci et al., 2021; CitationGuzzetti et al., 2012; CitationMurillo-García & Alcántara-Ayala, 2017), which in turn represents a critical advantage compared to probabilistic or statistical models (CitationGuzzetti et al., 2012; CitationSmith et al., 2021; Citationvan Westen et al., 2006). Nevertheless, landslide-susceptibility models are conditioned by the data available for their validation (CitationGuzzetti et al., 2006), especially in the case of heuristic models (i.e. CitationRuff & Czurda, 2008), since they rely heavily on expert criteria. If some landslide inventory were available, then they could be used for comparison with heuristic models and to assess their performance (CitationGuzzetti et al., 2006; CitationMenéndez-Duarte et al., 2003; CitationRemondo et al., 2003; CitationRossi et al., 2010).
In this research, we wanted to test whether (or not) susceptibility maps constructed using a limited number of variables and applying some common criteria over a broad area could be successful in predicting rainfall-induced landslides at a regional scale. To do so, we combined geological, geomorphological and slope maps to develop a regional-scale shallow landslide susceptibility map (SLSM). The map was validated using an inventory of shallow landslides (CitationMenéndez Duarte, 1994) and some recent shallow landslides triggered by heavy rainstorms. Finally, the errors found were discussed in order to better understand the strengths and weaknesses of the map.
2. Study area
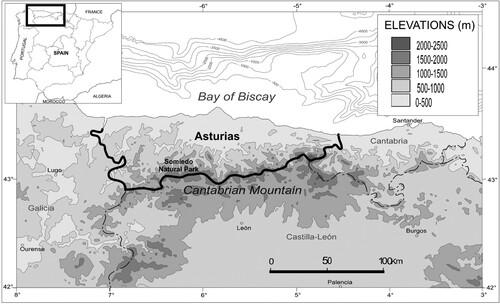
The region of Asturias is located in the northwest of Spain and covers an area of approximately 10,000 km2. It is bordered by the Cantabrian Sea to the north and the Cantabrian Mountains to the south (). The entire region is characterised by a mountainous relief, including hundreds of peaks higher than 2,000 m, well scattered along the approximately E-W summit axis of the mountain range. The average slope of the hillsides often exceeds 20 degrees, and rivers are deeply incised into the bedrock and typically flow through steep valleys. Only along the coastline, the relief is somewhat smoother due to the exhumation of a paleo-cut wave platform (CitationAlvarez-Marron et al., 2008; CitationLópez-Fernández et al., 2020).
Figure 1. Location of study area (Asturias region in the northwest of Spain).
The geology of the region is largely known and mapped, since it is one of the best-preserved foreland thrust and fold belt of the European Variscides (i.e. CitationAlonso et al., 2009; CitationJulivert, 1971; CitationMarcos & Pulgar, 1982; CitationPérez Estaún & Bastida, 1990; CitationPérez-Estaún et al., 1988). The dominant basement consists of sedimentary Palaeozoic rocks, alternating siliciclastic (slate, sandstone, and quartzite) and calcareous (mostly limestones) formations. Moreover, in the east-central sector, low deformed Mesozoic rocks of varied lithologies are disposed unconformable and overlying the deformed Paleozoic basement. The region underwent significant deformation during the Variscan Orogeny. However, the modern relief is the topographic expression of the convergent regime experienced by the Iberian and Eurasian plates during the Cenozoic (CitationAlvarez-Marron et al., 1997; CitationFernández et al., 2021; CitationPulgar et al., 1996).
The deep incision of the drainage network conditioned the present-day relief. As a result, slope dynamics are mainly controlled by mass-wasting activity and locally by torrential dynamics. Large deep mass movements have been identified and mapped in many areas, most of which are now dormant (CitationJiménez Sánchez, 2002; CitationMenéndez-Duarte & Marquínez, 1996; CitationRodríguez-Rodríguez et al., 2018) and only occasionally are active processes (CitationCuervas-Mons et al., 2021; CitationDomínguez-Cuesta et al., 2022). Furthermore, rock falls and, to a lesser extent, large-scale rock-avalanches are frequent on rocky and steep slopes (CitationFernández et al., 2021; CitationMarquínez et al., 2003; CitationMenéndez-Duarte & Marquínez, 2002; CitationRodríguez-Rodríguez et al., 2023).
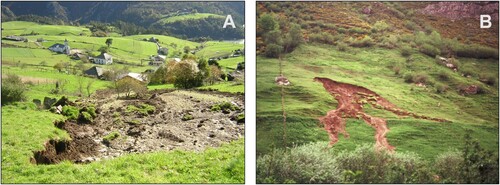
Most of the slopes are mantled by regolith, which is composed of several lithological types and textures. On these mantled slopes, present-day mass wasting processes are dominated by soil creep and small and shallow mass movements or lanslides (mudflows, debris flows, and small slides) with a maximum size of tens of meters (). These shallow landslides, locally called ‘argayos’, are usually associated with episodes of heavy rainfall (CitationDomínguez Cuesta et al., 1999; CitationDomínguez-Cuesta et al., 2021; CitationValenzuela et al., 2018a, Citation2018b, Citation2019). These processes are frequent and often disrupt transport infrastructures, with critical economic consequences and occasionally loss of life. In this research, the susceptibility map has been created for these small rainfall-induced landslides.
Figure 2. Some examples of rainfall-induced landslides cases in the study area. (A) Shallow landslide triggered on colluviums above slate, and (B) Shallow landslide triggered on old mass movement deposit.
3. Materials and methods
3.1. Landslide susceptibility model
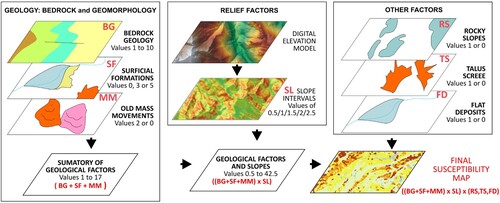
Landslide susceptibility is assessed and mapped by combining bedrock geology, geomorphologic (surface deposits) and slope maps. A qualitative weighting of these variables was applied to produce the GIS-based SLSM ().
Figure 3. Workflow followed to develop the shallow landslide susceptibility map. All the cartographic information has been managed in matrix format and combined according to the operations indicated in the flowchart.
Slope information was derived from a 50-m digital elevation model (DEM). For bedrock geology and surface deposits (colluvial, alluvial, residual), geological and geomorphological maps at a 1:25k scale were obtained from the CTAPA (Environmental Thematic Cartography of the Principality of Asturias https://sigvisor.asturias.es/SITPA/). In this digital repository, the bedrock geological map is provided in shapefile format (ESRI vectorial format) and was elaborated based on the MAGNA project of the Geological and Mining Institute of Spain (IGME). The geomorphological map is also stored, as a separate data layer, in shapefile format. This map was produced by CTAPA on the basis of detailed fieldwork. Both cartographies have been used as independent layers, resulting in two different inputs into the model (bedrock geology and surface deposits), each with its own weighting (see below). These two GIS layers are converted to a 50 m cell size matrix format with the same resolution as the DEM. A ‘maximum area’ criterion was followed when converting from vector to matrix format; that said, when more than one single feature fell within the same cell, the value assigned was that of the feature occupying the largest area.
3.1.1. Bedrock geology map
About 150 geological formations of sedimentary rocks are mapped in 1:25k scale geological maps of Asturias. These formations were grouped into 13 lithological classes and assigned a weighting between 1 and 10, with the highest value (10) corresponding to the formations most prone to instability and the lowest to the most competent lithologies. summarizes the criteria that were considered to assign these weightings. The aim was to construct a lithological map based on engineering properties rather than stratigraphic classification (CitationBrabb et al., 1972; Citationvan Westen et al., 2008). The results of the 13 classes employed and the weight assigned to each one are given in . A numerical model (in matrix format) was derived from the relative weight of bedrock geology on landslide susceptibility, covering the entire study area. This derived map is the ‘Layer BG’ in .
Table 1. Criteria used to assign weights to bedrock geology units according to their lithology and meaning – favorable or unfavorable – in the development of shallow landslides.
Table 2. Weights are assigned to bedrock geology units, based on the criteria shown in Table I. A higher weight indicates higher favorability for the development of instabilities and involves a greater value in the susceptibility map.
3.1.2. Map of surface deposits
The map of surface deposits available in the CTAPA repository is very detailed and contains more than 72 different types, classified according to genetic and lithological criteria. These 72 types have been simplified to distinguish only three classes based on the presence and abundance of the sandy-clay matrix. This very simplified map of surface deposits may be compared to an ‘engineering soil map’ (Citationvan Westen et al., 2008) describing all loose materials on top of the bedrock and classifying them according to their geotechnical properties. The derived map is the ‘Layer SF’ in , whose values vary according to the dominant lithology of the surface deposit ().
Table 3. Weight is assigned to cells with surficial deposits according to their sandy-clay matrix content.
The combination between bedrock geology (layer BG) and surface deposits (layer SF) was made by summing the values of these two raster; in both cases, a higher value represents a cell most prone to instability, obtaining a relative susceptibility map with a value between 1 and 15. Moreover, an extra value – two extra points – was added to those cells that fall over deposits of ancient mass movements. The reason for this weighting is that field observations and previous work (CitationDomínguez Cuesta et al., 2007; CitationMenéndez-Duarte et al., 2011; CitationNyssen et al., 2003) suggest that a fundamental factor in the development of slope instability is the presence of a significant thickness of loose material covering the rock substrate. Consequently, a new matrix layer was created (Layer MM in ) with a value of 2 in cells corresponding to mass movements and zero in the rest. This model was added to the previous creating a new raster containing values ranging from 1 to 17 (‘Sumatory of Geological Factors’ in ).
3.1.3. Digital slope model
The initially continuous slope values were then grouped into five intervals and a weighting score was assigned to each interval (; Layer SL of ). This weighting multiplied the values of the matrix model resulting from the combination of geological and geomorphological layers, and a relative susceptibility map was obtained with values ranging from 0.5 to 42.5 (‘Geological Factors and Slopes’ in ).
Table 4. Slope intervals were used to build the susceptibility map and weights were given (multiplication factor) to each of these intervals.
3.1.4. Rocky areas and flat deposits
Finally, rocky areas, talus scree deposits and flat deposits (areas mapped with alluvial deposits, estuaries, and other types of deposits typical of plains) were excluded. Although rocky areas and talus scree deposits are affected by other instability processes, they are not prone to the development of shallow landslides due to the lack of regolith or soil cover. Flat deposits are not subject to instability processes and do not form part of slopes.
The rocky areas and flat deposits were extracted from the CTAPA maps and converted to matrix format (Layers RS, TS and FD in ) by assigning a zero value to the cells corresponding to them, regardless of the value that the cell may have due to the combination of the other variables.
3.1.5. Shallow landslide susceptibility map (SLSM)
The Asturias shallow landslide susceptibility map is a matrix GIS layer with continuous values from 0 to 42.5. The values displayed in the raster map give specific weight to geology, geomorphology and slope, but exclude the cells corresponding to rocky areas, talus scree deposits and flat deposits. Such continuous values are discretised into five susceptibility levels: Very Low susceptibility (cells with 0-value corresponding to rocky areas and flat deposits); and Low, Medium, High, and Very High susceptibility, which have been defined after reclassifying the values ranging from 0.5 to 42.5 into four equal-area intervals. According to the specific weight of bedrock geology (BG), surface formations (SF), mass movements (MM) and slope (SL) and discounting rocky slopes (RS), talus scree (TS) and flat areas (FA), susceptibility model of shallow landslides might be expressed by the equation: SLSM = ((BG+SF+MM) x SL) x (RS,TS,FD).
3.1.6. Validation of the susceptibility map
The SLSM was validated using compiled shallow landslide data from two sources: i) shallow landslides reported in the local press and triggered after two heavy rainstorms episodes (June 2010 and November 2003) that were analysed in the field (); and ii) a cartographic inventory of 93 scars and shallow landslide deposits mapped in a 200 km2 zone of the study area ( and ).
Figure 4. Rainfall-induced landslide triggered by November 2003 rainfall: (A) Buscabreiro and (B) Zelúan. Map fragments show the location of the landslide on the susceptibility map. In both cases, the location of the rainfall-induced landslide on cells classes as Very High Susceptibility is related to the presence of surficial deposits (colluvium deposits).
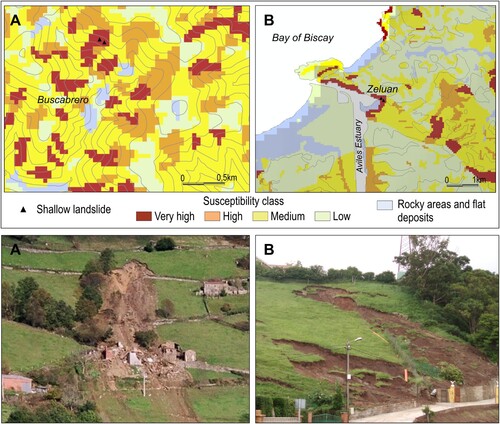
Figure 5. Rainfall-induced landslide triggered by November 2003 rainfall (Cabañaquinta) (A) Location of the landslide on the bedrock geology map, and (B) location of the landslide on the susceptibility model; the landslide falls on a cell classed as Low Susceptibility due to the proximity of a limestone level (see text).
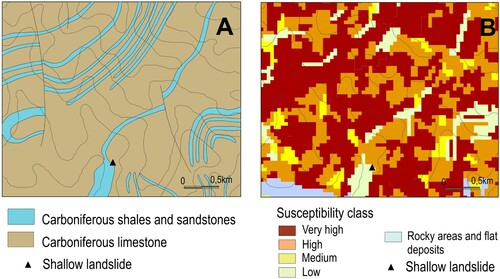
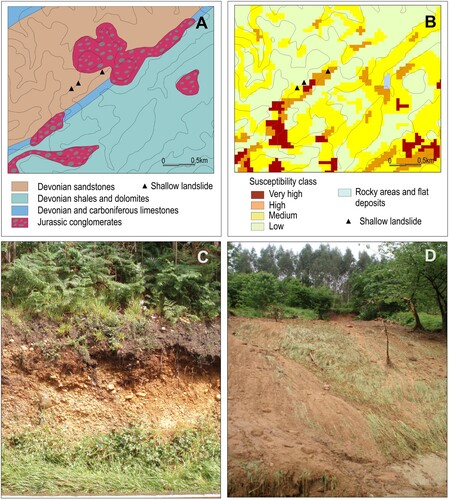
Figure 6. Rainfall-induced landslide triggered by June 2010 rainfall (Viescas) (A) Location of the landslides on the bedrock geology map, (B) location of the landslides on the susceptibility model, (C) unconsolidated conglomerates and sands in which the landslides were triggered (probably tertiary conglomerates and sands, see text) and (D) photograph showing one of the landslides.
In the first case, rainfall-induced landslides reported in the regional press (a total of 10 localities) were visited. Seven landslides occurred immediately after the heavy rains of 15th-17th November 2003 and three others after the heavy rains of 10th-11th of June 2010. All of these landslides were georeferenced, photographically reported and analysed during the fieldwork.
In the second case, the cartography of 93 shallow landslides, mapped in detail in the context of a geomorphological study of the Somiedo Natural Park (CitationMenéndez Duarte, 1994), was compared with the SLSM. The material involved in these landslides and their respective morphologies suggests that they were also triggered after heavy rainfall episodes, even though the exact date of these landslides is not known.
All landslides were cross-checked with the SLSM and classified according to their respective susceptibility level. Although the accuracy of the map is high in both cases (see results), some errors can also be observed. In order to better understand the results, the erroneous data were examined individually and the causes of the errors were analysed.
4. Results
4.1. The shallow landslides susceptibility map (SLSM)
When viewed globally, the susceptibility map shows two main areas of high susceptibility: (1) the north-central zone of the region, resulting from the predominance of poorly consolidated Mesozoic and Cenozoic rock formations (sands, clays and marls); and (2) the south-central zone, where carboniferous shale and sandstone predominate in combination with high average slopes and abundant old mass movements. In the rest of the region, the most susceptible areas basically follow the main traits of the geological structure, in good agreement with the alternation of more or less resistant materials. On a regional scale, the zones of rocky areas and rock screes (in some cases quite extensive) are also well represented on the map, as are the alluvial plains associated with the major rivers. Finally, a strip of low susceptibility parallel to the coastline is associated with the paleo-cut wave platform. By zooming in on the map, we can appreciate that the shallow landslide susceptibility is mainly controlled by the presence/absence and type of surface deposits, as well as by the variability of local slopes.
4.2. Comparison of susceptibility map with shallow landslides triggered by heavy rainfall episodes
The comparison of the available field information on shallow landslides triggered by heavy rains (November 2003 and June 2010) with the SLSM yields the results shown in . Seven of the ten documented landslides fall on cells classified as Very High susceptibility. Concerning the remaining three, one occurred in unclassified areas of the map (urban areas), while the other two occurred in zones classified as low and medium susceptibility.
Table 5. Summary and brief description of rainfall-induced landslides visited after two periods of heavy rain in the study area.
Several of the satisfactorily assigned cases corresponded to the presence of surface deposits. For instance, this is the case of the Buscabreiro and Zeluán landslides (), which fell over pixels classified as ‘Very high susceptibility’ in the SLSM and which correlate well with the presence of colluvium deposits. Moreover, in , we can notice that the lithological groups with the second highest registration of shallow landslides are carboniferous shales and sandstone, which are particularly frequent in the south-central zone of the region.
However, two of the landslides reported in the press took place in areas classified as Low (Cabañaquinta), and Low to Medium susceptibility (Viescas) ( and ). In the case of Cabañaquinta (), the instability was triggered over shales, but only at the contact with limestones. Therefore, it is very likely the SLSM misclassified this cell as Low susceptibility due to the contact with limestones and pixel inaccuracies following the conversion of the geological map from vector to matrix format. Thus, the error can be considered somehow as a ‘boundary error’ associated with the vector conversion to matrix format.
In the case of Viescas (), three landslides occurred over model cells classified as High, Medium and Low susceptibility. According to the available geological map, the landslides occurred over a Devonian formation composed of shales and dolomites. However, during the fieldwork, we observed that the landslides actually occurred over unconsolidated conglomerates and colluvium derived from these conglomerates. These conglomerates are named as Jurassic conglomerates on the original geological map, but: (1) the areal delimitation of these conglomerates in the map is smaller than the actual extent observed in the field; and (2) Jurassic conglomerates in this region are normally consolidated material, but the conglomerates observed in the field are unconsolidated materials; we believe they are probably younger, most likely similar to the Tertiary conglomerates and sands found in the vicinity. Thus, the errors detected appear to be associated with some deficiencies and inaccuracies in the original bedrock geology map.
4.3. Comparison of susceptibility map with the shallow landslide inventory
The comparison of the compiled cartographic inventory of shallow landslides with the susceptibility map yields the results shown in : 77.5% of the previously mapped shallow landslides coincide with areas classified as Very High and High susceptibility (more than 60% as Very High) in the map. We find these results very encouraging.
Table 6. Shallow landslides in each class of susceptibility. The total number of landslides is 93 (cartographic inventory in an area of 200 km2).
Nevertheless, they remain some poorly classified landslides. The highest percentage of them corresponds to landslides located over ‘non-susceptible’ areas: flat deposits or rocky areas. More specifically, of the nine shallow landslides that fall over these cells (), five are over flat areas and four over rocky areas. A careful analysis of these cases of misclassification suggests that they might be considered as `boundary errors’ created after converting the input thematic layers from vector to matrix format. Two examples of these poorly classified landslides are shown in (landslides over cells assigned to flat surficial deposits) and (landslides over cells assigned to rocky areas).
Figure 7. (A) Shallow landslides, belonging to the landslide cartographic inventory, superimposed on the geomorphologycal map (surficial deposits and rocky areas map), and (B) the same landslides superimposed on the Susceptibility Model (matrix format 50×50 m cell). In figure A, it can be observed that some landslides are located over deposits of mass movement, very close to the contact between these deposits and alluvial plain. In the conversion to matrix format, the corresponding pixels have been assigned to the alluvial plain (flat surface deposits).
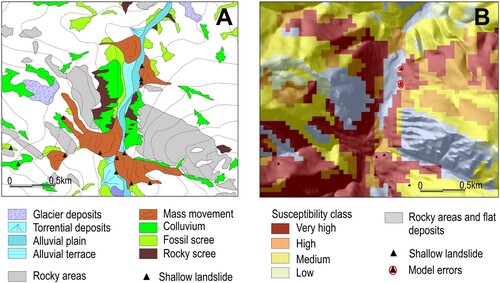
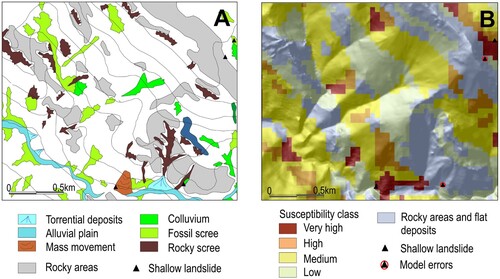
Figure 8. (A) Shallow landslides, belonging to the landslide cartographic inventory, superimposed on geomorphologycal map (surficial formation and rocky areas mapping), and (B) the same landslides superimposed on the Susceptibility Model (matrix format 50×50 m cell). Two shallow landslides were mapped next to the rocky areas (one of them on colluvium deposits) but in the matrix model, they are in a cell assigned to a rocky area.
5. Discussion
The SLSM built here gives an overall goodness of fit of 77.5% (), which, according to CitationGuzzetti et al. (2006), corresponds to a model that provides results between acceptable and very satisfactory. Indeed, our SLSM has successfully classified nine of the twelve recent cases of shallow post-rainfall landslides reported in the press (), which means a goodness of fit close to 80%. In addition, as we pointed out above, most of the errors or misclassifications detected cannot be attributed to the criteria considered in the map construction (), nor to the weighting of their specific coefficients (), but rather to inaccuracies related to the scale of the model or to an error in the original cartographic information.
Concerning error analysis, the main source of error is related to the generalisation of spatial information when converting vector data to a 50-metre cell size matrix format (, , ). Some of these errors could be rectified by using higher-resolution digital models of the study area. However, there are also questions about the use of a model constructed at a regional scale for the study of small-scale processes individually. The model presented here can be considered as a medium scale (1:100k to 1:25k). Following CitationCascini (2008), it should be used on an area of 1,000 to 10,000 km2, to develop landslide inventory and susceptibility mapping for regional development or very large-scale engineering projects and for preliminary level hazard zoning of local areas. A similar idea is expressed by CitationFell et al. (2008), who discussed the use of maps for site-specific decisions.
Another type of error was found in the quality of the available thematic maps. This is the case of Viescas (), where the bedrock geology map contains errors (incorrect cartography and incorrect lithological assignment) and there were some misclassifications. According to CitationGuzzetti et al. (2006), determining the errors associated with the geomorphologic, geological and other thematic information is not a trivial task.
Finally, the assignment of incorrect weights to some of the lithological classes is one of the problems commonly described for heuristic approaches (Citationvan Den Eeckhaut et al., 2010). This problem may also affect the model presented here, at least partially, in the case of Cabañaquinta (). There is a boundary error in this locality, but the adjacent pixels do not belong to the Very high Susceptibility category either, although these are very frequent in the area. There is probably an incorrect interpretation of the relationship between slope angle and bedrock lithology.
Nevertheless, these misclassifications and errors could be expected a priori, as any prediction of landslide susceptibility has some level of uncertainty. Sources of uncertainty include (1) errors and incompleteness in the landslide and thematic information available for the analysis; (2) an imperfect understanding of landslide processes and their geographical and temporal evolution; (3) limitations in the techniques used to determine the susceptibility; and (4) the inherent natural variability of landslide phenomena (CitationArdizzone et al., 2002; CitationCarrara et al., 1992; CitationGuzzetti et al., 2006). The important point is that although our map is still subject to some of these errors, we considered that overall our map has a high degree of accuracy. We believe that the workflow followed here provides a reliable alternative to deterministic or statistical/probability susceptibility mapping, which requires extensive detailed and high-resolution data, which are usually not available for the whole territory over large areas.
The susceptibility map presented here is based on very few variables and a model obtained using a reduced number of explanatory variables. This model is less expensive and, thus, superior to a model that uses a very large number of variables (CitationGuzzetti et al., 2006). Usually, from of all the possible factors controlling landslides, only a few can be cost-effectively acquired over extensive areas.
Since the early days of landslide susceptibility mapping, lithology and slope have been two common factors used in models, as seen in pioneers such as Brabb et al. (Citation1972) and recent works (CitationClerici et al., 2002; CitationDomínguez Cuesta et al., 2007; CitationKamp et al., 2008; CitationPradhan et al., 2019; Citationvan Den Eeckhaut et al., 2010). In this case, mapping the bedrock geology and geomorphology provides a good understanding of the causal factors of landslides in the study area. In addition to bedrock geology, we gave strong importance to the presence/absence of surface deposits (colluvial, alluvial, etc.) and the availability of detailed geomorphological mapping has been indispensable for the construction of the model. This conclusion was also supported by Citationvan Westen et al. (2003, Citation2006, Citation2008), CitationGuzzetti et al. (2012) or CitationReichenbach et al. (2018), who considered that detailed geomorphological mapping is essential to obtain reliable landslide hazard maps for large areas.
6. Conclusions
- The results obtained in this work support the hypothesis that heuristic models, accomplished with a limited number of variables and using common criteria for a large area, are useful tools for assessing the level of hazard associated with rainfall-induced landslides and for producing medium-scale landslide susceptibility maps.
- In our opinion, the main advantage of the methodology used here is that it can be applied to large areas, in the absence of region-wide landslide inventory maps. These inventories are necessary for the development of statistical and probabilistic susceptibility maps, and it is not easy to obtain them of the right quality for large areas.
- The main limitations of the heuristic-driven models are probably related to their strong dependence on the quality of the expert criteria, i.e. the quality of the resulting susceptibility map is strongly dependent on the experience of the earth-scientist. This makes validation of the final map essential, although validation is also required for all other possible approaches to landslide susceptibility modelling.
- Finally, we would like to emphasize that the high level of accuracy of our map is mainly due to the previous existence of detailed geological and geomorphological maps of good quality. This conclusion highlights the importance of having cartographic databases of high quality and up-to-date and of using these databases in territorial management strategies.
Software
The processing of the geographic data (vector thematic layers and digital elevation model), the spatial analysis (data reclassification, vector to raster conversion and layer overlapping) and the final output of the Shallow Landslide Susceptibility Map were carried out in ESRI’s ArcGIS 10.2.2.
RMDMapa.pdf
Download PDF (4.1 MB)Disclosure statement
No potential conflict of interest was reported by the authors.
Data availability statement
The data that support the findings of this study are available from the corresponding author, R. Menéndez-Duarte, upon reasonable request.
Additional information
Funding
References
- Alonso, J. L., Marcos, A., & Suárez, A. (2009). Paleogeographic inversion resulting from large out of sequence breaching thrusts: The León Faults (Cantabrian Zone, NW Iberia). A new picture of the external Variscan Thrust Belt in the Ibero-Armorican. Arc. Geol. Acta, 7(4), 451–473.
- Alvarez-Marron, J., Hetzel, R., Niedermann, S., Menendez-Duarte, R., & Marquínez, J. (2008). Origin, structure and exposure history of a wave-cut platform more than 1 Ma in age at the coast of northern Spain: A multiple cosmogenic nuclide approach. Geomorphology, 93(3-4), 316–334. doi:10.1016/j.geomorph.2007.03.005
- Alvarez-Marron, J., Rubio, E., & Torne, M. (1997). Alpine age subduction structures in the North Iberian Margin. Journal of Geophysical Research, 102(B10), 22495–22511. doi:10.1029/97JB01425
- Ardizzone, F., Cardinali, M., Carrara, A., Guzzetti, F., & Reichenbach, P. (2002). Uncertainty and errors in landslide mapping and landslide hazard assessment. Natural Hazards and Earth System Sciences, 2(1/2), 3–14. doi:10.5194/nhess-2-3-2002
- Barredo, J. I., Benavides, A., Hervas, J., & Van Westen, C. J. (2000). Comparing heuristic landslide hazard assessment techniques using GIS in the Trijana basin, Gran Canaria Island, Spain. JAG, 2(1), 9–23.
- Brabb, E. E., Pampeyan, E. H., & Bonilla, M. G. (1972). Landslide susceptibility in San Mateo County, California. U.S. Geological Survey Miscellaneous Field Studies, Map MF-360.
- Bucci, F., Santangelo, M., Fiorucci, F., Ardizzone, F., Giordan, D., Cignetti, M., Notti, D., Allasia, P., Godone, D., Lagomarsino, D., Pozzoli, A., Norelli, E., & Cardinali, M. (2021). Geomorphologic landslide inventory by air photo interpretation of the High Agri Valley (Southern Italy). Journal of Maps, 17(2), 376–388. DOI: 10.1080/17445647.2021.1943552
- Carrara, A., Cardinali, M., Detti, R., Guzzetti, F., Pasqui, V., & Reichenbach, P. (1991). Gis techniques and statisticsl models in evaluating landslide hazard. Earth Surface Processes and Landforms, 16(5), 427–445. doi:10.1002/esp.3290160505
- Carrara, A., Cardinali, M., & Guzzetti, F. (1992). Uncertainty in assessing landslide hazard and risk. ITC Journal, 2, 172–183.
- Carrara, A., Cardinali, M., Guzzetti, F., & Reichenbach, P. (1995). Gis technology in mapping landslide hazard. In A. Carrara, & F. Guzzetti (Eds.), Geographical information systems in assessing natural hazards (pp. 135–175). Kluwer Academic Publisher.
- Cascini, L. (2008). Applicability of landslide susceptibility and hazard zoning at different scales. Engineering Geology, 102(3-4), 164–177. doi:10.1016/j.enggeo.2008.03.016
- Castellanos-Abella, A., & van Westen, C. J. (2008). Qualitative landslide susceptibility assessment bymulticriteria analysis: A case study from San Antonio del Sur, Guantánamo, Cuba. Geomorphology, 94(3-4), 453–466. doi:10.1016/j.geomorph.2006.10.038
- Chung, C. F., & Fabbri, A. G. (2008). Predicting landslides for risk analysis — Spatial models tested by a cross-validation technique. Geomorphology, 94(3-4), 438–452. doi:10.1016/j.geomorph.2006.12.036
- Chung, C. F., Fabbri, A. G., & van Westen, C. J. (1995). Multivariante regression analysis for landslide hazard zonation. In A. Carrara, & F. Guzzetti (Eds.), Geographical information systems in assessing natural hazards (pp. 107–133). Kluwer Academic Publisher.
- Clerici, A., Perego, S., Tellini, C., & Vescovi, P. (2002). A procedure for landslide susceptibility zonation by the conditional analysis method. Geomorphology, 48(4), 349–364. doi:10.1016/S0169-555X(02)00079-X
- Cuervas-Mons, J., Domínguez-Cuesta, M. J., Mateos Redondo, F., Barra, A., Monserrat, O., Valenzuela, P., & Jiménez-Sánchez, M. (2021). Sentinel-1 data processing for detecting and monitoring of ground instabilities in the Rocky Coast of Central Asturias (N Spain). Remote Sensing, 13(16), 3076. https://doi.org/10.3390/rs13163076
- Demoulin, A., & Chung, C. F. (2007). Mapping landslide susceptibility from small datasets: A case study in the Pays de Herve (E Belgium). Geomorphology, 89(3-4), 391–404. doi:10.1016/j.geomorph.2007.01.008
- Domínguez-Cuesta, M. J., Quintana, L., Valenzuela, P., Cuervas-Mons, J., Alonso, J. L., & García Cortés, S. (2021). Evolution of a human-induced mass movement under the influence of rainfall and soil moisture. Landslides, 18(11), 3685–3693. https://doi.org/10.1007/s10346-021-01731-4
- Domínguez-Cuesta, M. J., Rodríguez-Rodríguez, L., López-Fernández, C., Pando, L., Cuervas-Mons, J., Olona, J., González-Pumariega, P., Serrano, J., Valenzuela, P., & Jiménez-Sánchez, M. (2022). Using remote sensing methods to study active geomorphologic processes on Cantabrian coastal cliffs. Remote Sensing, 14(20), 5139. https://doi.org/10.3390/rs14205139
- Domínguez Cuesta, M. J., Jiménez Sánchez, M., & Berrezueta, E. (2007). Landslides in the Central Coalfield (Cantabrian Mountains, NW Spain): Geomorphological features, conditioning factors and methodological implications in susceptibility assessment. Geomorphology, 89(3-4), 358–369. doi:10.1016/j.geomorph.2007.01.004
- Domínguez Cuesta, M. J., Jiménez Sánchez, M., & Rodríguez García, A. (1999). Press archives as temporal records of landslides in the North of Spain: Relationships between rainfall and instability slope events. Geomorphology, 30(1-2), 125–132. doi:10.1016/S0169-555X(99)00049-5
- Dymond, J. R., Ausseil, A. G., Shepherd, J. D., & Buettner, L. (2006). Validation of a region-wide model of landslide susceptibility in the Manawatu–Wanganui region of New Zealand. Geomorphology, 74(1-4), 70–79. doi:10.1016/j.geomorph.2005.08.005
- Fell, R., Corominas, J., Bonnard, C., Cascini, L., Leroi, E., & Savage, W. S. (2008). Guidelines for landslide susceptibility, hazard and risk zoning for land-use planning. Engineering Geology, 102(3-4), 99–111. doi:10.1016/j.enggeo.2008.03.014
- Fernández, F. J., Menéndez-Duarte, R., Pando, L., Rodríguez-Rodríguez, L., & Iglesias, M. (2021). Gravitational slope processes triggered by past earthquakes on the Western Cantabrian Mountains (Sierra de la Sobia, Northern Spain). Geomorphology, 390, 107867. doi:10.1016/j.geomorph.2021.107867
- Gazibara, S. B., Sinčić, M., Krkač, M., Lukačić, H., & Arbanas, S. M. (2023). Landslide susceptibility assessment on a large scale in the Podsljeme area, City of Zagreb (Croatia). Journal of Maps, 19(1), https://doi.org/10.1080/17445647.2022.2163197
- Goetz, J. N., Guthrie, R. H., & Brenning, A. (2011). Integrating physical and empirical landslide susceptibility models using generalised additive models. Geomorphology, 129(3-4), 376–386. doi:10.1016/j.geomorph.2011.03.001
- Gutiérrez Claverol, M., & Torres Alonso, M. (1995). Geología de Oviedo, Descripción, Recursos y Aplicaciones. Ayuntamiento de Oviedo. 276 pp.
- Guzzetti, F., Carrara, A., Cardinali, M., & Reichenbach, P. (1999). Landslide hazard evaluation: A review of current techniques and their application in a multi-scale study, central Italy. Geomorphology, 31(1-4), 181–216. doi:10.1016/S0169-555X(99)00078-1
- Guzzetti, F., Mondini, A. C., Cardinali, M., Fiorucci, F., Santangelo, M., & Chang, K. T. (2012). Landslide inventory maps: New tools for an old problem. Earth-Science Reviews, 112(1-2), 42–66. doi:10.1016/j.earscirev.2012.02.001
- Guzzetti, F., Reichenbach, P., Ardizzone, F., Cardinali, M., & Galli, M. (2006). Estimating the quality of landslide susceptibility models. Geomorphology, 81(1-2), 166–184. doi:10.1016/j.geomorph.2006.04.007
- Huang, F., Cao, Z., Jiang, S. H., Zhou, C., Huang, J., & Guo, Z. (2020). Landslide susceptibility prediction based on a semi– supervised multiple-layer perceptron model. Landslides, 17(12), 2919–2930. doi:10.1007/s10346-020-01473-9
- Jiménez Sánchez, M. (2002). Slope deposits in the Upper Nalón River Basin (NW Spain): an approach to a quantitative comparison. Geomorphology, 43(1-2), 165–178. doi:10.1016/S0169-555X(01)00132-5
- Julivert, M. (1971). Décollement tectonics in the Hercynian cordillera of NW Spain. American Journal of Science, 270(1), 1–29. doi:10.2475/ajs.270.1.1
- Kamp, U., Growley, B. J., Khattak, G. A., & Owen, L. A. (2008). GIS-based landslide susceptibility mapping for the 2005 Kashmir earthquake region. Geomorphology, 101(4), 631–642. doi:10.1016/j.geomorph.2008.03.003
- López-Fernández, C., Llana-Fúnez, S., Fernández-Viejo, G., Domínguez-Cuesta, M. J., & Díaz-Díaz, L. M. (2020). Comprehensive characterization of elevated coastal platforms in the north Iberian margin: A new template to quantify uplift rates and tectonic patterns. Geomorphology, 364, 107242. doi:10.1016/j.geomorph.2020.107242
- Marcos, A., & Pulgar, J. A. (1982). An approach to the tectonostratigraphic evolution of the Cantabrian foreland thrust and fold belt, Hercynian Cordillera of NW Spain. Neues Jahrburg für Geologie und Paläontologie Abhanndlungen, 163(2), 256–260. doi:10.1127/njgpa/163/1982/256
- Marquínez, J., Menéndez-Duarte, R., Farias, P., & Jiménez, M. (2003). Predictive cartographic model of rockfall activity in mountain cliffs. Natural Hazards, 30(3), 341–360. doi:10.1023/B:NHAZ.0000007170.21649.e1
- Menéndez-Duarte, R., & Marquínez, J. (1996). Glaciarismo y evolución postglaciar de las vertientes en el Valle de Somiedo (Cordillera Cantábrica). Cuaternario y Geomorfología, 10(3-4), 21–31.
- Menéndez-Duarte, R., & Marquínez, J. (2002). The influence of environmental and lithologic factors on rockfall at a regional scale: An evaluation using GIS. Geomorphology, 43(1-2), 117–136. doi:10.1016/S0169-555X(01)00126-X
- Menéndez-Duarte, R., Marquínez, J., & Devoli, G. (2003). Slope instability in Nicaragua triggered by Hurricane Mitch: Distribution of shallow mass movements. Environmental Geology, 44(3), 290–300. doi:10.1007/s00254-003-0771-8
- Menéndez-Duarte, R., VázquezTarrío, D., Fernández, S., & Colubi, A. (2011). Favorability values of geological, vegetation and relief factors for the development of soil creep landforms. ZeitschriftfürGeomorphologie, 56(1), 75–92.
- Menéndez Duarte, R. (1994). Geomorfología del área de Somiedo (Cordillera Cantábrica, N de España). Aplicación de los Sistemas de Información Geográfica al estudio del relieve. [ PhD thesis]. Oviedo University.
- Murillo-García, F. G., & Alcántara-Ayala, I. (2017). Landslide inventory, Teziutlán municipality, Puebla, México (1942–2015). Journal of Maps, 13(2), 767–776. DOI: 10.1080/17445647.2017.1381194
- Nandi, A., & Shakoor, A. (2009). A GIS-based landslide susceptibility evaluation using bivariate and multivariate statistical analyses. Engineering Geology, 110(1-2), 11–20. doi:10.1016/j.enggeo.2009.10.001
- Nyssen, J., Moeyersons, J., Poesen, J., Deckers, J., & Haile, M. (2003). The environmental significance of the remobilisation of ancient mass movements in the Atbara–Tekeze headwaters, Northern Ethiopia. Geomorphology, 49(3-4), 303–322. doi:10.1016/S0169-555X(02)00192-7
- Pérez-Estaún, A., Bastida, F., Alonso, J. L., Marquínez, J., Aller, J., Alvarez-Marrón, J., Marcos, A., & Pulgar, J. A. (1988). A thin-skinned tectonic model for an arcuate fold and thrust belt: Cantabrian zone. Tectonics, 7(3), 517–537. doi:10.1029/TC007i003p00517
- Pérez Estaún, A., & Bastida, F. (1990). Cantabrian zone: Structure. In R. D. Dallmeyer, & E. M. García (Eds.), Pre-mesozoic geology of Iberia (pp. 55–69). Springer-Verlag.
- Pourghasemi, H. R., Moradi, H. R., Fatemi Aghda, S. M., Gokceoglu, C., & Pradhan, B. (2014). Gisbased landslide susceptibility mapping with probabilistic likelihood ratio and spatial multi-criteria evaluation models (North of Tehran, Iran). Arabian Journal of Geosciences, 7(5), 1857–1878. https://doi.org/10.1007/s12517-012-0825-x
- Pradhan, A. M. S., Lee, S. R., & Kim, Y. T. (2019). A shallow slide prediction model combining rainfall threshold warnings and shallow slide susceptibility in Busan, Korea. Landslides, 16(3), 647–659. doi:10.1007/s10346-018-1112-z
- Pulgar, J., Gallart, J., Fernández-Viejo, G., Pérez-Estaún, A., & Alvarez-Marron, J. (1996). Seismic image of the Cantabrian Mountains uplift in the western extension of the Pyrenean Belt from integrated ESCIN reflection and refraction data. Tectonophysics, 264(1-4), 1–20. doi:10.1016/S0040-1951(96)00114-X
- Reichenbach, P., Rossi, M., Malamud, B. D., Mihir, M., & Guzzetti, F. (2018). A review of statistically-based landslide susceptibility models. Earth-Science Reviews, 180, 60–91. doi:10.1016/j.earscirev.2018.03.001
- Remondo, J., González-Díez, A., Díaz de Terán, J. R., & Cendrero, A. (2003). Landslide susceptibility models utilising spatial data analysis techniques. A case study in the lower Deva Valley, Guipúzcoa (Spain). Natural Hazards, 30(3), 267–279. doi:10.1023/B:NHAZ.0000007202.12543.3a
- Rodríguez-Rodríguez, L., Fernández, F. J., Menéndez-Duarte, R., Guillou, V., Puente-Berdasco, B., Rinterknecht, V., & ASTER Team(2023). Age and recurrence of coseismic rock avalanches in Sierra de la Sobia (Cantabrian Mountains, Spain). CATENA, 223, 106931. https://doi.org/10.1016/j.catena.2023.106931
- Rodríguez-Rodríguez, L., González-Lemos, S., Ballesteros, D., Valenzuela, P., Domínguez-Cuesta, M. J., Llana-Fúnez, S., & Jiménez-Sánchez, M. (2018). Timing of paraglacial rock-slope failures and denudation signatures in the Cantabrian Mountains (N Iberian Peninsula). Land Degradation & Development, 29(9), 1–15. https://doi.org/10.1002/ldr.3012
- Rossi, M., Guzzetti, F., Reichenbach, P., Mondini, A. C., & Peruccacci, S. (2010). Optimal landslide susceptibility zonation based on multiple forecasts. Geomorphology, 114(3), 129–142. doi:10.1016/j.geomorph.2009.06.020
- Ruff, M., & Czurda, K. (2008). Landslide susceptibility analysis with a heuristic approach in the Eastern Alps (Vorarlberg, Austria). Geomorphology, 94(3-4), 314–324. doi:10.1016/j.geomorph.2006.10.032
- Salciarini, D., Tamagnini, C., Conversini, P., & Rapinesi, S. (2012). Spatially distributed rainfall thresholds for the initiation of shallow landslides. Natural Hazards, 61(1), 229–245. doi:10.1007/s11069-011-9739-2
- Smith, H. G., Spiekermann, R., Betts, H., & Neverman, A. J. (2021). Comparing methods of landslide data acquisition and susceptibility modelling: Examples from New Zealand. Geomorphology, 381, 107660. doi:10.1016/j.geomorph.2021.107660
- Soeters, R., & van Westen, C. J. (1996). Slope instability. Recognition, analysis and zonation. In A. K. Turner, & R. L. Schuster (Eds.), Landslide: Investigations and mitigation. Special report, vol. 247 (pp. 129–177). Transportation Research Board, National Research Council, National Academy Press.
- Sujatha, E. R., & Rajamanickam, V. (2011). Landslide susceptibility mapping of Tevankarai Ar sub-watershed, Kodaikkanal taluk, India, using weighted similar choice fuzzy model. Natural Hazards, 59(1), 401–425. doi:10.1007/s11069-011-9763-2
- Valenzuela, P., Domínguez-Cuesta, M. J., Mora García, M. A., & Jiménez-Sánchez, M. (2018b). Rainfall thresholds for the triggering of landslides considering previous soil moisture conditions (Asturias, NW Spain). Landslides, 15(2), 273–282. doi:10.1007/s10346-017-0878-8
- Valenzuela, P., Iglesias, M., Domínguez-Cuesta, M. J., García, M., & A, M. (2018a). Meteorological patterns linked to landslide triggering in Asturias (NW Spain): a preliminary analysis. Geosciences, 8(1), 18. doi:10.3390/geosciences8010018
- Valenzuela, P., Zêzere, J. L., Domínguez-Cuesta, M. J., & Mora García y, M. A. (2019). Empirical rainfall thresholds for the triggering of landslides in Asturias (NW Spain). Landslides, 16(7), 1285–1300. doi:10.1007/s10346-019-01170-2
- van Den Eeckhaut, M., Marre, A., & Poesen, J. (2010). Comparison of two landslide susceptibility assessments in the Champagne–Ardenne region (France). Geomorphology, 115(1-2), 141–155. doi:10.1016/j.geomorph.2009.09.042
- van Westen, C. J., Castellanos, A., & Kuriakose, S. L. (2008). Spatial data for landslide susceptibility, hazard, and vulnerability assessment: An overview. Engineering Geology, 102(3-4), 112–131. doi:10.1016/j.enggeo.2008.03.010
- van Westen, C. J., Rengers, N., & Soeters, R. (2003). Use of geomorphological information in indirect landslide susceptibility assessment. Natural Hazards, 30(3), 399–419. doi:10.1023/B:NHAZ.0000007097.42735.9e
- van Westen, C. J., van Asch, T. W. J., & Soeters, R. (2006). Landslide hazard and risk zonation—Why is it still so difficult? Bulletin of Engineering Geology and the Environment, 65(2), 167–184. doi:10.1007/s10064-005-0023-0
- Vergari, F., Della Seta, M., Del Monte, M., Fredi, P., & Lupia Palmieri, E. (2011). Landslide susceptibility assessment in the Upper Orcia Valley (Southern Tuscany, Italy) through conditional analysis: A contribution to the unbiased selection of causal factors. Natural Hazards and Earth System Sciences, 11(5), 1475–1497. doi:10.5194/nhess-11-1475-2011
- Wang, J., & Peng, X. (2009). GIS-based landslide hazard zonation model and its application. Procedia Earth and Planetary Science, 1(1), 1198–1204. doi:10.1016/j.proeps.2009.09.184