
ABSTRACT
Objective
Hyperphagia and early-onset, severe obesity are clinical characteristics of rare melanocortin-4 receptor (MC4R) pathway diseases due to loss-of-function (LOF) variants in genes comprising the MC4R pathway. In vitro functional characterization of 12,879 possible exonic missense variants from single-nucleotide variants (SNVs) of LEPR, POMC, and PCSK1 was performed to determine the impact of these variants on protein function.
Methods
SNVs of the three genes were transiently transfected into cell lines, and each variant was subsequently classified according to functional impact. We validated three assays by comparing classifications against functional characterization of 29 previously published variants.
Results
Our results significantly correlated with previously published pathogenic categories (r = 0.623; P = 3.03 × 10⁻⁴) of all potential missense variants arising from SNVs. Of all observed variants identified through available databases and a tested cohort of 16,061 patients with obesity, 8.6% of LEPR, 63.2% of PCSK1, and 10.6% of POMC variants exhibited LOF, including variants currently classified as a variant of uncertain significance (VUS).
Conclusions
The functional data provided here can assist in the reclassification of several VUS in LEPR, PCSK1, and POMC and highlight their impact in MC4R pathway diseases.
1. Introduction
The melanocortin-4 receptor (MC4R) pathway controls energy balance and appetite within the hypothalamus [Citation1]. MC4R signaling is regulated through key proteins upstream of the receptor, which act to initiate downstream cascades that promote satiety [Citation2], increase energy expenditure, and contribute to weight loss [Citation1,Citation3,Citation4]. To date, there have been several variants identified among key genes upstream of MC4R (e.g., POMC, PCSK1, LEPR), including those leading to pathogenicity [Citation1,Citation2,Citation5–13]. The functional changes associated with variants in genes encoding these proteins have been linked to rare monogenic forms of obesity [Citation1,Citation2,Citation6,Citation7,Citation9,Citation14–17] and can lead to insatiable hunger (hyperphagia) and early-onset, severe obesity () [Citation2,Citation8].
Figure 1. The MC4R pathway [Citation1–3]. LEPR, leptin receptor; MC4R, melanocortin-4 receptor; MSH, melanocyte-stimulating hormone; PCSK1, proprotein convertase subtilisin/kexin type 1; POMC, proopiomelanocortin.
![Figure 1. The MC4R pathway [Citation1–3]. LEPR, leptin receptor; MC4R, melanocortin-4 receptor; MSH, melanocyte-stimulating hormone; PCSK1, proprotein convertase subtilisin/kexin type 1; POMC, proopiomelanocortin.](/cms/asset/f373c271-187d-4c70-88e3-be8a8e7617d0/iere_a_2179985_f0001_oc.jpg)
Per American College of Medical Genetics (ACMG) criteria, certain variants in genes of the MC4R pathway have been classified according to clinical significance ranging from pathogenic (i.e., disease causing) to benign on the basis of their functional impact on the gene [Citation18]. However, the impact of most observed variants remains to be determined [Citation4,Citation5,Citation12]. The association between genetic variants and pathogenicity continues to be a rapidly developing field. Genetic epidemiology has identified variants of clinical concern using candidate gene and genome-wide association studies, which employ population data to identify relationships between genetic variants and disease states [Citation19]. Similar relationships can also be estimated from prediction algorithms or determined using data sets of previously identified mutations and computational approaches [Citation18,Citation20].
According to ACMG criteria, variants lacking sufficient evidence to support their involvement in the causality of disease are classified as variants of uncertain significance (VUS) [Citation18,Citation21,Citation22]. VUS present a substantial challenge to the usefulness of medical genetics [Citation19,Citation22]. In a systematic review, 48% of rare variants in the ClinVar database were classified as VUS [Citation23]. Although genomic testing and the identification of variants have increased, the understanding of the relationship between variants and their functional impact on disease etiology have not been systematically addressed for most genes [Citation19,Citation21,Citation22]. Large public databases often lack phenotypic information [Citation18]. Disease-specific cohorts are often unavailable or not large enough to enable accurate estimations of rare variants with enough frequency to define their pathogenicity [Citation24]. Such sparse functional data restrict the utility of prediction algorithms [Citation20,Citation24]. These challenges highlight the limitations in obtaining clinical confirmation of the predicted functional impact of infrequently observed sequences, such as those associated with rare diseases. The adequacy of genomic testing relies on an understanding of the functional impact of variants and is enhanced through functional assessments [Citation19,Citation22]. Most variants identified in rare genetic diseases of obesity are classified as VUS, which presents challenges in applying results of genetic testing to a clinical setting [Citation4]. Well-established and rigorously validated assays can provide insight into biological effects of VUS to potentially establish pathogenicity and disease etiology.
Determining the impact of VUS for the key MC4R pathway genes POMC, PCSK1, and LEPR is vital for maximizing identification of individuals with obesity due to POMC, PCSK1, and LEPR deficiency [Citation25,Citation26]. Genetic testing can confirm a diagnosis of monogenic obesity when the functional implication of variants is established [Citation18,Citation25,Citation26]. Functional assessments of variants allow genetic testing to be advantageous for patients with monogenic obesity because this functional knowledge can facilitate appropriate personalized treatment strategies [Citation4,Citation21,Citation24]. In vitro functional assessment of genetic variants is used to assess pathogenicity of variants on protein function [Citation18]. Deoxyribonucleic acid (DNA) plasmids can be created for each variant and introduced into cells, which then undergo functional assays to inform the functional implication of each variant [Citation22]. Using these methods can increase the applicability of genomic testing and allow resolution of VUS [Citation21,Citation22]. Here, we perform in vitro functional characterization of 12,879 potential exonic missense variants arising from single-nucleotide variants (SNVs) in POMC, PCSK1, and LEPR and compare this to functional characterization of 1,887 observed variants within these genes to aid in identifying the functionality of variants associated with MC4R signaling. We also provide the frequencies for all variants in these three genes that have been observed in the Rhythm disease-specific genetic obesity database, Uncovering Rare Obesity.
2. Methods
2.1. Determination of potential and previously observed variants
All potential missense variants, defined as those that could arise from an SNV in each codon of LEPR, PCSK1, and POMC, were functionally categorized through well-established, validated in vitro functional assays () [Citation6,Citation9,Citation11,Citation14,Citation16,Citation17,Citation27,Citation28]. A subset of these variants included those that had been previously published and were identified from genomic databases using the Genome Aggregation Database [Citation29] (gnomAD v2.1.1 [15,708 genomes] and v.3.1.2 [76,156 genomes]; https://gnomad.broadinstitute.org) and Ensembl [Citation30] (release 107; https://www.ensembl.org). The variants functionally characterized within the literature were used for validating findings from the assays implemented in this study (). Variants previously assessed for pathogenicity by clinical laboratories were identified through ClinVar [Citation31] (https://www.ncbi.nlm.nih.gov/clinvar/) as well as reported through the Uncovering Rare Obesity program (16,061 genomes) [Citation25,Citation26]. The Uncovering Rare Obesity program is designed to assess frequency of rare variants in individuals with early-onset, severe obesity. Blood or buccal samples are tested through a Clinical Laboratory Improvement Amendments (CLIA)–accredited laboratory. The frequency of select variants evaluated in this study was evaluated according to the Uncovering Rare Obesity and gnomAD databases.
Figure 2. In vitro functional assays for (A) LEPR, (B) PCSK1, and (C, D) POMC variants. AMC, 7-amino-4-methylcoumarin; cAMP, cyclic adenosine monophosphate; HEK, human embryonic kidney; LEPR, leptin receptor; MC4R, melanocortin-4 receptor; MSH, melanocyte-stimulating hormone; PCSK1, proprotein convertase subtilisin/kexin type 1; POMC, proopiomelanocortin; pSTAT3, phosphorylated signal transducer and activator of transcription 3; SRE, serum response element.
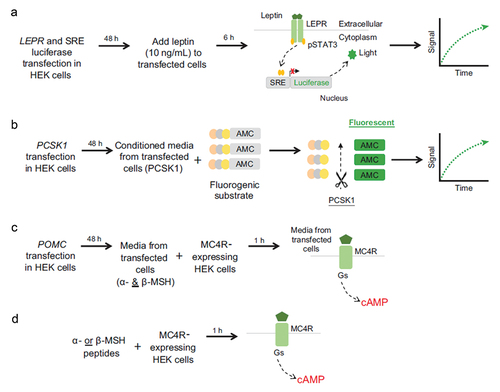
Table 1. Validation of assays against published variants of known functional impact.
Overall correlation between the reported functional consequence of the 29 variants in and the functional outcomes from our assays was evaluated using a Pearson’s correlation test in R V4.2.1 (R Foundation for Statistical Computing; Vienna, Austria) (http://www.R-project.org/).
2.1.1. POMC, PCSK1, and LEPR variant synthesis and functional characterization
A total of 12,879 missense variants arising from SNVs in three genes (POMC [NM_002303.56851], PCSK1 [NM_000439.44452], and LEPR [NM_001035256.21577]) were generated using traditional polymerase chain reaction–based site-directed mutagenesis at GenScript, USA. Each variant was cloned into pcDNA3.1(+) expression vector. GenScript provided sequencing results and Certificate of Analysis report for each variant. Criteria for variant classification are defined in . Briefly, for LEPR, PCSK1, and POMC (outside of α-/β-MSH peptide region) variants, loss of function (LOF) was determined as a variant with assay values less than those of wild-type (WT) results (beyond confidence intervals). WT-like function was identified for variants with assay results within the confidence interval for the respective WT control. For variants within the POMC α-/β-MSH peptide region, functional classification was determined using the half-maximal effective concentration (EC50) and percent activity at 1 µM.
Table 2. Criteria for variant classification.
2.1.2. LEPR assay
The functional impact of LEPR variants was assessed using leptin-induced signal transducer and activator of transcription 3 (STAT3) activation measured with a Dual-Glo luciferase reporter assay (Promega) [Citation11,Citation16,Citation27].
2.1.2.1. Transient cell transfection
On day 1, 40,000 human embryonic kidney cells (HEK293) per well were seeded in a 96-well poly-d-lysine–coated plate (Corning). Cells were cultured overnight at 37°C in a 5% carbon dioxide incubator. The next day, complete Dulbecco’s modified Eagle’s medium (DMEM; Thermo Fisher Scientific) was replaced with Opti-MEM (Thermo Fisher Scientific), and the cells were transfected with LEPR DNA (80 ng/well), firefly luciferase reporter (40 ng/well) (Promega), Renilla luciferase reporter (8 ng/well) (Progmega), and Lipofectamine transfection reagent (1 µL/well) (Invitrogen). Each DNA vector was transfected in 2 to 4 replicate wells. Cells were incubated with DNA-lipid complexes overnight. Fresh DMEM (100 µL/well) was added to the plate following day. Cells were allowed to grow for 24 hours.
2.1.2.2. LEPR variant detection by dual-glo luciferase reporter assay
Forty-eight hours after transfection, medium was replaced with serum-free DMEM, and cells were treated with 10 ng/mL leptin for 6 hours at 37°C in a 5% carbon dioxide incubator. After treatment, 25 µL of Glo Lysis Buffer (Promega) was added to each well using a multichannel pipette. Cells were incubated for 10 minutes at room temperature (RT), protected from light. Firefly luminescence was measured on a plate reader (EnVision multilabel reader; PerkinElmer). The reaction was stopped by adding 25 µL of Stop and Glo reagent (Promega) to all wells, and the plate was incubated for an additional 10 minutes at RT, protected from light. Renilla luminescence was measured on a plate reader. The ratio of firefly luminescence to Renilla luminescence was calculated for data analysis.
2.1.2.3. Data analysis
LEPR variants were tested in 2 to 4 replicate wells. Each variant effect on leptin activity was normalized to WT LEPR effect as 100% and pcDNA3.1 effect as 0%. Acceptable coefficient of variation (CV) was <20% for all variants screened. LEPR variants with CV >20% or those plates with WT control or with partial LOF variant (M867T) control CV >20% were selected and repeated. The initial data (CV > 20%) were replaced by data from repeats (CV ≤ 20%).
2.1.3. PCSK1 assay
Functional impact of PCSK1 variants was assessed using an enzyme activity assay by measuring the processing of the fluorogenic substrate Pyr-Glu-Arg-Thr-Lys-Arg-7-amino-4-methylcoumarin (pERTKR-AMC; Peptide Institute) containing a PCSK1 cleavage site [Citation17,Citation28].
2.1.3.1. Transient cell transfection
On day 1, HEK293 cells (40,000 cells/100 µL/well) were seeded in a Greiner 96-well poly-d-lysine–coated plate. The cells were cultured in complete growth medium overnight at 37°C in a 5% carbon dioxide incubator. On day 2, PCSK1 variant DNA in a Corning 3357 plate was thawed on ice. The plate was centrifuged at 215 g at 4°C. Under sterile conditions, in a culture hood, 90 µL of Opti-MEM containing 8 ng of green fluorescent protein (GFP) DNA were added to each PCSK1 variant DNA (300 ng). Lipofectamine 2000 (1 µL) in 90 µL of Opti-MEM was then added to the DNA mixture. The plate was incubated at RT for 15 minutes. The DNA-Lipofectamine (155 µL) mixture was aspirated and 50 µL was dispensed per well in triplicate wells in a 96-well plate seeded with HEK293 cells. Cells were then incubated overnight at 37°C, 5% carbon dioxide. On day 3, culture medium was removed from the cultured plate and replaced with 100 µL of fresh complete growth medium prewarmed at 37°C. Plates were then incubated overnight at 37°C, 5% carbon dioxide. At 48 hours after transfection, plates were read in an acumen Cellista plate reader (TTP Labtech) to measure GFP fluorescence intensity. Conditioned culture medium (25 µL) from each culture well was transferred into a clean 96-well plate using a Bravo instrument (Agilent) for the measurement of PCSK1 enzymatic activity (as described elsewhere).
2.1.3.2. GFP fluorescence intensity measurement
At 48 hours after transfection, GFP expression in the transfected cells was measured using an acumen Cellista high-throughput cell-based imager. A common instrument method was created and used to scan all the assay plates. The method included all presets such as the Greiner plate type and laser, voltage, and output settings. Instrument laser wavelength was set to the FL2 channel for 488-nm excitation of GFP and voltage set to 450 V. Gait was automatically set by the instrument program. GFP total intensity values from each scanned plate were exported to a Microsoft Excel file.
2.1.3.3. PCSK1 enzyme assay
Using a Bravo 96-head automated liquid handler, 25 µL of culture supernatant was transferred (without touching the adherent cell layer) from the culture plate to the Corning assay plate and mixed by placing the plate on a plate shaker. The final reaction concentrations were 100 mM sodium acetate (pH 5.5), 2 mM calcium dichloride, 0.1% Brij-35 (Thermo Fisher Scientific), and 200 µM pERTKR-AMC in a final volume of 50 µL/well. The plate was covered with a lid and incubated at 37°C for 90 minutes (90 minutes was selected to ensure all PCSK1 variants could reach maximum activity in screening). The assay plate was read on the EnVision microplate reader (PerkinElmer) using fluorescence monochromator setting at 380 nm excitation and 460 nm emission. Detector gain and number of flashes were each set to 400.
2.1.3.4. Data analysis
PCSK1 variants were evaluated in triplicate wells. Each variant effect on PCSK1 enzymatic activity was normalized to the WT PCSK1 effect as 100% and pcDNA3.1 effect as 0%. The percent effect was calculated as follows: (relative fluorescence unit [RFU]variant – RFUpcDNA3.1)/(RFUWT – RFUpcDNA3.1) × 100. Data in final form for each variant were normalized to GFP. Acceptable CV was ≤20% for all variants screened. PCSK1 variants with CV >20% or those plates with WT control or with PCSK1 variant A352S control CV >20% were selected and repeated.
2.1.4. POMC Assay (POMC missense variants arising from SNVs outside the α-/β-MSH peptide region)
The functional impact of POMC variants was assessed through MC4R-mediated cyclic adenosine monophosphate (cAMP) production [Citation6,Citation9,Citation14].
2.1.4.1. Transient cell transfection
On day 1, HEK293 cells (40,000 cells/100 µL/well) were seeded in a 96-well poly-d-lysine–coated plate (Corning). The cells were cultured in complete growth medium overnight at 37°C in a 5% carbon dioxide incubator. The next day, complete DMEM was replaced with Opti-MEM and the cells were transfected with POMC DNA (80 ng/well), GFP (8 ng/well), and Lipofectamine 2000 (1 µL/well). Each DNA vector was transfected in four replicate wells. Cells were incubated with DNA-lipid complexes overnight in a 37°C, 5% carbon dioxide incubator. Fresh complete growth medium (100 µL per well) was added to the plate after 16 hours. Cells were cultured for an additional 48 hours. Supernatant from the transfected cells was collected for cAMP assay.
2.1.4.2. GFP measurement and POMC variants detection by cAMP assay
At 48 hours after transfection, cells were analyzed for GFP expression level using a fluorescence cell imager (Acumen instrument). Culture medium was aspirated from MC4R-expressing cells and replaced with 25 µL of stimulation buffer per well. Cell supernatant (25 µL) from POMC-transfected cells was added to each well containing MC4R cells using a multichannel pipette. Cells were incubated for 30 minutes. Europium-labeled cAMP tracer (25 µL) and ULight-anti-cAMP (25 µL) working solution were added to each well and incubated for 1 h at RT to detect cAMP levels (LANCE Ultra cAMP homogeneous time-resolved fluorescence [HTRF] kit; PerkinElmer) from MC4R-expressing cells. A cAMP standard curve (1 µM top dose and 1:3 serial dilutions) was prepared and added to the plate. Fluorescence was measured using the HTRF program (615 nm/665 nm) in an EnVision multilabel reader, and cAMP concentration in MC4R-expressing cells was calculated according to the cAMP standard curve, which had an acceptable R2 of >0.99. Data for known concentrations of cAMP were used to make the standard curve, plotting concentration on the x-axis and the assay measurement on the y-axis. The same cAMP assay was then performed with samples of unknown concentration. To analyze the data, the measurement on the y-axis corresponding to the assay measurement of the unknown substance is determined and follows a line to intersect the standard curve. The corresponding value on the x-axis is the concentration of unknown samples.
2.1.4.3. Data analysis
All POMC variants were tested in triplicate wells, and each variant effect on cAMP production was normalized to the WT POMC effect as 100% and pcDNA3.1 effect as 0%. Percent effect was calculated as follows: (RFUvariant − RFUpcDNA3.1)/(RFUWT − RFUpcDNA3.1) × 100. Acceptable CV was <20% for all variants screened. POMC variants with CV >20%, or those plates with WT control or POMC control variant L12P CV >20% were selected and repeated.
2.1.5. POMC assay (POMC missense variants arising from SNVs inside the α-/β-MSH peptide region)
For assessing functional impact of POMC missense variants arising from SNVs inside the α-/β-MSH peptide region, 211 synthetic peptides were generated encompassing individual variants (77 variants in the α-MSH peptide region; 134 variants in the β-MSH peptide region) and tested on MC4R-mediated cAMP production. For this purpose, the HEK293 stable cell line was used.
2.1.5.1. α- and β-MSH peptide variant analysis by cAMP assay
Culture medium was aspirated from the 96-well plate culture, and cells were washed once with phosphate-buffered saline. Stimulation buffer (25 µL/well) containing 0.5 mM 3-isobutyl-1-methylxanthine was added to each well. Using a Tecan instrument, α- or β-MSH peptide was added at increasing concentrations. There were nine concentrations evaluated starting from 1 µM and serially diluted 1:5 in duplicate wells. Cells were incubated for 40 minutes at 37°C. After incubation, 12.5 µL of d2-labeled cAMP (red acceptor) and 12.5 µL of anti-cAMP cryptate (europium donor) in lysis and detection buffer were added and incubated for 1–3 hours at RT (Perkin Elmer). Plates were read using an EnVision multiplate reader (PerkinElmer) with HTRF program 321, and cAMP concentration was calculated. Each plate included a negative control, SHU 9119 (R&D Systems), at 1 µM, 4 wells with no treatment, and 4 wells with either α- or β-MSH at 1 µM depending on whether α- or β-MSH peptides were tested, respectively. Each batch of plates included a full dose–response curve of either α- or β-MSH to enable EC50 calculation throughout the screening. SHU 9119, the negative control, was included with each batch during screening.
2.1.5.2. Data analysis
All α- and β-MSH variants were tested in duplicate wells. The effect of each variant was calculated as the percent of cAMP concentration compared with 1 µM α-MSH WT or 1 µM β-MSH WT (activity as 100%). A cAMP standard curve was included on each plate (range, 300–0.1 nm); each concentration on the curve was run in duplicate. Each sample was converted into cAMP concentration on the basis of a four parameter logistic standard curve. Dose–response curve (cAMP concentration vs compound dose), half-maximal inhibitory concentration, and percent of maximum effect were analyzed using Prism GraphPad software. In order to calculate the maximum effect for each peptide, the plate average for the WT MSH was set to 100%, and peptides at 1 µM were expressed relative to this WT control.
3. Results
3.1. Validation of assays
Before screening all potential missense variants, we validated three assays against published variants with known functional impact (). All three assays were able to detect varying degrees of LOF (WT-like, moderate LOF, significant LOF), and for most variants, a high degree of correlation was observed with published data (r = 0.623; P = 3.03 × 10⁻⁴) ().
3.1.1. Functional classification of variants
Of 6,850 LEPR missense variants assessed, 952 (13.9%) showed LOF and 5,898 (86.1%) exhibited WT-like activity (Supplemental Figure 1). Of potential LEPR variants, 910 (13.2%) were observed variants, with 78 (8.6%) displaying LOF and 832 (91.4%) WT-like activity (). Of the 4,418 possible PCSK1 missense variants evaluated, 2,622 (58.9%) showed LOF and 1,830 (41.1%) WT-like activity (). Of those 4,418 potential missense variants, we observed 619 (13.9%), with 391 showing LOF (63.2%) and 228 WT-like activity (36.8%) (). The final criteria for LOF and WT classification of POMC variants are reported in . There were 1,576 POMC missense variants arising from SNVs, of which 170 (10.8%) exhibited LOF and 1,406 (89.2%) WT-like activity. Of those 1,576 potential variants, we observed 358 (22.7%), with 38 showing LOF (10.6%) and 320 WT-like activity (89.4%).
Figure 3. Distributions of the mean percent of WT of all observed variants characterized in the functional assays. Each data point represents the mean (95% confidence interval in blue) of replicate assays and is compared with mean (95% confidence interval) results from replicate WT assays, shown in gray. Variants in red demonstrate a functional deficit, characterized by lack of overlap with confidence interval with results from WT assays. (A) All observed LEPR variants (n = 910). (B) All observed PCSK1 variants (n = 619). (C) All observed variants outside α-/β-MSH peptide region (n = 314). (D) Representation of variant by functional categorization for variants within the α-MSH peptide region (138–150; n = 17) and β-MSH region (213–234; n = 27). cAMP, cyclic adenosine monophosphate; MSH, melanocyte-stimulating hormone; pERTKR-AMC, Pyr-Glu-Arg-Thr-Lys-Arg-7-amino-4-methylcoumarin; STAT3, signal transducer and activator of transcription 3; WT, wild-type.
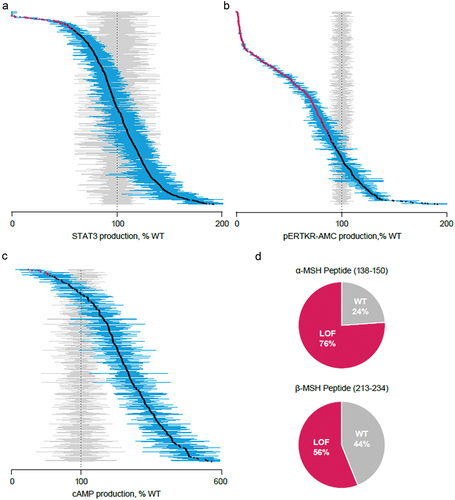
Both potential (n = 1576) and observed (n = 358) POMC variants were further segregated by variants outside ( and Supplemental Figure 1C) and inside ( and Supplemental Figure 1D) the α-/β-MSH peptide region. The LOF and WT frequencies for potential variants within the α-MSH peptide region were 53.2% and 46.8%, respectively, for 77 variants; frequencies within the β-MSH peptide region for 134 variants were 43% and 57% for LOF and WT, respectively (Supplemental Figure 1D). For observed variants inside the peptide regions, 17 α-MSH variants were observed, with LOF and WT frequencies of 76% and 24%, respectively; β-MSH peptide region frequencies were 44% and 56% for WT and LOF, respectively, for 27 variants ().
3.1.2. Identification of variants for potential reclassification
The full data set of all variants assayed and their functional impact on the assays are available in the Supplemental Data Set. We also highlighted a subset of the observed variants in that may merit reclassification based on observed LOF through the in vitro functional assays performed here (). The frequency of variants was identified through either the Uncovering Rare Obesity or public databases, along with their respective current pathogenicity classification. Some variants listed in overlap with published variants identified in . Of the observed variants in this subset for potential classification, 3 of 17 LEPR variants had been previously assessed according to ACMG criteria by a third-party CLIA/CAP-accredited diagnostic laboratory; all 3 were considered either pathogenic or likely or suspected pathogenic (P/LP/SP), with the remaining 14 categorized as VUS. Of 29 PCSK1 variants, 4 had a non-VUS classification of P/LP/SP. Interestingly, all POMC variants outside of the α-/β-MSH peptide region (n = 7) and within the β-MSH peptide region (n = 11) were all classified as VUS. Within the α-MSH peptide region, 11 observed variants showed evidence of LOF in our assays. Two of those have been classified as LP, with a third as suspected benign. The frequency of this third variant, p.His143Tyr, in the population databases and the functional data suggest that it is likely to be pathogenic (). Overall, our data support reclassification of this subset of variants from VUS toward pathogenicity. We note these data can likewise be used to rule out the involvement of variants that show no LOF on the assays ( and Supplemental Data Set), reclassifying them to form VUS toward benign.
Table 3. List of observed variants for potential reclassification based on in vitro functional assays.
4. Discussion
In this study, we aimed to perform a functional characterization of all potential missense variants in LEPR, PCSK1, and POMC to assist with the determination of their pathogenicity and impact on monogenic diseases of obesity. With rare variants, the interpretation of pathogenicity can be complicated owing to the low frequency of observation [Citation24]. The use of well-established, validated assays can aid in the categorization of VUS as either P/LP/SP or benign variants on the basis of the effect of the variant on protein function within in vitro assays. High-throughput sequencing and prediction algorithms can provide information that might be a helpful starting point for identifying the functional role of variants. However, many tools for prediction of missense changes have low specificity and often misclassify missense variants as pathogenic [Citation18,Citation20]. The proposed functional impact of variants and classification of pathogenicity necessitates validation and assessment of consistency, which can be done by standardized functional assays such as those performed here. Here, we report the frequency of all variants within LEPR, PCSK1, and POMC observed in a community-based genetic obesity testing program, Uncovering Rare Obesity, which currently includes >9,000 participants with early-onset, severe suspected genetic obesity. Our work has identified that of observed missense variants arising from SNVs, 8.6% of LEPR variants, 63.2% of PCSK1 variants, and 10.6% of POMC variants exhibited varying degrees of LOF, which was determined through the direct in vitro assessment of functional impact.
In vitro functional assays implemented in this study to assess the function of LEPR, PCSK1, and POMC were established and validated using published observed gene variants. Functional impact of LEPR variants is investigated by assessing leptin-induced STAT3 signaling [Citation11,Citation27,Citation32]. It is important to note that variants in LEPR can lead to loss of function in leptin receptor signaling, as assessed by measuring leptin-induced STAT3 activation. This could be due to distinct mechanisms such as inefficient leptin binding, poor cell surface expression, and reduced protein stability [Citation33]. Variants in PCSK1 can lead to complete and partial loss of enzymatic activity [Citation7,Citation15,Citation17] while other variants in this gene have been reported to increase efficiency in this same activity [Citation34]. Deficiencies in protein stability resulting from altered cleavage can also occur with PCSK1 variants [Citation35]. POMC variants can cause changes to the cleavage site of the protein. These changes can impair POMC processing by PCSK1, resulting in a reduced ability of ligands to bind MC4R and stimulate cAMP signaling [Citation6,Citation14]. Certain variants in POMC can also lead to a complete loss of MC4R activation [Citation9], while others have been found to be benign [Citation36]. While there are other assessments of downstream signaling within the MC4R pathway, our findings use the same well-established, well-validated assays implemented in the studies described above to investigate the functional effects of variants in LEPR, PCSK1, and POMC [Citation6,Citation9,Citation11,Citation14,Citation16,Citation17,Citation27,Citation28]. Additionally, while performing these assays in a non-neuronal cell line does have inherent limitations, several studies have used HEK293 cells to study the MC4R signaling pathway. [Citation7,Citation9,Citation10,Citation14–16,Citation24,Citation32,Citation37] While cautious interpretation should be taken with any single variant result, our findings align with results from work using this well-established model system, as outlined in .
The functional impacts of SNV observations here have identified additional missense variants with potential LOF and are similar to those seen with previously published variants [Citation6,Citation7,Citation9–11,Citation13–17,Citation27,Citation32,Citation34,Citation35,Citation37–3Citation9]. The functional changes associated with previously identified variants in LEPR, PCSK1, and POMC have been shown to result in monogenic forms of obesity [Citation1,Citation2,Citation6,Citation7,Citation9,Citation14–17]. Within these studies on variants impacting MC4R signaling, VUS have also been identified [Citation4,Citation5,Citation12]. Clinically, the identification of VUS offers little guidance in informing treatment strategy or diagnoses [Citation21]. In vitro analysis of functional impacts of variants, particularly of VUS, can aid in the confirmation of disease relevance and provide invaluable input on clinical interpretation [Citation21,Citation24]. Our results indicate that there is a correlation between our findings and the functional characterization of previously reported variants. Additionally, our findings have identified several variants currently classified as VUS to exhibit LOF. This work suggests that there are additional variants that may be causal for rare monogenic diseases of obesity, allowing for the potential to aid in patient diagnosis and clinical care [Citation4].
5. Conclusions
The use of in-vitro functional assays to characterize SNVs can allow improved classification of variants and aid in resolving uncertainty surrounding VUS [Citation18]. While assays may have limitations owing to the cell systems being used [Citation22], our methods are consistent with those in previously published reports (). Validated, established methods of determining functional impacts can facilitate direct comparison to previously published studies and association with disease states. The data presented here highlight the need for reclassification of several observed variants currently classified as VUS. The functional deleteriousness identified here in missense mutations of POMC, PCSK1, and LEPR can further inform the etiology of rare MC4R pathway diseases and result in improved diagnosis and targeted treatment strategies for patients with monogenic obesity.
Declaration of interest
BP Shah, J McDonald and IH Moeller were employees of Rhythm Pharmaceuticals at the time of study. P Kleyn and PM Sleiman are current employees and stockholders of Rhythm Pharmaceuticals.
The authors have no other relevant affiliations or financial involvement with any organization or entity with a financial interest in or financial conflict with the subject matter or materials discussed in the manuscript apart from those disclosed.
Reviewer disclosures
Peer reviewers on this manuscript have no relevant financial or other relationships to disclose.
Author contribution statement
BS, PMS, and PK had full access to the data and helped in data acquisition and analysis. JM was involved in study design. All authors reviewed, substantially revised, and approved the manuscript.
Supplemental Material
Download Zip (8.1 MB)Acknowledgments
Assistance with preparation of this publication was provided by Dorothy Dobbins, PhD, and David Boffa, ELS, MedThink SciCom, and funded by Rhythm Pharmaceuticals, Inc. The authors thank Lex H.T. Van der Ploeg and Al Garfield for their assistance with data analysis and interpretation.
Supplementary material
Supplemental data for this article can be accessed online at https://doi.org/10.1080/17446651.2023.2179985
Additional information
Funding
References
- Yazdi FT, Clee SM, Meyre D. Obesity genetics in mouse and human: back and forth, and back again. PeerJ. 2015;3:e856.
- Farooqi IS. Monogenic obesity syndromes provide insights into the hypothalamic regulation of appetite and associated behaviors. Biol Psychiatry. 2022;91(10):856–859.
- Krashes MJ, Lowell BB, Garfield AS. Melanocortin-4 receptor-regulated energy homeostasis. Nat Neurosci. 2016;19(2):206–219.
- Sket R, Kotnik P, Bizjan BJ, et al. Heterozygous genetic variants in autosomal recessive genes of the leptin-melanocortin signalling pathway are associated with the development of childhood obesity. Front Endocrinol (Lausanne). 2022;13:832911.
- Bend EA, Antao T, Ichetovkin I, et al. Frequency of MC4R pathway variants in a large US cohort of pediatric and adult patients with severe obesity. Poster session presented at: European Society for Peadiatric Endocrinology; 2021 Sept 22 –26;Virtual.
- Challis BG, Pritchard LE, Creemers JW, et al. A missense mutation disrupting a dibasic prohormone processing site in pro-opiomelanocortin (POMC) increases susceptibility to early-onset obesity through a novel molecular mechanism. Hum Mol Genet. 2002;11(17):1997–2004.
- Creemers JW, Choquet H, Stijnen P, et al. Heterozygous mutations causing partial prohormone convertase 1 deficiency contribute to human obesity. Diabetes. 2012;61(2):383–390.
- da Fonseca ACP, Mastronardi C, Johar A, et al. Genetics of non-syndromic childhood obesity and the use of high-throughput DNA sequencing technologies. J Diabetes Complications. 2017;31(10):1549–1561.
- Dubern B, Lubrano-Berthelier C, Mencarelli M, et al. Mutational analysis of the pro-opiomelanocortin gene in French obese children led to the identification of a novel deleterious heterozygous mutation located in the alpha-melanocyte stimulating hormone domain. Pediatr Res. 2008;63(2):211–216.
- Farooqi IS, Volders K, Stanhope R, et al. Hyperphagia and early-onset obesity due to a novel homozygous missense mutation in prohormone convertase 1/3. J Clin Endocrinol Metab. 2007;92(9):3369–3373.
- Farooqi IS, Wangensteen T, Collins S, et al. Clinical and molecular genetic spectrum of congenital deficiency of the leptin receptor. N Engl J Med. 2007;356(3):237–247.
- Moeller IHK, Kleyn P, Sleiman PM, et al. Frequency of MC4R pathway variants in a large US cohort of patients with severe obesity. Poster session presented at: Obesity Week; 2021 Nov 1 –5;Virtual.
- Crouse JA, Elliott GE, Burgess TL, et al. Altered cell surface expression and signaling of leptin receptors containing the fatty mutation. J Biol Chem. 1998;273(29):18365–18373.
- Lee YS, Challis BG, Thompson DA, et al. A POMC variant implicates beta-melanocyte-stimulating hormone in the control of human energy balance. Cell Metab. 2006;3(2):135–140.
- Martin MG, Lindberg I, Solorzano-Vargas RS, et al. Congenital proprotein convertase 1/3 deficiency causes malabsorptive diarrhea and other endocrinopathies in a pediatric cohort. Gastroenterology. 2013;145(1):138–148.
- Stratigopoulos G, LeDuc CA, Matsuoka N, et al. Functional consequences of the human leptin receptor (LEPR) Q223R transversion. Obesity (Silver Spring). 2009;17(1):126–135.
- Wilschanski M, Abbasi M, Blanco E, et al. A novel familial mutation in the PCSK1 gene that alters the oxyanion hole residue of proprotein convertase 1/3 and impairs its enzymatic activity. PLoS One. 2014;9(10):e108878.
- Richards S, Aziz N, Bale S, et al. Standards and guidelines for the interpretation of sequence variants: a joint consensus recommendation of the American College of Medical Genetics and Genomics and the Association for Molecular Pathology. Genet Med. 2015;17(5):405–424.
- Seyerle AA, Avery CL. Genetic epidemiology: the potential benefits and challenges of using genetic information to improve human health. N C Med J. 2013;74(6):505–508.
- Simcikova D, Heneberg P. Refinement of evolutionary medicine predictions based on clinical evidence for the manifestations of Mendelian diseases. Sci Rep. 2019;9(1):18577.
- Gasperini M, Starita L, Shendure J. The power of multiplexed functional analysis of genetic variants. Nat Protoc. 2016;11(10):1782–1787.
- Gelman H, Dines JN, Berg J, et al. Recommendations for the collection and use of multiplexed functional data for clinical variant interpretation. Genome Med. 2019;11(1):85.
- Harrison SM, Rehm HL. Is ‘likely pathogenic’ really 90% likely? Reclassification data in ClinVar. Genome Med. 2019;11(1):72.
- Lotta LA, Mokrosinski J. Mendes de Oliveira E, et al. Human gain-of-function MC4R Variants Show Signaling Bias and Protect against Obesity. Cell. 2019;177(3):597–607 e599.
- Uncovering rare obesity®. Rhythm Pharmaceuticals, Inc; 2022 [cited 2022 Nov] Available from: https://uncoveringrareobesity.com/
- Kleyn P, Bromberg E, Norton R. Variants in obesity-related genes in a population with early-onset obesity. Poster session presented at: Obesity Week; 2022 Nov 1–4; San Diego (CA).
- Baumann H, Morella KK, White DW, et al. The full-length leptin receptor has signaling capabilities of interleukin 6-type cytokine receptors. Proc Natl Acad Sci U S A. 1996;93(16):8374–8378.
- Blanco EH, Ramos-Molina B, Revisiting LI. PC1/3 mutants: dominant-negative effect of endoplasmic reticulum-retained mutants. Endocrinology. 2015;156(10):3625–3637.
- Karczewski KJ, Francioli LC, Tiao G, et al. The mutational constraint spectrum quantified from variation in 141,456 humans. Nature. 2020;581(7809):434–443.
- Cunningham F, Allen JE, Allen J, et al. Ensembl 2022. Nucleic Acids Res. 2022;50(D1):D988–D995.
- Landrum MJ, Chitipiralla S, Brown GR, et al. ClinVar: improvements to accessing data. Nucleic Acids Res. 2020;48(D1):D835–D844.
- Couturier C, Jockers R. Activation of the leptin receptor by a ligand-induced conformational change of constitutive receptor dimers. J Biol Chem. 2003;278(29):26604–26611.
- Voigtmann F, Wolf P, Landgraf K, et al. Identification of a novel leptin receptor (LEPR) variant and proof of functional relevance directing treatment decisions in patients with morbid obesity. Metabolism. 2021;116:154438.
- Mbikay M, Sirois F, Nkongolo KK, et al. Effects of rs6234/rs6235 and rs6232/rs6234/rs6235 PCSK1 single-nucleotide polymorphism clusters on proprotein convertase 1/3 biosynthesis and activity. Mol Genet Metab. 2011;104(4):682–687.
- Williamson DM, Elferich J, Shinde U. Mechanism of fine-tuning pH sensors in proprotein convertases: identification of a pH-sensing histidine pair in the propeptide of proprotein convertase 1/3. J Biol Chem. 2015;290(38):23214–23225.
- Cantara S, Chiofalo F, Ciuoli C, et al. Rare POMC mutation in a patient with myotonic dystrophy type 1 and adrenocorticotropin hyperresponse to corticotropin-releasing hormone. AACE Clin Case Rep. 2019;5(2):e132–e137.
- Loffler D, Behrendt S, Creemers JWM, et al. Functional and clinical relevance of novel and known PCSK1 variants for childhood obesity and glucose metabolism. Mol Metab. 2017;6(3):295–305.
- Koks S, Nikopensius T, Koido K, et al. Analysis of SNP profiles in patients with major depressive disorder. Int J Neuropsychopharmacol. 2006;9(2):167–174.
- Silvia C, Francesco C, Cristina C, et al. A rare mutation of POMC gene in a patient with myotonic dystrophy type 1 and adrenocorticotropin hyperresponse to corticotrophin-releasing hormone. AACE Clin Case Rep. 2018;5(2):e132–e137.