
ABSTRACT
In South Africa, prevention of mother to child transmission (PMTCT) has reduced MTCT from 3.6% in 2011 to 1.3% in 2017. However, there are challenges in reaching vulnerable HIV-positive children; those at increased risk of malnutrition or present late with advanced disease. Macro – and micronutrient deficiencies, common in HIV, may accelerate disease progression. This was a prospective cohort study of paediatric patients (aged 1–10 years) initiating ART between 08/2014 and 09/2016 at a public health facility in Johannesburg, South Africa. Trained clinic staff collected anthropometric indices and dietary intake at ART initiation and at one and three months post initiation. A blood sample was collected at ART initiation and at six months post initiation for biochemistry. We describe demographics, anthropometry, dietary intake, dietary diversity at enrolment and changes in anthropometry and biochemistry from ART initiation until six months for paediatric HIV-positive patients initiating antiretroviral therapy (ART).
Twenty-seven patients were enrolled. The World Health Organization dietary intake recommendations for children were not met for the majority of nutrients including energy, fats, iron, calcium and Vitamin A at ART initiation. At least 40% of patients were receiving less than four of the main food groups. At initiation, 18.5% of children presented with severe acute malnutrition (MUAC <11cm), 14.3% were underweight (weight-for-age Z score <-2SD), 19.1% stunted (height-for-age Z score <-2SD) and 33.4% were wasted (weight-for-height <-2SD). At six months, there was a general increase in WHZ (<5 years), BMI (≥5 years), C-reactive protein, iron and albumin but a significant increase in Vitamin A.
The results highlight the need for dietary counselling and provision of nutritional supplementation at ART initiation for paediatric patients. Adequate nutrition should be established early at initiation, to improve growth, development and health outcomes.
Introduction
In South Africa, the prevention of mother to child transmission (PMTCT) has resulted in a marked decrease in the transmission of HIV from 3.6% in 2011 to 1.3% in 2017 (Department of Health South Africa, Citation2013). However, despite these efforts, in 2016 South Africa reported 13 000 new infections among children between the ages of 0–14 with only 55% receiving antiretroviral treatment (ART)(UNAIDS, Citation2017). For every child initiated on treatment, 1.4 are newly infected with HIV (South African National AIDS Council [SANAC], Citation2016) .
Malnutrition significantly complicates HIV care and treatment and contributes to over 1 million child deaths every year. Malnutrition is an abnormal physiological condition caused by imbalances in energy, protein and/or other nutrients (FAO et al., Citation2017). It is estimated that there are nearly 20 million severely malnourished children worldwide, the majority of whom live in south Asia and sub-Saharan Africa, areas that also have a high burden of HIV and tuberculosis (TB) (FAO, 2017). HIV-positive children are more vulnerable to malnutrition due to factors related to the malnutrition-disease cycle (World Health Organization [WHO], Citation2011). Malnutrition in immuno-compromised children causes many problems including repeated infections (e.g. ear infections, pneumonia, gastroenteritis and tuberculosis), adverse clinical outcomes, micronutrient deficiencies, failure to thrive and stunted growth (Katona & Katona-Apte, Citation2008; Merchant & Lala, Citation2012). Poor growth appears to be one of the most sensitive indicators of disease progression in children with HIV/AIDS (Katona & Katona-Apte, Citation2008). In 2012 and 2013 over a third (34% and 33.6%) of children worldwide were underweight for their age (Katona & Katona-Apte, Citation2008). Growth failure is common in children with untreated HIV and a study conducted in Johannesburg, South Africa between 2005 and 2009 reported that 23% of HIV-positive children presenting at ART initiation were stunted (height-for-age Z-score <-2SD) while 24% were undernourished (weight-for-age Z-score <-2SD) (Macdonald et al., Citation2011). These findings are similar to those described from other sub-Saharan African settings such as Dar es Salaam and Zambia (Sunguya et al., Citation2011).
While several studies have shown that many of the deficits in growth due to HIV infection can be reversed with ART, growth failure at ART initiation can impact treatment outcomes. Both age and level of under nutrition at treatment initiation have the potential to impact growth trajectories and the effect of ART (Weigel et al., Citation2010). Studies have shown that HIV-positive children who present with a low weight-for-height Z score (i.e. wasted) have less immunologic recovery at the different follow-up visits, suggesting that these children should receive nutritional supplementation, especially during the early months following ART initiation (Ebissa, Deyessa, & Biadgilign, Citation2016). Improvements in anthropometry have been demonstrated in undernourished HIV-infected children following the initiation of ART, irrespective of baseline nutritional status or the provision of nutritional supplements (Davies et al., Citation2009; Sutcliffe et al., Citation2011). Some studies, but not all, have also reported improvements in height-for-age (Davies et al., Citation2009; Fassinou et al., Citation2004; Nyandiko et al., Citation2010; Weigel et al., Citation2010).
The principles of infant and young child nutrition apply to all children, regardless of whether or not they are infected with HIV. It is known that the daily energy and nutrient requirements for HIV-positive infants and children are higher, even if they are asymptomatic (World Health Organization, Citation2011). The average South African diet is energy dense but micronutrient poor placing individuals at risk of ‘hidden hunger’. A micronutrient poor diet would therefore further contribute to increased risk of micronutrient-related malnutrition among HIV-positive children.
Although anthropometry indices have been well described for HIV-positive children starting ART (Macdonald et al., Citation2011), little is known about their dietary intake, if this is adequate, and how this is influenced by household food security. Therefore, this study aimed to describe anthropometry (e.g. HAZ, WAZ, WHZ and mid-upper arm circumference), dietary intake, dietary diversity among a cohort of children (aged 1–10 years) initiating ART in Johannesburg, South Africa. Furthermore, we describe changes in anthropometry and biochemistry from ART initiation until six months to describe micronutrient deficiency (e.g. Vitamin A, albumin and iron) and the inflammatory response (e.g. C-reactive protein).
Key messages
Children initiating ART have a poor dietary diversity with most children consuming a diet of cereal and cereal products – with very little vegetables, fats and oils, milk and milk products or eggs.
Average energy intake, fat, iron and calcium intake were lower than that recommended for HIV-positive children.
Results highlight the importance of counselling on dietary and care practices so caregivers understand how to balance food and nutrition with medication and select appropriate foods.
Nutritional messages should be adapted for the specific context (i.e. using locally available food products) to meet dietary requirements.
Adequate nutrition should be established early at ART initiation, to improve growth, development and health outcomes.
Methods
Study design
We conducted a prospective cohort study of HIV-positive children (aged 1–10 years) initiating treatment at the Alexandra Community Health Centre in Johannesburg, South Africa.
Study setting
Alexandra is a community located in the City of Johannesburg, sub-district E. Alexandra is one of the poorest urban areas in the country, has an extremely high density (about 26,000 people per km2 in 2011), and is one of the largest informal housing settlements in Gauteng. The living conditions are difficult and challenging due to lack of infrastructure, poor access to services, overcrowding, unemployment, malnutrition, illiteracy and rampant crime (Macdonald et al., Citation2011). Alexandra Community Health Centre is the biggest health centre in this area and the paediatric outpatient clinic has a multi-disciplinary team of part-time doctors, nurses and counsellors, while a dietitian, social worker, pharmacists, data capturers and administration assistants are shared with the adult HIV clinic.
In the period that the study commenced (08/2014-09/2016) patients were initiated on ART in accordance with the 2013 South African National Department of Health Paediatric ART therapy guidelines (Department of Health South Africa, Citation2013). These guidelines stated that all children under five years of age, irrespective of CD4 count and children between five and 15 years of age with WHO clinical stage III/IV or CD4 ≤ 350 cells/mm3 were eligible to start ART. First-line ART included a non-nucleoside reverse transcriptase inhibitor (NNRTI) and two nucleoside reverse transcriptase inhibitors (NRTI). First-line regimens for children less than three years of age or <10 kg was usually abacavir, lamivudine and lopinavir/ritonavir while for children three years and older and ≥10 kg abacavir, lamivudine and efavirenz.
According to the guidelines children on ART were seen at least monthly for regular follow-up and monitoring. These visits provide an opportunity to assess adherence and monitor response to ART based on weight gain, WHO staging and laboratory results. The guidelines also stipulate that all children initiating ART with a WHZ, WAZ or HAZ score <-2SD are required to receive nutritional supplementation and counselling (Department of Health South Africa, Citation2013)
Study procedures
HIV-positive ART naïve children (aged 1–10 years) initiating treatment between 08/2014 and 09/2016 were identified by health care practitioners at the clinic. Written informed consent to participate in the study was obtained from the parent/legal guardian. Assent was also obtained from older participants (i.e. six years of age and older). Participants were referred to the dietitian and clinic staff who performed the study procedures. All procedures were performed by trained clinic staff.
Some of the participants (including those with a WAZ or HAZ <-2SD) were provided with a nutritional supplement equivalent to 180 Kcal/day) divided into several servings, for six months in addition to their ART at their initiation visit and while on treatment. Participants returned to the clinic for study visits at one, three and six months. Where possible, study visits overlapped with routine ART monitoring visits and the accompanying parent/legal guardian was compensated ZAR150 (approximately US$20) for each study visit. At these visits participants were assessed by the clinic sister and thereafter the parent/legal guardian was interviewed by the dietitian.
At ART initiation and again at one and three months post initiation, the clinic nurse recorded height, weight, mid-upper arm circumference (MUAC), body temperature and WHO clinical staging. Weight-for-height Z-scores (WHZ), weight-for-age Z-scores (WAZ) and height-for-age (HAZ) Z-scores among children younger than 5 years of age were calculated using the WHO growth standards. Nutritional status was defined as stunting (HAZ <-2SD), wasting (WHZ <-2SD), and underweight (WAZ <-2SD). Severe acute malnutrition was defined as a MUAC less than 11.0 cm. Since WAZ, WHZ, HAZ are not routinely calculated for children older than 5 years of age, we used body mass index (BMI) which is weight in kilograms divided by the square of height in meters. BMI and BMI-for-age as well as nutritional status was determined from the FANTA BMI wheel (ENN, Citation2016).
The dietitian interviewed the patient and/or the parent/legal guardian and collected information on dietary intake and household food security. As some of the children in the study were under five years of age, the parent/legal guardian completed the interview on their behalf. Interviews were conducted in English and verbally translated into local language, where needed. The parent/legal guardian received dietary counselling, complementary feeding advice and information on food supplementation during the visit.
Food security was assessed using a standardized Household Food Insecurity Access Scale (HFIAS) questionnaire which asks about access, availability and usage of food in the past four weeks. The HFIAS guide was used to score the nine questions and determine the proportion of households experiencing food insecurity, defined as a household (not the individual) lacking secure access to sufficient amounts of safe and nutritious food for normal growth and development and an active and healthy life (Swindale & Bilinsky, Citation2006).
The UCL Infant Feeding Peer Support Trial 24-hour recall questionnaire, which is a standard protocol that uses the triple‐pass 24‐hour recall method, was used to record 24-hour dietary intake (University College London Department of Epidemiology and Public Health, Citationn.d.). The interviews included a detailed description of the type of food, preparation or cooking method used and brand name of food consumed. We used the Dietary Assessment Education Kit (DAEK) (Wolmarans, Kunneke, & Laubscher, Citation2009), which includes photographs of commonly consumed South African foods to help the interviewee identify the type of food consumed (e.g. thick slice of white bread). The DAEK tool contains pictures of different portion sizes to help interviewees accurately quantify food intake (e.g. standard thin slice 2 cm or thick slice 4 cm) (Steyn & Senekal, Citation2004). We also used flour food models to help interviewees estimate food portion sizes. The amount consumed by the subject was estimated by the respondent and expressed in terms of common household measures (i.e. tablespoon, cup, matchbox etc.). On days when children had been cared for by someone else, the parent/legal guardian was asked in advance to find out as much detail as possible about what the child consumed.
For the analysis, coding consisted of converting household measures into gram equivalents and this was entered into a nutritional analysis software program, FOODFINDER 3, which is based on the South African Medical Research Council (MRC) food composition tables. Quality control for dietary data was done periodically throughout the study periods by reviewing dietary recall data and spot-checking reported intakes and repeated training of the dietitian (interviewer) when needed. We analysed the three dietary intake assessments (enrolment, one and three months) separately and present the median and interquartile (IQR) of the average of the assessments completed.
To determine if the nutrient intake was above or below recommended values we followed a two-step process. First, we obtained the UK Dietary Reference Values (DRVs) for energy and macronutrients for different age categories (i.e. <2, 2–5 and >5 years). Next, we adjusted the DRVs for energy intake using the WHO reference ranges for individuals living with HIV (WHO, Citation2011) (i.e. an additional 10% and 30% is required for HIV-positive asymptomatic and symptomatic patients, respectively). Patients with WHO stage I/II clinical staging at initiation were considered asymptomatic for this particular study while those with WHO stage II/IV condition were considered symptomatic (i.e. conditions requiring increased energy such as tuberculosis, chronic lung disease, malnutrition chronic opportunistic infections or malignancies). We present the proportion of study participants with an energy or macronutrient intake less than the adjusted UK DRV/WHO recommended intake for energy or the UK DRVs recommended intake for macronutrients, respectively.
Dietary diversity (DD), defined as the number of different food groups consumed in the previous day (Swindale & Bilinsky, Citation2006), was calculated from the 24-hour dietary assessments. Food items consumed were categorized into different food groups. The number of food groups consumed in the previous 24 hours was calculated and the average of assessments completed (e.g. enrolment, one and three months post initiation) was used to calculate the DD score. A score greater than four indicates that the participant received at least four of the six main food groups (e.g. meat and meat products, cereal and cereal products, milk and milk products, legumes and legume products, vegetables and fruit) which would most likely provide sufficient nutrients needed for a healthy diet (WHO, Citation2008). Miscellaneous foods in this study were defined as any food considered non-nutritional. This was separate from the final score as it was considered an extra non-nutritionally dense food.
We summarized the common food groups consumed by all study participants from the dietary intake assessments completed (i.e. enrolment, one and three months post initiation) and report the 20 most commonly food groups alongside the food items consumed for that food group.
At six months, participants returned to the clinic for their routine ART monitoring visit and were seen by a doctor. The clinic nurse recorded anthropometric indices, body temperature and WHO clinical staging. A blood sample was collected at ART initiation and at six months post initiation for biochemistry. Blood samples were collected and sent to the laboratory for storage and later processed for Vitamin A, albumin, iron and CRP according to standard laboratory procedures. For the C-reactive protein, a CRLP3 (Roche Diagnostics, USA) immunoturbidimetric assay for in vitro quantification was used. This test measures the acute phase response of the inflammatory marker C-reactive protein, the concentration of which increases rapidly during inflammatory processes. The normal range is from 0–5 mg/L, and anything above that indicates inflammation throughout the body. For the analysis we used a cut-off of 9 µmol/L, 29 g/L and 0.70 µmol/L to define a low iron, serum albumin and Vitamin A concentration, respectively (Evans et al., Citation2013).
Statistical analysis
The demographic and clinical characteristics of participants at enrolment (i.e. ART initiation visit) were presented using the mean with standard deviation (normally distributed) or the median with interquartile range (not normally distributed) for continuous variables and proportions for categorical variables. For comparisons of groups (e.g. age categories) we used the student T-test for normally distributed or Kruskal-Wallis for not normally distributed data and the chi-square test for proportions.
Among patients that were alive and in care at six months, we describe the absolute change in biochemistry and growth parameters between enrolment and six months on ART. Patients that died, transferred out or where lost to follow-up (defined as ≥180 days since the last clinic visit; Chi et al Citation2011) were excluded from this analysis. The absolute change was calculated as the value at six months minus the value at ART initiation. For continuous data, the value at six months was compared to the value at ART initiation using paired T-test (parametric or normally distributed data) or the Wilcoxon signed rank sum test (non-parametric or not normally distributed data). As with routine clinical data, there was missing data in our data. We used multiple imputation by chained equations to impute missing values in our dataset (Collins, Reitsma, Altman, & Moons, Citation2015; Royston & White, Citation2011). We assumed that data are missing at random (MAR) and compare the robustness of the estimations between the complete case analysis (n = 27) with those obtained from a multiple imputed dataset.
All analyses were performed using STATA (Statacorp, College Station, TX, USA) statistical version 13.
Ethics
Parent/legal guardian of eligible participants provided written informed consent to take part in the study. Assent was also obtained from older participants (i.e. older than six years of age) to take part in the study. The study was approved by the University of the Witwatersrand Human Research Ethics Committee (Medical protocol M131161).
Results
Twenty-seven participants were enrolled. Fifteen participants completed six months of follow-up; five transferred out of the clinic to different provinces and could not be followed up for the study and seven did not complete the 6-month study visit (i.e. three were lost to follow-up and four were still active in care at the study site but did not complete the study visit). Clinical and demographic characteristics of the 27 participants enrolled in the study are presented in .
Table 1. Demographic and clinical characteristics at enrolment (n = 27)
Demographics and clinical characteristics at ART initiation
The median age of the group was 30 months (IQR 16–60) and 55.6% were female. The majority, 70% (19/27) received a nutritional supplement at ART initiation and while on treatment. 88.9% of the children had caregivers who were South African, with 85.2% of caregivers being the mother of the child. The majority of the caregivers were unemployed (63.0%); and 11.1% of households experienced food insecurity ().
Table 2. Daily dietary intake and dietary diversity (DD) score
Table 3. Common food groups consumed as reported in 24-hour dietary intake assessments
The median weight for the children was 11.5 kg (9.1–15.9 kg); their median height was 88 cm (77–103) and their MUAC was 14.4 cm (11.8–15). 62.9% of the study participants were on an ART regimen of abacavir, lamivudine and lopinavir/ritonavir; while 33.4% were on abacavir, lamivudine and efavirenz. At enrolment, 74.1% of the population were at an early stage of HIV disease (WHO clinical stage I and II). At initiation, 18.5% of children presented with severe acute malnutrition (MUAC <11cm), 14.3% were underweight (WAZ <-2SD), 19.1% stunted (HAZ <-2SD) and 33.4% were wasted (WHZ <-2SD).
Dietary diversity and UK DRV/WHO recommendations
Using the 24-hour dietary intake assessment we determined the dietary intake and dietary diversity (). The percentage of HIV-positive children with average energy (kJ) and carbohydrate intake lower than the recommended intake was 63.0% and 37.0%, respectively. Only one participant (under two years of age) had a protein intake less than the UK DRV recommendation. More concerning is that the majority of the children included in this study (77.8%, 81.5% and 92.6%) had their fat, iron and calcium intakes lower than the recommended intake for their age category. Of particular concern is that all (n = 16; 100%) of the children two years and older had their calcium intake below the recommendations. Vitamin A intake was a little more encouraging, with 66% of children having intake above the UK DRV recommendation. When comparing nutrient intakes, there were no differences in the absolute values or the proportion below the recommendations across the different age categories (p > 0.05). More children two years and older had average energy intake (kJ) below the UK DRV/WHO recommendations as compared to those in the under two year age group (81.3% vs. 36.4%, p = 0.059). More than 50% (59.3%) of the children had a dietary diversity score greater than 4. The mean DD score was 3.59 (SD 0.636). More than half (55.6%) of the children had consumed at least one non-nutritional food in the previous 24 hours.
A count of each food group eaten by each participant was done based on the 24-hour dietary intake assessments completed (). The most popular food group consumed was cereal and cereal products. The least consumed food group was nuts and seeds (i.e. legumes and legume products) with no participant having consumed this type of food. In terms of percentage intake, 54.0% of energy came from carbohydrates – with total sugar contributing 7% and 5% from added sugar.
Percentage change from enrolment to six months on ART
At six months we collected a blood sample for Vitamin A, albumin, iron and CRP from 15 participants who were alive and in care. At six months, there was a general increase in WHZ and BMI as these growth parameters are dependent on and highly correlated with, height and weight, which also increased. Both HAZ and WAZ growth parameters showed a negative change at six months ().
Table 4. Percentage change in characteristics from enrolment to six months (n = 15)
At six months, there was a general increase in CRP, iron, Vitamin A and albumin. At six months, children showed a significant increase in Vitamin A (0.3 IQR 0.0 to 0.4; p = 0.038) compared to ART initiation (). Results obtained from the multiple imputed dataset yielded similar findings to the complete case analysis (Supplementary Table 1). For biochemical parameters at enrolment only the cross tabulation of iron by age groups, showed that children under two years had significantly lower iron levels (<2 years; 6.5 mg/dl IQR 5.7–7.5 vs. 2–5 years; 7.8 mg/dl IQR 6.8–11.2 and >5 years; 14.3 mg/dl IQR 11.5–16.8 mg/dl: p = 0.024) than children two years and older.
Discussion
This study describes the dietary intake of children initiating ART and identifies potential areas where nutritional counselling may be beneficial. We show that the proportion with abnormal growth parameters (e.g. 33% with WHZ <-2SD) at ART initiation is alarmingly high in these young children. We also show that 18.8% of children had levels Vitamin A below the normal range while 53.3% of children had elevated CRP levels (>5 mg/L), which is a marker of inflammation, at ART initiation. More than half of the children had iron levels below the normal range, with children under two years being particularly susceptible. In terms of dietary diversity, we show that most children initiating ART consume a diet of cereal and cereal products – with very little vegetables, fats and oils, milk and milk products or eggs. These results support the 24-hour recall which showed that average energy, fat, iron and calcium intake were lower than the recommendations. Close to 40% of children had a DD score less than four which suggests that their diet will most likely not provide sufficient nutrients to support healthy growth and development.
Overall, the children in this cohort showed improvements in height, weight, BMI and WHZ after six months on ART. At six months on ART, children showed a significant improvement in Vitamin A (biochemistry) when compared to ART initiation – these results are encouraging and may reflect efforts by the National Department of Health to provide Vitamin A supplementation (syrup) at the clinic every six months (starting at 6 months old), until the child is 5 years old (Department of Health South Africa, Citation2013). Of particular concern, while not a primary outcome of this study, we observed much higher rates of lost to follow-up (11.1% vs. 3.6%) and transfer out to another facility (18.5% vs. 10.7%) as compared to previous studies (Macdonald et al., Citation2011).
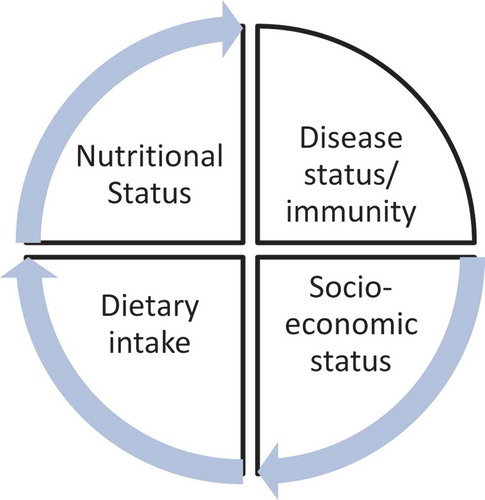
The effects of low socio-economic status/poverty on food security thus dietary diversity and child malnutrition are pervasive (Sanders & Chopra, Citation2012), in both urban and rural areas (Arimond & Ruel, Citation2004; Hatløy, Hallund, Diarra, & Oshaug, Citation2000). Although a small proportion (11.1%) reported household food insecurity, given the setting and high rates of unemployment we expected a low socio-economic status. In this population the low consumption of fruits and vegetables may be a more useful indicator of socio-economic status as most households spend their income on staple foods such as maize meal, rather than fresh produce which is generally more expensive. To summarize this, we show the relationship between dietary intake, nutritional status impacted by the socio-economic status of the household, and the impact of poor nutrition on HIV disease progression ().
Figure 1. Socio-economic status as relates to nutritional status.
Less than one in five children under two years of age (n = 2/11; 18.2%) were still breastfeeding. It is important that the continuation of breastfeeding is supported after the age of six months during the complementary feeding period since breast milk has a relatively high fat content compared to most complementary foods and is a key source of energy, essential fatty acids and micronutrients. Data shows that for a 12–23 month infant, breast milk can contribute 35–40% of daily energy requirements (WHO, Citation2011).
The UK DRV and/or WHO recommendations for children were not being met for most of the major nutrients including energy, fats, iron, calcium and Vitamin A at enrolment. Protein, however, showed a different picture with all the children except for one child having protein intake above the WHO recommendation. This is also reflected in the biochemistry that showed albumin levels were not low in the children. A lower than recommended dietary intake of energy and protein affects the child in that they are at higher risk of HIV disease progression (malnutrition – infection complex), with protein in particular providing the precursor of immune response markers e.g. CRP and IL-6. WHO recommends that sugar be less than 10% of the total dietary intake (Dewey & Brown, Citation2003), and our study showed that total sugar contributed 7% of total energy and 5% from added sugar. In our study, just over half of the children consumed some food that did not provide any nutritional value and we hypothesized that consumption of energy dense, micronutrient poor foods, displace micronutrient rich foods which negatively influences uptake and may exacerbate deficiencies further.
In order for us to understand if what we were observing in the single-facility study was similar to what is being observed nationally, we compared our results to those presented in the South African Demographic Health Survey Data (SA DHS). We found that, in our study, the proportion with abnormal/low HAZ, WHZ, WAZ were worse than national estimates presented in the SA DHS of 2016. This is expected because the national average includes those who have no adverse health conditions. The relationship of malnutrition on immune suppression and infection is complicated by the profound effects of a number of infections on nutrition itself (Schaible & Kaufmann, Citation2007), these are likely the combined effects we see in the children initiating ART with the phenomenon of wasting, underweight and stunted all being observed.
Limitations
Results should be considered in light of the study limitations. First, our sample was small and the study was descriptive so it was not possible to make inferences about causality. We used a single site which has a high HIV burden, low socio-economic status and high rates of unemployment, which means children may be worse than other settings. This may limit the generalizability of our findings to other settings.
It would have been useful to collect information (e.g. immunizations, Vitamin A supplementation etc.) from the children’s Road to Health Booklet (RTHB). Unfortunately, caregivers often don’t bring the RTHB to clinic visits making this an unreliable data source. Laboratory data (e.g. CD4 and viral load) relied on routinely collected data, which was often missing in the paper and electronic patient medical record. This restricted the outcomes analysis at six months on ART to biochemistry and growth parameters.
Another limitation was the number of participants who were lost to follow up (11.1% of the sample). These participants could not be included in the six month analysis. As we do not have CD4 or other measurements at enrolment, we could not determine whether these patients were sicker at ART initiation, and therefore at increased risk of mortality. Data from the 24-hour recall may not represent the long-term dietary habits of the patient and only estimates intake. Recall bias may have contributed to an underestimation of dietary intake especially if the child is not with the caregiver for the entire day (e.g. the child eats at crèche or at a restaurant). Using WHO clinical staging to determine if patients were symptomatic or asymptomatic may have resulted in misclassification, and subsequently over – or under-estimation of the proportion of children with intakes less than the UK DRV and/or WHO recommendations.
Recommendations
This study highlights the need to not only focus on finding HIV-positive children and initiating them on ART as quickly as possible but also on enhancing the nutritional adequacy of their dietary intake when they initiate ART. We recommend that the Department of Health in conjunction with the Department of Social Development, provide referral to food assistance and, on diagnosing children as HIV-positive, assess their eligibility to receive an intervention such as access to a child support grant or referral to a food basket program. Interventions supporting caregivers of HIV-positive children initiating ART could improve ART treatment outcomes, and reduce lost to follow-up, especially if referrals are linked to the health system. Interventions that include dietary counselling on the importance of fruit and vegetables over micronutrient poor foods could prove beneficial in enhancing dietary adequacy in children initiating ART.
The current DOH policies of Vitamin A supplementation and Tshwane Declaration on breastfeeding would still be very crucial in ensuring dietary adequacy of the child’s diet (SAJCN, Citation2011).
Author contributions
DE, LL, IS and AF conceptualised and designed the study. NM, SP, MM and LM developed study material, were involved in study implementation, conducted interviews and did quality checks. NM coded and analysed the data. AF and DE checked the coding and analysis. IS and AF were involved in clinical interpretation and contributed to the Discussion and Limitations sections. NM wrote the first draft of the manuscript. All authors were involved in revising it critically for important intellectual content and final approval of the manuscript.
Acknowledgments
We would like acknowledge field work support from Alice Kono, Thembi Mazibuko, Wendy Mthembu, Ntombifuthi Thamba, Thembi Phakathe and Pertunia Maganye. We would also like to thank all the guardians/caregivers and children who participated in the study.
Disclosure statement
No potential conflict of interest was reported by the authors.
Additional information
Funding
References
- Arimond, M., & Ruel, M. T. (2004). Dietary diversity is associated with child nutritional status: Evidence from 11 demographic and health surveys. The Journal of Nutrition, 134(10), 2579–2585.
- Chi, BH, Yiannoutsos, CT, Westfall, AO, Newman, JE, Zhou, J, & Cesar, C, ...Thiebaut, R. (2011). Universal definition of loss to follow-up in HIV treatment programs: A statistical analysis of 111 facilities in Africa, Asia, and Latin America. Plos Med, 8(10), e1001111. doi: https://doi.org/10.1371/journal.pmed.1001111
- Collins, G. S., Reitsma, J. B., Altman, D. G., & Moons, K. G. M. (2015). Transparent reporting of a multivariable prediction model for individual prognosis or diagnosis (TRIPOD): The TRIPOD statement. BMJ, 7(350), g7594.
- Davies, M.-A., Keiser, O., Technau, K., Eley, B., Rabie, H., & van Cutsem, G.; International Epidemiologic Databases To Evaluate AIDS Southern Africa (IeDEA-SA) collaboration. (2009). Outcomes of the South African National Antiretroviral Treatment Programme for children: The IeDEA Southern Africa collaboration. South African Medical Journal = Suid-Afrikaanse Tydskrif Vir Geneeskunde, 99(10), 730–737.
- Department of Health South Africa. (2013). Guidelines for the management of HIV in children. Retrieved from http://www.doh.gov.za/docs/factsheets/guidelines/paediatric.pdf
- Dewey, K. G., & Brown, K. H. (2003). Update on technical issues concerning complementary feeding of young children in developing countries and implications for intervention programs. Food and Nutrition Bulletin, 24(1), 5–28.
- Ebissa, G., Deyessa, N., & Biadgilign, S. (2016). Impact of highly active antiretroviral therapy on nutritional and immunologic status in HIV-infected children in the low-income country of Ethiopia. Nutrition, 32(6), 667–673.
- Editorial office (SAJCN). (2011). The Tshwane declaration of support for breastfeeding in South Africa. South African Journal of Clinical Nutrition. 24 (4), 214. http://www.sajcn.co.za/index.php/SAJCN/issue/view/55.
- ENN. (2016). FANTA’s Body Mass Index (BMI) wheel. Retrieved from www.ennonline.net/fex/53/fantasbodymassindexbmiwheel
- Evans, D., McNamara, L., Maskew, M., Selibas, K., van Amsterdam, D., Baines, N., … Sanne, I. (2013). Impact of nutritional supplementation on immune response, body mass index and bioelectrical impedance in HIV-positive patients starting antiretroviral therapy. Nutrition Journal, 12(1), 111.
- FAO; IFAD; UNICEF; WFP; and WHO. (2017). The state of food security and nutrition in the world 2017: Building resilience for peace and food security. Rome: FAO. Retrieved from http://www.fao.org/3/a-I7695e.pdf
- Fassinou, P., Elenga, N., Rouet, F., Laguide, R., Kouakoussui, K. A., Timite, M., … Msellati, P. (2004). Highly active antiretroviral therapies among HIV-1-infected children in Abidjan, Côte d’Ivoire. AIDS (London, England), 18(14), 1905–1913.
- Hatløy, A., Hallund, J., Diarra, M. M., & Oshaug, A. (2000). Food variety, socioeconomic status and nutritional status in urban and rural areas in Koutiala (Mali). Public Health Nutrition, 3(1), 57–65.
- Katona, P., & Katona-Apte, J. (2008). The interaction between nutrition and infection. Clinical Infectious Diseases : an Official Publication of the Infectious Diseases Society of America, 46(10), 1582–1588.
- Macdonald, P., Maskew, M., Evans, D., Leon, L., Untiedt, S., & Sanne, I. (2011). HAART alone is not enough to deal with pediatric HIV: Treatment outcomes from a resource-limited setting in South Africa. Vulnerable Children and Youth Studies, 6(3), 208–221.
- Merchant, R. H., & Lala, M. M. (2012). Common clinical problems in children living with HIV/AIDS: systemic approach. The Indian Journal of Pediatrics, 79(11), 1506–1513.
- Nyandiko, W. M., Otieno-Nyunya, B., Musick, B., Bucher-Yiannoutsos, S., Akhaabi, P., Lane, K., … Wools-Kaloustian, K. (2010). Outcomes of HIV-exposed children in Western Kenya: Efficacy of prevention of mother to child transmission in a resource-constrained setting. JAIDS Journal of Acquired Immune Deficiency Syndromes, 54(1), 1.
- Royston, P., & White, I. R. (2011). Multiple imputation by chained equations (MICE): Implementation in Stata. Journal of Statistical Software, 45(4), 1–20.
- Sanders, D., & Chopra, M. (2012). Poverty, social inequity and child health. In M. Kibel, H. Salojee, & T. Westwood (Eds.), Child health for all: A manual for Southern Africa (5th ed., pp. 26–35). Cape Town: Oxford University Press Southern Africa.
- Schaible, U. E., & Kaufmann, S. H. E. (2007). Malnutrition and infection: Complex mechanisms and global impacts. PLoS Medicine, 4(5), e115.
- South African National AIDS Council (SANAC). (2016). Let our actions count: Reflections on NSP 2012-2016 and moving forward to NSP 2017-2022ʹ.
- Steyn, N. P., & Senekal, M. (2004). A guide for the use of the Dietary Assessment and Education Kit (DAEK). ISBN: 1-920015-09-04
- Sunguya, B. F., Poudel, K. C., Otsuka, K., Yasuoka, J., Mlunde, L. B., Urassa, D. P., … Jimba, M. (2011). Undernutrition among HIV-positive children in Dar es Salaam, Tanzania: Antiretroviral therapy alone is not enough. BMC Public Health, 11(1), 869.
- Sutcliffe, C. G., van Dijk, J. H., Munsanje, B., Hamangaba, F., Sinywimaanzi, P., Thuma, P. E., & Moss, W. J. (2011). Weight and height z-scores improve after initiating ART among HIV-infected children in rural Zambia: A cohort study. BMC Infectious Diseases, 11(1), 54.
- Swindale, A., & Bilinsky, P. (2006). Household Dietary Diversity Score (HDDS) for measurement of household food access: Indicator guide (version 2). Washington, DC: FHI 360/FANTA
- UNAIDS.(2017).UNAIDSDATABOOK. Retrieved from https://www.unaids.org/sites/default/files/media_asset/20170720_Data_book_2017_en.pd,Switzerland
- University College London Department of Epidemiology and Public Health. (n.d.). Infant feeding support trial. Retrieved from http://dapa-toolkit.mrc.ac.uk/
- Weigel, R., Phiri, S., Chiputula, F., Gumulira, J., Brinkhof, M., Gsponer, T., … Keiser, O. (2010). Growth response to antiretroviral treatment in HIV-infected children: A cohort study from Lilongwe, Malawi. Tropical Medicine & International Health, 15(8), 934–944.
- Wolmarans, P., Kunneke, E., & Laubscher, R. (2009). Nutr use of the South African Food Composition Database System (SAFOODS) and its products in assessing dietary intake data: Part II. South African Journal of Clinical Nutrition, 22 (2), 59–67
- World Health Organization. (2008). Global Strategy on Infant and Young Child Feeding (WHA55 A55/15). World Health Organization. Retrieved from http://apps.who.int/iris/bitstream/handle/10665/259364/WHA55-2002-REC1-eng.pdf?
- World Health Organization. (2011). Manual on paediatric HIV care and treatment for district hospitals: Addendum to the pocket book of hospital care of children, 9th ed. Retrieved from https://www.ncbi.nlm.nih.gov/books/NBK304127/