
 ?Mathematical formulae have been encoded as MathML and are displayed in this HTML version using MathJax in order to improve their display. Uncheck the box to turn MathJax off. This feature requires Javascript. Click on a formula to zoom.
ABSTRACT
Preserved feed from meadows contaminated with ragwort (Jacobaea vulgaris, Gaertn.) may expose livestock to pyrrolizidine alkaloids (PA). Dairy cows are considered to be very susceptible animals and a PA ingestion can lead to liver and further organ damages and even death. Due to the lack of data, the present study aimed to evaluate critical PA doses based on organ effects, with a special focus on liver lesions and on indicators of energy metabolism. Therefore, 16 dairy cows (n = 4 per group) were exposed to increasing PA doses (group: CONMolasses: <0.001 mg PA/kg body weight (BW)/day (d); PA1: 0.47 mg PA/kg BW/d; PA2: 0.95 mg PA/kg BW/d; PA3: 1.91 mg PA/kg BW/d) for 28 days. Constant dosing was ensured by a defined PA extract administered orally once daily. Histological examinations of the livers showed infiltration by immune cells, higher proportions of apoptotic cells and enlargement of hepatocyte nuclei in the highest exposed group. In addition, bile volume increased with PA dose, which may indicate a cholestasis. Despite the signs of incipient liver damage, liver lipid content and clinical chemical parameters related to energy metabolism, such as glucose, non-esterified fatty acids and βhydroxybutyrate, remained unaffected. Fat depot masses were also not significantly altered over time, suggesting that PA exposure did not induce a wasting syndrome. The liver showed slight microscopic changes already at a dosage of 0.95 mg PA/kg BW/d. However, the short-term metabolic indicators of energy status, lipolysis and ketogenesis, glucose, NEFA and BHB, as well as changes in fat depot, which serves as a longer-term indicator of lipolysis, remained unaffected in all treatment groups in the chosen scenario. These findings suggest that despite histopathological and clinical-chemical evidence of PA-associated hepatocellular lesions, liver function was not compromised.
1. Introduction
Pyrrolizidine alkaloids (PA) are toxic secondary plant compounds that protect the plant against predators. PA occur in more than 6000 plant species with more than 600 known isolated structures. PA are found in tansy ragwort (Jacobaea vulgaris, Gaertn., syn. Senecio jacobaea, L.) which belongs to the family Astaraceae.
Tansy ragwort has become very widespread in recent years. Inadequate pasture management or PA-contaminated preserved feed, such as hay or pellets, can lead to exposure of the animals. The processing of feed prevents the avoiding selection by the animals. Ingestion of ragwort, containing PA, poses risks of hepatotoxicity, developmental toxicity, genotoxicity and carcinogenicity (Mattocks et al. Citation1986; Fu et al. Citation2004; Hoogenboom et al. Citation2011; EFSA Citation2016). These effects depend on dose, exposure time and species, with cattle considered as susceptible animals (P. Johnson Citation1978; Cheeke and Pierson-Goeger Citation1983; Cheeke Citation1984).
The metabolism of PA is crucial for their toxicity and occurs predominantly in the rumen and liver of cattle. While PA N-oxides (PANO) are rapidly metabolised to the corresponding free base form and finally to saturated, non-toxic structures in the rumen (Cheeke Citation1988; Taenzer et al. Citation2022), hepatic metabolism contributes significantly to the overall PA toxicity in cattle. In particular, hepatic cytochrome P450 monooxygenases enzymatically transform PA into reactive metabolites (pyrrolic esters) causing liver damage that might finally result in a loss of functional liver capacity (Mattocks et al. Citation1986; Fu et al. Citation2004; Ruan et al. Citation2015).
The liver is the central organ for metabolism and the major coordinator of nutrient fluxes (Drackley et al. Citation2001). Dickinson et al. (Citation1976) showed that high-dose PA exposure, approximately 16 mg PA/kg body weight (BW)/day (d), over a period of 5–10 days, followed by a gradual 50–75% dose reduction up to 26 days, resulted in megalocytosis, portal fibroplasia and centrilobular necrosis. The liver may not be able to balance the synthesis of lipoproteins needed to transport lipid compounds to peripheral tissues. This could increase the hepatocellular accumulation of lipids and further trigger lesions (van den Top et al. Citation1996), as indicated by elevated systemic blood concentrations of gamma-glutamyltransferase (GGT) and aspartate aminotransferase (AST) (Chamberlin et al. Citation2013).
Depending on the exposure scenario, PA-induced hepatosis could significantly affect the energy and nutrient metabolism of the animal. Even if feed intake remains unaffected the animal could suffer from a shortage of nutrients and energy, ultimately leading to wasting, with body weight loss being associated with lipomobilisation and muscular proteolysis. Therefore, energy metabolism is inherently associated with liver function and might consequently be influenced by PA exposure.
In addition to the hepatotoxic effects of PA and resulting PA metabolites, toxic effects on extrahepatic organs and tissues cannot be excluded. For example, pulmonary damages as well as damages on the kidneys and the gastrointestinal tract have been reported in male rats administered a single dose of 140 mg PA/kg BW (Mattocks et al. Citation1986).
Previously published data from the present study by Knoop et al. (Citation2023), showed that doses of 1.91 mg PA/kg BW/d over 28 days in dairy cows may lead to incipient liver damage characterised by increased concentrations of specific liver parameters, more precisely alkaline phosphatase (ALP), GGT, AST and glutamate dehydrogenase (GLDH), while performance parameters such as BW, dry matter (DM) intake or milk yield remained unaffected.
On the basis of these results, we hypothesised that PA exposure in dairy cows would cause dose-dependent liver damage, resulting in impaired metabolic function with consequences for energy metabolism.
2. Material and methods
2.1. Experimental design and procedures
The present dose-response study is described in more detail by Knoop et al. (Citation2023) and was conducted in accordance with the German Animal Welfare Act approved by the Lower Saxony State Office for Consumer Protection and Food Safety (LAVES), Germany (file number 33.19425020419/3191). In brief, 16 pluriparous, non-pregnant, lactating German Holstein cows were allocated to four treatment groups (n = 4 per group). The control group CONMolasses exclusively received molasses. While the highest PA group (PA3) got only a well-defined PA extract, the PA1 and PA2 group received a combination of PA extract and molasses to compensate the high sugar amount of the extract. This resulting in PA exposures of 0.47 and 0.95 and 1.91 mg PA/kg BW/d, respectively.
Blood samples were collected on days 0, 1, 2, 3, 5, 7, 10, 14, 21 and 28. After incubation at 30°C for 30 minutes, the samples were centrifuged for blood serum preparation (Heraeus Varifuge 3.0 R Heraeus, Osterode, Germany; 2123 × g, 15°C, 15 min). Blood serum was stored at −80°C until analyses for glucose, βhydroxybutyrat (BHB) and non-esterified fatty acids (NEFA).
Liver biopsy samples of approximately 200 mg were obtained under local anaesthesia (procaine hydrochloride; isocain 2%, Selectavet, Weyarn-Holzolling, Germany) using an automated spring-loaded biopsy instrument (Bard Magnum, Bard, UK) equipped with a 16-gauge needle on day 0, before the first PA administration, and on day 7. The same instrument was used to obtain the final samples on day 28 from livers dissected at slaughter, at the same location as the in vivo sampling site (Lobus dexter hepatis, Facies parietalis). The sampled tissue was immediately frozen in liquid nitrogen and stored at −80°C until further processing.
The internal fat depots were recorded exclusively in the CONMolasses and PA3 groups using an ultrasonic measurement method according to Raschka et al. (Citation2016), performed before the start of the trial and on day 28 before slaughter. The method allows the assessment of the masses of subcutaneous adipose tissue (SAT), retroperitoneal AT (RAT), omental AT (OAT) and mesenteric AT (MAT). Therefore, a Mindray M5 Vet (Mindray, Shenzhen, China) diagnostic ultrasound system with either a linear (6 MHz, Mindray 6LE5Vs) or a convex (3 MHz, Mindray 3C5s) probe was used.
At day 28, two h after the last PA administration the cows were slaughtered. Cows were stunned by bolt-shot and killed by exsanguination by severing the major cervical vessels. Organs were dissected, weighed and examined macroscopically. Samples of all layers of the wall of the ventral sac of the rumen (caudal, medial, cranial), the liver (lobus dexter hepatis), lungs, kidney, gallbladder were prepared for histopathological examinations.
The pelvic cavity AT, the AT surrounding the kidney, the rumen, the intestines, the omasum, the abdominal AT (AAT) and the SAT were dissected and weighed separately for the CONMolasses and PA3 groups. This formed the basis for the validation of the ultrasonic measurement method.
2.2. Analyses and histology evaluation
2.2.1. Blood serum
Blood serum analyses for glucose (Glucose (HK), REF 981,779, Thermo Fisher Scientific Oy, Vantaa, Finland), BHB (βhydroxybutyrate, REF 984,325, Thermo Fisher Scientific Oy, Vantaa, Finland) and NEFA (NEFA-HR (2) Assay, Fujifilm Wako Chemicals Europe GmbH, Neuss, Germany) were performed using an automated analysis system (IndikoTM Plus, Thermo Fisher Scientific, Hennigsdorf, Germany).
2.2.2. Organ histopathology and morphometry of hepatocyte nuclei
Liver biopsy samples as well as organ samples (gallbladder, lung, spleen, kidney, rumen) were fixed in 10% formaldehyde solution buffered with calcium carbonate for at least 24 h and embedded in paraffin. Tissues were then sectioned at 5 µm thickness and stained with haematoxylin and eosin (H&E) for histological examination. Results are reported cumulatively from two evaluated slides.
Sections of organ tissue (gallbladder, lung, spleen, kidney, rumen) were scored microscopically for the presence of morphological lesions and infiltration with inflammatory cells. The result was given a score: 0, 1, 2 and 3 for no, low, medium and high occurrence, respectively.
The increase in hepatocytes with enlarged nuclei was also scored from 0 to 3 for corresponding occurrence, resulting in the hepatocyte nucleus enlargement score. Hepatic immunological activity was scored, in turn, as focal infiltration of macrophages with multinucleated giant cells (granulomatous inflammation) and eosinophilic granulocytes, focal/multifocal lymphohistiocytic portal infiltration with eosinophilic granulocytes. This score was also divided into 4 grades (0 to 3).
The sum of the hepatocyte nucleus enlargement score and the liver immunological activity score at day 28 resulted in a total liver score ranging from 0 to 6, with 6 representing the greatest deviation from a healthy liver.
For the analysis of histomorphometry changes over the course of the trial, the liver cell nucleus area was measured individually (VWR VisiCam 16 Plus; WaveImage) on the H&E stained histological slides. The mean of the area of 100 nuclei per liver section was calculated for the evaluation.
2.2.3. Total liver lipid concentration
Total liver lipid content was determined by a gravimetric method as described in detail by Starke et al. (Citation2010). Briefly, homogenised liver tissue was extracted with hexane (95%) and isopropanol (v/v, 3:2). After several extraction steps the supernatant was evaporated using a vacuum centrifuge (RVC 2–18, Martin Christ Gefriertrocknungsanlagen GmbH, Osterode, Germany). The weight of the extracted total lipid was related to the sample weight and expressed as mg/g fresh liver.
2.3. Calculations
Prediction equations, as proposed by Raschka et al. (Citation2016), were used to convert the ultrasound-measured distances of anatomical structures into kg of the respective ATs, whereby AAT is the sum of RAT, OAT and MAT:
2.4. Statistics
Statistical analyses were performed using the SAS software (version 9.4; SAS Institute Inc., Cary, NC, USA) with the MIXED procedure for repeated measures (Littell et al. Citation1998). Results are presented as LS means with standard errors (SE). The last measurement before the start of the trial (if available) was used as covariate. The model giving the best Akaike information criterion corrected for small sample size (AICC) was obtained by comparing different covariance structures. The values group, day and the interactions between group and day were set as fixed factors, while cow was implemented as a random effect. Data without repeated measures were also analysed with the MIXED procedure with the value group as the only fixed factor. Data were subjected to the Tukey adjusted t-test (PDIFF), where differences were considered significant at p ≤ 0.05 and p ≤ 0.1 as tendency. To estimate the correlation coefficients between values, linear regression was calculated using the software Statistica (TIBCO Software Inc. 2020, version 14).
3. Results
3.1. Indicators of energy metabolism
The mean glucose concentration () showed an initial decrease on day 1. Thereafter, the mean glucose concentration increased slightly until day 2 and remained almost constant throughout the trial, with a slight decrease during the last week. The mean BHB concentration () increased on day 1 of the experiment. This was followed by a decrease until day 5. Thereafter, the mean BHB concentration increased until day 7, remained constant until day 21 and then increased again until the end of the trial. The mean concentration of NEFA () increased on day 1 and then decreased until day 5. After that, the mean NEFA concentration remained almost constant. These changes in mean glucose, BHB and NEFA concentrations during the first day of the study resulted in a significant time-related effect, but no treatment-related effects occurred.
Figure 1. Concentration of glucose [a], β-hydroxybutyrate (BHB) [b] and non-esterified fatty acids (NEFA) [c] in blood serum of dairy cows exposed to increasing concentrations of pyrrolizidine alkaloid (PA) over the course of the trial.
![Figure 1. Concentration of glucose [a], β-hydroxybutyrate (BHB) [b] and non-esterified fatty acids (NEFA) [c] in blood serum of dairy cows exposed to increasing concentrations of pyrrolizidine alkaloid (PA) over the course of the trial.](/cms/asset/0cc1e601-3d66-4489-a246-64d135a4fa20/gaan_a_2350095_f0001_oc.jpg)
The fat depots of the CONMolasses and PA3 groups showed the same distribution of the different predicted AT () with increasing percentages of MAT, OAT and RAT before the start of the experiment. There were slight changes in the percentage distribution of these AT over the course of the experiment, but these did not result in any significant differences. During the experiment, the amount of AAT () increased more distinctly in the CONMolasses group compared to the PA3 group (pGroup = 0.440). A similar evolution can be seen for the predicted SAT in the CONMolasses group, whereas in the PA3 group the SAT decreased (pGroup = 0.395, pDay = 0.545, pGroupxday = 0.367).
Figure 2. Composition of abdominal adipose tissues (AAT) containing retroperitoneal at (RAT), omental at (OAT), mesenteric at (MAT) before the start of the trial and at the end of the trial (d28) (left ordinate) and the resulting AAT in absolute masses (right ordinate) of the treatment groups determined by ultrasonic measurement method.
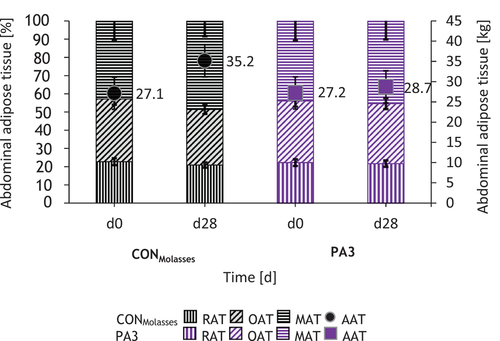
The results of the relative weights of the AAT masses determined by ultrasound were compared with the relative weights measured after slaughter. A significant positive correlation was found (r2 = 0.763, p = 0.006), with the ultrasound value being on average 39% higher.
3.2. Liver evaluation
Macroscopic evaluation of the liver showed no deviation from normal, and relative liver weight showed no significant differences between the groups ().
Table 1. Mean relative organ weights of dairy cows after a short-term PA exposure scenario on exposure day 28 with corresponding p-Values.
3.2.1. Histopathology
No cow exhibit enlarged hepatocyte nuclei before the start of the trial. A low-degree increase in hepatocytes with enlarged vesicular nuclei was observed in group PA3 on day 7. On day 28 of the experiment, a low to high incidence of hepatocytes with enlarged vesicular nuclei was noted in all sampled groups, most pronounced in group PA3, with a significance for the hepatocyte nucleus enlargement score (pGroup = 0.037) calculated for day 28 (, ).
Figure 3. Liver histopathology scores for the different PA exposure groups on day 28.
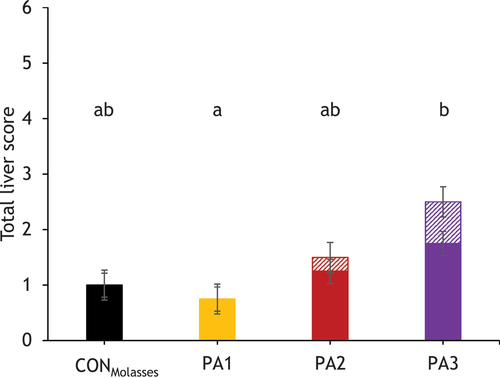
Figure 4. Liver histology of the control group. CONMolasses (<0.01 mg PA/kg BW/d, left pictures) and group PA3 (1.91 mg PA/kg BW, right pictures) at 200 and 400 times magnification at day 28 of the experiment.
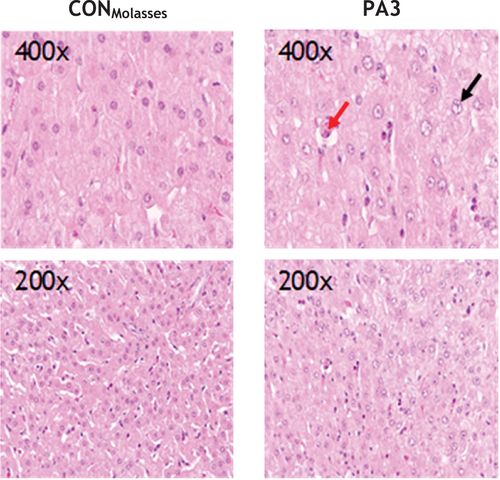
Table 2. Histopathological findings in the liver of dairy cows on days 0, 7 and 28 of the PA exposure with regard to enlargement of the hepatocyte nuclei (*) and immunological activity (+), characterised by focal infiltration of macrophages with multinucleated giant cells (granulomatous inflammation) and eosinophilic granulocytes, multifocal lymphohistiocytic portal infiltration with eosinophilic granulocytes or focal lymphohistiocytic infiltration. A symbol within a category represents an individual animal (n = 4 per group).
On day 0, groups CONMolasses, PA1 and PA3 showed low-degree liver lesions including focal infiltration of macrophages with multi-nucleated giant cells (granulomatous inflammation) and eosinophilic granulocytes, focal and multi-focal lymphohistiocytic portal infiltration by eosinophilic granulocytes (). The cows in group PA1 and PA3 showed a similar picture on day 7, while group PA2 also showed focal lymphohistiocytic portal infiltration (). On day 28, group PA2 still showed low-degree focal lymphohistiocytic infiltration and group PA3 exhibited low-degree multifocal lymphohistiocytic portal infiltration with eosinophilic granulocytes and moderate-degree multifocal accumulation of neutrophils and eosinophils in sinusoids. Groups PA2 and PA3 also developed multiple pyknotic hepatocytes (, ). The liver immunological activity score calculated for day 28 showed no significant differences between the groups (pGroup = 0.217, ).
The resulting total liver score (determined by the sum of the hepatocyte nucleus enlargement score and the liver immunological activity score on day 28) showed a significance between the treatment groups (pGroup = 0.029), with groups PA1 and PA3 differing significantly (p = 0.028) and groups CONMolasses and PA3 showing a trend towards significance (p = 0.063, ).
3.2.2. Hepatic nucleus morphometry and total liver lipid concentration
Comparing the area of hepatocellular nuclei during the trial (), all groups showed an increasing area of hepatocyte nuclei over the course of the experiment (pday <0.001). The area of hepatocyte nuclei tended to increase over time in a dose-dependent manner (pGroupxday = 0.089). The area size of groups PA2 and PA3 was significantly larger on day 28 compared to day 0.
Figure 5. Hepatocyte nucleus area [a] and total liver lipid concentration [b] over the course of the experiment, with day 0 indicating the value before the start of PA exposure.
![Figure 5. Hepatocyte nucleus area [a] and total liver lipid concentration [b] over the course of the experiment, with day 0 indicating the value before the start of PA exposure.](/cms/asset/16356e76-cb7a-4af1-8a0e-24db59c45dfd/gaan_a_2350095_f0005_oc.jpg)
Total lipid concentration of the liver did not show any significant changes over the course of the experiment ().
3.3. Evaluation of further organs
3.3.1. Macroscopic evaluation and organ weights
Macroscopic evaluation of the organs revealed no pathological lesions. Organ weights were calculated relative to body weight and compared between the groups. No significant changes in organ weights were observed between the groups ().
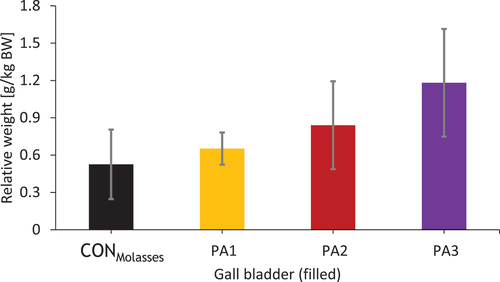
Only the relative weight of the filled gallbladder showed a tendency to differ between the groups (pGroup = 0.062). It increased from the CONMolasses group to the highest exposed group PA3 (), indicating a treatment-related effect.
Figure 6. Relative organ weight of the filled gallbladder after 28 days of PA exposure of the different exposure groups.
3.3.2. Organ histology
On day 28 of the experiment, a low-degree lymphoplasmacytic infiltration of the lamina propria of the gallbladder was found in all animals except one cow in the CONMolasses group (). The lungs remained inconspicuous in cows from group CONMolasses, whereas cows from groups PA1, PA2 and PA3 showed infiltration with neutrophilic and/or eosinophilic granulocytes. In addition, one cow in group PA2 had bronchus-associated lymphoid tissue (BALT) hyperplasia (). No lesions were detected in the spleens (). In the kidneys, all groups showed low-degree multifocal lymphoplasmacytic infiltrates in the interstitium. One cow in group PA2 showed individual detritus-filled tubules, while one cow in group PA3 developed moderate focal atrophy of the parenchyma (). Only the medial and cranial epithelium of the ventral sac of the rumen showed isolated pustules in group CONMolasses, whereas group PA1 showed low and moderate incidence with isolated pustules in the epithelium as well as focal lymphohistiocytic infiltrates with eosinophilic granulocytes in the lamina propria ().
Table 3. Histopathological findings in organs of dairy cows on day 28 concerning immunological activity (+), while a symbol within a category represents an individual animal (n = 4 per group).
4. Discussion
Tansy ragwort has significantly expanded its presence in meadows and pastures over the last 10 years (Berendonk et al. Citation2010). As a result, there is a risk of contamination of preserved feed, especially hay, which may lead to animal exposure. Depending on the specific exposure scenario, a wide range of adverse effects may be observed in the exposed animals.
A study conducted in Belgium revealed that 23 out of 40 horse feed samples tested positive for PA, with concentrations reaching up to 411.4 µg/kg (Huybrechts and Callebaut Citation2015). Further studies by Mulder et al. (Citation2009) examined various feed sources (including silage, grass, hay, and alfalfa) and found that 31 out of 147 samples contained PA, with the highest concentration observed in alfalfa feed (pellets/crumbs) of up to 5,401 µg/kg dry matter (DM). In another study conducted by the European Food Safety Authority (EFSA), 252 measured samples showed an average PA concentration of 290 µg/kg, with maximum levels reaching up to 22,771 µg/kg in the feed category feed and roughage (EFSA Citation2011). Assuming a roughage intake of 13 kg for the cows in the present study, the theoretical contamination of roughage was 24,000 µg/kg for group PA1, 48000 µg/kg for group PA2, and 96,000 µg/kg for group PA3. Notably, the current study reveals that the observed concentration of 22,771 µg/kg in the feed is in the range of group PA1 (24,000 µg/kg), considering the theoretical PA contamination of the feed. These naturally measured contaminations align with the physiologically plausible range of PA doses administered in this experiment.
The liver is the central metabolic organ and plays a crucial role in the metabolism of both nutrients and xenobiotics (Drackley et al. Citation2001). At the same time, the liver is a target organ for the toxic effects of PA and their metabolites. Therefore, PA-related damage to the liver may alter the metabolic function of this organ with possible consequences for nutrient and energy metabolism. Hence, we hypothesised that PA dose-dependent histological changes would be associated with indicators of energy metabolism in cows.
As shown previously, the present exposure scenario gave hints at hepatocellular liver lesions as indicated by increased ALP, GGT, AST and GLDH activities in peripheral blood, while performance parameters including DM, energy intake and energy balance remained unaffected (Knoop et al. Citation2023). Even if energy intake was not adversely affected, the PA-induced hepatotoxic effects, particularly observed in the highest exposed group, could markedly influence energy metabolism. However, neither glucose, NEFA and BHB as short-term metabolic indicators of energy status, lipolysis and ketogenesis, respectively, nor changes in fat depot as a longer-term indicator of lipolysis were affected by increasing PA exposure, suggesting that the functionality of the liver was not compromised despite histopathological and clinical-chemical indications of PA-associated hepatocellular lesions.
Although we observed enlargement of hepatocyte nuclei, we were unable to demonstrate a metabolic disorder with potential loss of function, steatosis, cirrhosis and carcinogenesis as reported in previous studies (Johnson Citation1978; Mattocks et al. Citation1986; Roeder Citation1995; Mulder et al. Citation2016). In the present study, there were no histological indications of hepatocellular lipid accumulation or increase in total liver lipid concentration over the course of the trial. Furthermore, macroscopic evaluation of the liver did not reveal any changes, fatty or fibrotic structures, or signs for hyperbilirubinemia. Activated PA (pyrroles) form DNA and protein adducts. These adducts have an antimitotic effect but don’t inhibit DNA synthesis, resulting in enlarged cells and nuclei, also known as megalocytes (Jago Citation1969; Stegelmeier et al. Citation1999). In the present experiment, these megalocytes were also observed in the liver, with cell morphometry, including the area of hepatocyte nuclei, increasing significantly over time in groups PA2 and PA3. Supporting this morphometric assessment, the hepatocyte nucleus enlargement score confirmed a trend towards enlarged nuclei in the highest exposed group. Enlargement and an increase in the number of vesicular (euchromatic) nuclei in hepatocytes can generally occur as an adaptation to physiological processes or be caused by (sub)toxic influences.
The liver immunological activity score showed no group effects, but it was noteworthy that only the higher exposed groups PA2 and PA3 showed an increase in immune cell infiltrations. Therefore, hepatic neutrophil infiltration, as in one cow in group PA3, may occur in association with degenerative changes in the liver (Altamirano et al. Citation2014; Greuter and Shah Citation2016).
In addition, groups PA2 and PA3 developed pyknosis of hepatocytes, which has been associated with PA toxicity (Mattocks et al. Citation1986). This histological finding could be considered a sign of incipient liver damage.
Macroscopic examination of the organs did not reveal any changes or damage. However, the apparent dose-dependent increase in gallbladder filling strongly suggests an association with PA exposure. Lack of feed intake (24–48 h feed abstinence) also leads to an increased gallbladder filling in cows that lack neuronal or hormonal stimuli causing the gallbladder to contract and thus empty (Housset et al. Citation2016). This can be ruled out in the present study as the animals were able to eat until the end of the experiment and as there is no significant correlation (r = 0.169, p = 0.620, r2 = 0.029) between the last feed intake and the amount of bile. The pronounced filling of the gallbladder in the highest exposed groups may indicate a cholestasis. Cholestasis is characterised by the retention of bile-forming substances due to a disruption in the flow of bile. Intrahepatic cholestasis, caused by various liver injuries, disrupts the ability of hepatocytes to excrete bile (Zollner and Trauner Citation2008). The study by Dickinson et al. (Citation1976) showed an enlarged gallbladder containing higher amounts of bile, which is supported by the findings of the present study. As there were no differences in the weight of the empty gallbladder, biliary wall oedema and/or hyperproliferation could be excluded to explain the differences in the weight of the filled gallbladder. ALP and especially GGT are considered markers of cholestasis (Liu et al. Citation2012; Puppel and Kuczyńska Citation2016), both of which were increased in the PA3 group of the present study (Knoop et al. Citation2023), supporting the assumption of PA-induced cholestasis.
Pathological effects of PA poisoning are mainly seen in the liver and additionally in the lungs. In some cases, the kidneys and the gastrointestinal tract may also be affected (Mattocks et al. Citation1986; Yan and Huxtable Citation1996; Prakash et al. Citation1999). PA metabolites that are not cleared by the biliary route or stored by the liver enter the systemic circulation and may cause extrahepatic damage in addition to hepatotoxic effects (Roeder Citation1995). In the present study, the clinical significance of the histological findings in the lungs remains unclear. Changes in the gallbladder should be considered as part of a physiological process. Pustule formation in the rumen epithelium in groups CONMolasses and PA1 may be caused by irritation of the tissue (e.g. as a result of rumen acidosis). Lymphoplasmacytic infiltrates occur in association with infections, possibly as a result of previous tissue damage or irritation. The signs of acidosis and tissue irritation may be a result of the high carbohydrate content of the used PA extract and the molasses administered daily via gavage, but do not appear to be related to PA exposure. The histological findings in the kidney are unlikely to be related to PA treatment, too. The histological findings in the lungs, gallbladder, rumen and kidneys are probably of little clinical significance due to their low incidence (Baumgärtner et al. Citation2020). Overall, short-term exposure to PA over 28 days at the present concentration and composition of PA did not affect any organs other than the liver. However, a different source of PA or a different duration of exposure might alter the results.
5. Conclusion
The altered histology of the liver, including immune cell infiltration and enlarged hepatocytes and pyknotic cells, may indicate the onset of liver damage. This is supported by PA-induced cholestasis, characterised by increased bile volume with increasing doses of PA in association with increased GGT and ALP levels in peripheral blood.
The effects of PA intoxication are time-dependent. The first significant differences in enlarged hepatocyte cell nuclei were observed only after 28 days in the two highest exposed groups. Therefore, enlarged hepatocyte nuclei should be considered as the most sensitive toxicological endpoint in dairy cows in a PA exposure scenario over a period of 28 days with the administration of a PA extract once daily.
Despite the observed hepatic lesions, metabolic functional liver mass did not appear to be compromised based on the investigated parameters of energy metabolism.
These conclusions apply only to the study conditions used, including the individual PA pattern, exposure time and dose regimen. However, it is possible that prolonged exposure to lower PA doses could have adverse effects, and that incipient liver damage could have an impact on nutrient and energy metabolism. In other words, alterations in dose and dosing regimen, PA pattern and especially exposure time, e.g. by continuous ingestion of contaminated feed, may alter the toxicological outcome. Nevertheless, the PA doses administered here were within the physiologically possible range. Therefore, PA exposure via feed should be kept as low as reasonably achievable in order to avoid intoxication of cows.
PA_KK_ARRIVE Compliance Questionnaire.pdf
Download PDF (226.5 KB)Acknowledgments
Special thanks to the entire laboratory staff of the Institute of Animal Nutrition and the stuff of the Experimental Station Braunschweig of the Friedrich-Loeffler-Institut.
Supplementary material
Supplementary data for this article can be accessed at https://doi.org/10.1080/1745039X.2024.2350095
Disclosure statement
No potential conflict of interest was reported by the author(s).
Additional information
Funding
References
- Altamirano J, Miquel R, Katoonizadeh A, Abraldes JG, Duarte–Rojo A, Louvet A, Augustin S, Mookerjee RP, Michelena J, Smyrk TC, et al. 2014. A histologic scoring system for prognosis of patients with alcoholic hepatitis. Gastroenterology. 146:1231–1239. e1236.
- Baumgärtner W, Gruber AD, Beinecke A, Herden C, Hewicker-Trautwein M, Klopfleisch R, Mundhenk L, Puff C, Schmidt P, Georg R, et al. 2020. Spezielle Pathologie für die Tiermedizin. Georg Thieme Verlag.
- Berendonk C, Cerff D, Hünting K, Wiedenfeld H, Becerra J, Kuschak M. 2010. Pyrrolizidine alkaloid level in senecio jacobaea and senecio erraticus-the effect of plant organ and forage conservation. Grassl Sci Eur. 15:669–671.
- Chamberlin W, Middleton J, Spain J, Johnson G, Ellersieck M, Pithua P. 2013. Subclinical hypocalcemia, plasma biochemical parameters, lipid metabolism, postpartum disease, and fertility in postparturient dairy cows. J Dairy Sci. 96:7001–7013.
- Cheeke P. 1984. Comparitive toxicity and metabolism of pyrrolizidine alkaloids in ruminants and nonruminant herbivores. Can J Anim Sci. 64:201–202.
- Cheeke PR. 1988. Toxicity and metabolism of pyrrolizidine alkaloids. J Anim Sci. 66:2343–2350.
- Cheeke PR, Pierson-Goeger ML. 1983. Toxcicity of senecio jacobea and pyrrolizidine alkaloids in various laboratory animals and avian species. Toxicol Lett. 18:343–349.
- Dickinson JO, Cooke MP, King RR, Mohamed PA. 1976. Milk transfer of pyrrolizidine alkaloids in cattle. J Am Vet Med Assoc. 169:1192–1196.
- Drackley JK, Overton TR, Douglas GN. 2001. Adaptations of glucose and long-chain fatty acid metabolism in liver of dairy cows during the periparturient period. J Dairy Sci. 84:E100–E112.
- EFSA. 2016. European Food Safety Authority; dietary exposure assessment to pyrrolizidine alkaloids in the European population. EFSA J. 14:e04572.
- EFSA Panel on Contaminants in the Food Chain (CONTAM). 2011. Scientific opinion on pyrrolizidine alkaloids in food and feed. EFSA J. 9:2406.
- Fu PP, Xia Q, Lin G, Chou MW. 2004. Pyrrolizidine alkaloids—genotoxicity, metabolism enzymes, metabolic activation, and mechanisms. Drug Metab Rev. 36:1–55.
- Greuter T, Shah VH. 2016. Hepatic sinusoids in liver injury, inflammation, and fibrosis: new pathophysiological insights. J Gastroenterol. 51:511–519.
- Hoogenboom LAP, Mulder PPJ, Zeilmaker MJ, van den Top HJ, Remmelink GJ, Brandon EFA, Klijnstra M, Meijer GAL, Schothorst R, Van Egmond HP. 2011. Carry-over of pyrrolizidine alkaloids from feed to milk in dairy cows. Food Addit Contam. 28:359–372.
- Housset C, Chrétien Y, Debray D, Chignard N. 2016. Functions of the gallbladder. Compr Physiol. 6:1549–1577.
- Huybrechts B, Callebaut A. 2015. Pyrrolizidine alkaloids in food and feed on the Belgian market. Food Addit Contam. 32:1939–1951.
- Jago MV. 1969. The development of the hepatic megalocytosis of chronic pyrrolizidine alkaloid poisoning. Am J Pathol. 56:405.
- Johnson A. 1978. Tolerance of cattle to tansy ragwort (Senecio jacobaea). Am J Vet Res. 39:1542–1544.
- Knoop K, Knappstein K, Kaltner K, Gabler AM, Taenzer J, These A, Kersten S, Meyer U, Frahm J, Kluess J, et al. 2023. Short-term exposure of dairy cows to pyrrolizidine alkaloids from tansy ragwort (Jacobaea vulgaris Gaertn.): effects on health and performance. Arch Anim Nutr. 77:363–384.
- Littell RC, Henry P, Ammerman CB. 1998. Statistical analysis of repeated measures data using SAS procedures. J Anim Sci. 76:1216–1231.
- Liu P, He BX, Yang XL, Hou XL, Han JB, Han YH, Nie P, Deng HF, Du XH. 2012. Bioactivity evaluation of certain hepatic enzymes in blood plasma and milk of Holstein cows. Pak Vet J. 32:601–604.
- Mattocks A, Driver HE, Barbour R, Robins D. 1986. Metabolism and toxicity of synthetic analogues of macrocyclic diester pyrrolizidine alkaloids. Chem Biol Interact. 58:95–108.
- Mulder PPJ, Beumer B, Oosterink JE, De Jong J. 2009. Dutch survey pyrrolizidine alkaloids in animal forage (no. 2009.018). RIKILT.
- Mulder PP, de Witte SL, Stoopen GM, van der Meulen J, van Wikselaar PG, Gruys E, Groot MJ, Hoogenboom RLAP. 2016. Transfer of pyrrolizidine alkaloids from various herbs to eggs and meat in laying hens. Food Addit Contam. 33:1826–1839.
- Prakash AS, Pereira TN, Reilly PE, Seawright AA. 1999. Pyrrolizidine alkaloids in human diet. Mutat Res Genet Toxicol Environ Mutagen. 443:53–67.
- Puppel K, Kuczyńska B. 2016. Metabolic profiles of cow’s blood; a review. J Sci Food Agric. 96:4321–4328.
- Raschka C, Ruda L, Wenning P, von Stemm C-I, Pfarrer C, Huber K, Meyer U, Dänicke S, Rehage J. 2016. In vivo determination of subcutaneous and abdominal adipose tissue depots in German Holstein dairy cattle. J Anim Sci. 94:2821–2834.
- Roeder E. 1995. Medicinal plants in Europe containing pyrrolizidine alkaloids. Pharmazie. 50:83–98.
- Ruan J, Gao H, Li N, Xue J, Chen J, Ke C, Ye Y, Fu PP-C, Zheng J, Wang J, et al. 2015. Blood pyrrole-protein adducts - a biomarker of pyrrolizidine alkaloid-induced liver injury in humans. J Environ Sci Health. 33:404–421. doi: 10.1080/10590501.2015.1096882.
- Starke A, Haudum A, Busche R, Beyerbach M, Dänicke S, Rehage J. 2010. Analysis of total lipid and triacylglycerol content in small liver biopsy samples in cattle. J Anim Sci. 88:2741–2750. doi: 10.2527/jas.2009-2599.
- Stegelmeier BL, Edgar JA, Colegate SM, Gardner DR, Schoch TK, Coulombe RA, Molyneux RJ. 1999. Pyrrolizidine alkaloid plants, metabolism and toxicity. J Nat Toxins. 8:95–116. https://www.ncbi.nlm.nih.gov/pubmed/10091131.
- Taenzer J, Gehling M, Klevenhusen F, Saltzmann J, Dänicke S, These A. 2022. Rumen metabolism of senecio pyrrolizidine alkaloids may explain why cattle tolerate higher doses than monogastric species. J Agric Food Chem. 70:10111–10120. doi: 10.1021/acs.jafc.2c01332.
- van den Top AM, Geelen MJ, Wensing T, Wentink GH, Van’t Klooster AT, Beynen AC. 1996. Higher postpartum hepatic triacylglycerol concentrations in dairy cows with free rather than restricted access to feed during the dry period are associated with lower activities of hepatic glycerolphosphate acyltransferase. J Nutr. 126:76–85. doi: 10.1093/jn/126.1.76.
- Yan CC, Huxtable RJ. 1996. Effects of monocrotaline, a pyrrolizidine alkaloid, on glutathione metabolism in the rat. Biochem Pharmacol. 51:375–379. doi: 10.1016/0006-2952(95)02189-2.
- Zollner G, Trauner M. 2008. Mechanisms of cholestasis. J Clin Liver Dis. 12:1–26. doi: 10.1016/j.cld.2007.11.010.