Abstract
Differences in relative strengths and weaknesses between predators and prey under tactical contexts result in complex and dynamic contests between them. These contests are often brief and difficult to observe in marine systems. Here, we employ basic principles of underwater optics and physics to provide a conceptual understanding of mechanisms underlying predator–prey interactions between white sharks (Carcharodon carcharias) and Cape fur seals (Arctocephalus pusillus pusillus) that have been previously described at Seal Island in False Bay, South Africa.
Published in collaboration with the University of Bergen and the Institute of Marine Research, Norway, and the Marine Biological Laboratory, University of Copenhagen, Denmark
Introduction
Predator–prey interactions are fundamental to the success of both participants and constrained by physical law (Endler Citation1986). Predators and their prey often differ in size, sensory and locomotory capabilities, and relative risks and benefits (Heithaus et al. Citation2009; Martin et al. Citation2009). Scale effects of predator–prey interactions include prey size preference and size-differential survival (Cresswell Citation1994; Brown & Kotler Citation2004). Sensory capability shapes all phases of the predation cycle and can be dependent upon environmental features (Endler Citation1986). For ambush predators, a balance must be struck between the conflicting demands of minimizing strike distance while maintaining crypsis from prey (Malcolm Citation1992). Underwater, the wavelength-selective absorption of daylight requires animals to typically live under low light conditions restricted to a narrow region of the spectrum (Lythgoe & Partridge Citation1989). Significant differences in spectral sensitivities among organisms can impact predator–prey interactions, including the ability of the latter to detect and avoid predators. Locomotor capabilities affect a predator's feeding migration, search, stalk, strike, chase and prey subjugation, as well as a prey's avoidance and escape responses (Webb Citation1986). Factors affecting prey response include sensory capabilities, reaction distance, latency, turning ability and locomotor performance (Batty & Domenici Citation2000). Locomotor performance can be used to predict optimal behaviours that maximize a predator's probability of prey capture and a prey's probability of escape. Locomotor performance includes such parameters as speed, acceleration, fast-start and manoeuvrability (Batty & Domenici Citation2000). Mechanical principles underlying locomotion help identify inequalities, including situations under which optimal behaviours cannot occur (Webb Citation1986).
Generating predictive theories of predator–prey interactions requires an understanding of predator hunting mode, habitat-dependent anti-predator tactics of prey, and the interactions among them (Schmitz Citation2007; Hammerschlag et al. Citation2010). However, the conditions under which predators attack prey and in turn how prey determine their probability of mortality against predator encounter probabilities remain unclear (Heithaus et al. Citation2009).
Predator–prey interactions between white sharks, Carcharodon carcharias (Linnaeus, 1758) and Cape fur seals, Arctocephalus pusillus pusillus (Schreber, 1778) have been reported previously from Seal Island, in False Bay, South Africa (Martin et al. Citation2005, Citation2009; Hammerschag et al. Citation2006; Laroche et al. Citation2008; De Vos & O'Riain 2010; Fallows et al. in press). Briefly, white sharks aggregate seasonally to prey intensively on Cape fur seals at this site. Birth of seals occurs from November through December and pups are weaned in May and June. Predations by sharks on seals peak from May through August, averaging 6.7 per day (n=2546). Seals feed offshore beyond the 25-km wide mouth of False Bay. To benefit from shared subsurface vigilance, seals depart from the island in groups of 5–20 from a small rocky outcrop, termed the Launch Pad (LP), at the southern terminus of the island. Seals spend an average of 2.3 days at sea, foraging separately and thereafter returning to the island solo or in smaller groups of 2–3. The smaller groups likely reflect the difficulty of individual seals to gather in coordinated groups within the mouth of the Bay. The vast majority of predatory strikes occur against small groups of young-of-the-year seals, which are unable to take advantage of shared vigilance and are likely also tired and affected by postprandial torpor, which may further decrease vigilance and render them more vulnerable to attack. Predatory activity is most intense within two hours of sunrise, quickly declining as light penetration in the water column increases.
In the present article, we use basic principles of underwater optics and physics to provide a conceptual understanding of the mechanics underlying aspects of the predatory interactions that have been previously described between sharks and seals at Seal Island.
Conceptual mechanisms underlying shark–seal interactions
White sharks' visual capabilities have not been measured directly, but histological examination of this species’ retina has revealed a rod-to-cone ratio of 4 : 1 and retinal specializations consistent with acute scotopic vision (Gruber & Cohen Citation1985). Cape fur seals are otariids and, like other species in this family, probably have a peak spectral sensitivity at wavelengths of about 500 nm, shifted toward the green, which seems to be expected to be optimal for the shallow coastal waters it inhabits (Renouf 1991; Scholtyssek et al. Citation2008). Experiments on captive individuals revealed that Cape fur seals are able to discriminate difference ratios as small as 1 : 1.19 and possess underwater visual acuity down to 6.6 minutes of arc (Bush & Dücker Citation1987). In comparison, humans with 20/20 vision possess visual acuity at 5 minutes of arc. When moving about Seal Island, seals porpoise at the waters’ surface while scanning for hunting sharks below. Downward irradiance of light attenuates exponentially with depth according to the relation, Id=Ise–kd, where Id=irradiance at depth; Is = irradiance at the surface; k = attenuation coefficient; and d = depth in m. For typical oceanic waters, k is ±0.033 (Jerlov Citation1976). The minimum light level needed for a dark-adapted harp seal, Phoca groenlandica (Erxleben, 1777) to distinguish between light and dark is 1.35 × 10⁻⁹ W/m2 at λ = 475 nm (Lavigne & Ronald Citation1972, Citation1975; Levenson & Shusterman Citation1999; Scholtyssek et al. Citation2008). With this being said, backscattered light is a function of depth and how reflective the objects are. A bright object will have much higher reflectance than a dark object and as such, direct scaling of what a seal can see from the surface is not meaningful without context to the reflectance of the dorsal surface of the shark relative to the general upwelling of backscattered light. Camouflage against downward-searching organisms, simply requires dark pigmentation along the dorsal surface (Lythgoe & Partridge Citation1989), which is the case for sharks, which have a dark grey dorsal surface, which is camouflaged from above against the dark reef substrate around the Island. However, conservatively, in general only about 0.01% as much light is backscattered upward as is transmitted downward from the surface. Thus, if the visual threshold of a Cape fur seal is similar to that of a harp seal, a Cape fur seal looking down from the surface could visually identify a shark at distances of about 4.8 m under sunlit conditions and 0.6 m under moonlit conditions; an intermediate predator-recognition distance of 2.6 m is reasonable under crepuscular conditions. Accordingly, a white shark stalking seals from ±5 m below the waters’ surface will have a visual advantage over seals, as the latter is backlit and silhouetted against the surface in Snell's window defined by Snell's Law (). Snell's Law restricts the horizontal range of vision (r) to roughly the depth at which a shark is swimming; more precisely, r = D tan48.5° (~1.13D), where D is the swimming depth of the shark (). In contrast, down-welling light is dimmed and scattered, rendering the shark's dark back difficult to discriminate against the dark substrate. Indeed, frequency and success rate of white shark predations on Cape fur seals at Seals Island are highest during crepuscular periods. During these low-light conditions, white shark success rate of capture exceeds 55%, but drops below 40% during periods of high light conditions. These capture rates are comparable to those found for predatory mammals (see review by Vermeij 1982).
Figure 1. Summary of optical and topographic parameters in predator–prey contests between white sharks and Cape fur seals. Down-welling light is dimmed and scattered, rendering the shark's dark gray dorsal surface camouflaged against the dark reef substrate. In contrast, sharks stalking seals from below have a visual advantage over seals, as the latter is backlit and silhouetted against the surface in Snell's window, which restricts the horizontal range of vision (r) to the shark's swimming depth (D); whereby, r = D tan48.5° (~1.13D). Most shark attacks on seals occur where bottom depths average 26–30 m such that the shark's horizontal range of surface vision is ~150–170 m.
The maximum burst speed of white sharks at Seal Island is not known. From 1997 to 2010, we video-recorded white sharks in pursuit of seals from which shark speed during predation events could be estimated. We were able to repeatedly calculate in-water burst speeds around 11 m/s. For example, on 25 August 2000, a 3.4-m white shark swimming at 0.5 m/s fled a larger conspecific, moving across the length of our 8-m observation vessel in ±0.8 s. This corresponds to a burst speed of 11.9 m/s. This value is comparable with reported burst speeds of 6 m/s and 7 m/s for white sharks hunting pinnipeds at other sites (Johnson et al. 2009). During initial strike on a Cape fur seal, white sharks breach the waters’ surface (Martin et al. Citation2005). The surface breaking velocity (Vo) of a breaching white shark can provide an estimate of this species’ maximum swimming speed. To record physical attributes of white shark breaches (i.e. height, angle and trajectory), we experimentally elicited 121 strikes by sharks on towed seal-shaped decoys (Martin et al. Citation2005). For example, on 18 June 2002, broadside to our observation vessel, a 3.5-m white shark performed a breach with a height of ≥2.4 m, a water-escape trajectory of ±45°, and duration of ±1.2 s. Following Brunnschweiler (2005), Vo was calculated as follows, Vo=√(2gh/1 – cos2α), where g = acceleration due to gravity (9.81 m/s2); h=height of breach above surface (m); α = angle between water escape vector and horizon. This produces a Vo estimate of 9.70 m/s, corresponding to a burst speed at the moment of reaching the surface of 35 km/h. This is 1.54 times faster than Vo calculated for breaching blacktip sharks, Carcharhinus limbatus (Valenciennes, 1839) (Brunnschweiler Citation2005). Most shark attacks on seals at Seal Island took place where bottom depths were 26–30 m. If a shark undertook a vertical attack on a seal at the surface from a depth of 28 m, the shark would intercept the seal in 2.15 s. If a white shark undertook a 45-degree attack on a seal at the surface from the same depth, basic trigonometry indicates that the shark would traverse 39.6 m to intercept the seal in 2.57 s. If, as calculated above, a Cape fur seal's ability to identify a white shark approaching from below is limited to a radius of 2.6 m under crepuscular conditions as previously calculated, then the reaction time available to the seal is ±0.1 s for both a vertical and a 45-degree attack. Using a classical equation for uniformly accelerated motion (Giancoli Citation1980), V′2=Vo 2+2a▵x, the calculated minimum run distance a white shark needs to reach top speed, such as when launching an initial attack on prey, is 3.76 m. This figure plus the estimated recognition distance of Cape fur seals (3.76 m + 2.6 m = 6.36 m) predicts a white shark should launch an attack below a minimum depth of 7 m in order to remain undetected while stalking seals from below, with enough vertical distance to build up momentum required for launching a vertical strike at the surface. At Seal Island, sharks patrol the waters at average depths of 12–14 m; however, attacks occur over a depth range of ~7–31 m, with significantly higher frequency of attacks occurring over depths of 26–30 m.
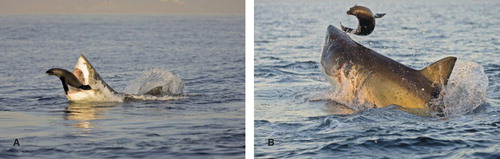
Data on turning radius and duration have not been published for either white sharks or Cape fur seals. White sharks are clearly capable of impressive burst speeds during vertical breaches; however, it is unknown how long they can sustain top swimming speed. White muscle comprises between 94 and 97% of a white shark's muscle mass (Bernal et al. 2001), which is capable of rapid contraction but has low stamina (Bone 1988). Allometric scaling analysis of white shark caudal fins suggests that this species may be better suited to slower swimming and turning manoeuvres (Sfakiotakis et al. 1999; Lingham-Soliar et al. 2005). Frame counts of laterally filmed 180-degree direction changes in a surface-charging white shark and porpoising Cape fur seals suggest that 1.1-m long Cape fur seals can reverse direction in about the same time interval as a 3.5-m long white shark but in only 10–35% the distance (unpublished data). Thus, during secondary pursuit of a Cape fur seal by a white shark, superior agility should favour the former (). Based on 290 recorded predatory events, Martin et al. (2005) demonstrated that attacks by sharks on seals ranged in duration from <1 min to 27 min, although nearly two-thirds lasted ≤2 min. Furthermore, they found a strong inverse relationship between attack duration and success rate as well as between number of vertical breaches and success rate. This is because after an initial non-fatal shark strike, seals employ evasive manoeuvres, often leaping toward the shark's back (away from its jaws) when the shark is at the surface ().
Figure 2. If a seal is not killed or disabled in the initial strike by an attacking shark, the seal has tactical advantages in terms of reduced turning radius. In both (A) and (B), a highly manoeuvrable seal evades an attacking shark during its secondary pursuit. Image Courtesy C. Fallows/www.apexpredators.com
Predation at Seal Island appears to be significantly affected by factors that influence a shark's ability to encounter, ambush and subjugate Cape fur seals and the seal's ability to detect, avoid, outmanoeuvre, and injure its predator. These results are consistent with recent work by Schmitz (2007, 2008) and Heithaus et al. (2009), suggesting that the ability to predict predator–prey interactions requires an understanding of predator hunting mode, anti-predator behaviour, habitat features, and interactions among these factors.
Editorial responsibility: Haakon Hop
Acknowledgements
For their assistance in and out of the field, we thank C. Fallows, M. Fallows, and R. Lawrence. Special thanks also to A. E. Martin, who prepared the line figures. Thanks to D. Letson, D. Wartzok, A. Mass, C. M. Hammerschlag, T. Kellison, A. J. Gallagher, F. Uiblein and the anonymous reviewers whose constructive comments helped significantly improve our paper.
Additional information
Notes on contributors
R. Aidan Martin
deceasedNotes
Published in collaboration with the University of Bergen and the Institute of Marine Research, Norway, and the Marine Biological Laboratory, University of Copenhagen, Denmark
References
- Batty RS , Domenici P . 2000 . Predator–Prey Relationships in Fish and Other Aquatic Vertebrates: Kinematics and Behaviour . Oxford : BIOS Scientific Publishers Ltd. 2000 pages .
- Bernal , D , Dickson , KA , Shadwick , RE and Graham , JB. 2001 . Review: analysis of the evolutionary convergence for high performance swimming in lamnid sharks and tunas . Comparative Biochemistry and Physiology - Part A: Molecular & Integrative Physiology , 129 : 695 – 726 .
- Bone , Q. 1988 . “ Muscles and locomotion ” . In Physiology of Elasmobranch Fishes , Edited by: Shuttleworth , TJ . Berlin : Springer-Verlag, p 99–141 .
- Brown , JS and Kotler , BP. 2004 . Hazardous duty pay and the foraging cost of predation . Ecology Letters , 7 : 999 – 1014 .
- Brunnschweiler , JM. 2005 . Water-escape velocities in jumping blacktip sharks . Journal of the Royal Society Interface , 2 : 389 – 91 .
- Bush , H and Dücker , G. 1987 . Das visuelle leistungsvermogen der seebären (Arctocephalus pusillus and Arctocephalus australis) . Zoologischer Anzeiger , 219 : 197 – 224 .
- Cresswell , W. 1994 . Age-dependent choice of redshank (Tringa totanus) feeding location: Profitability or risk? . Journal of Animal Ecology , 63 : 589 – 600 .
- De Vos , A and O'Riain , MJ. 2010 . Sharks shape the geometry of a selfish seal herd: Experimental evidence from seal decoys . Biology Letters , 6 : 48 – 50 .
- Endler , JA. 1986 . “ Defence against predators ” . In Predator–Prey Relationships: Perspectives and Approaches from the Study of Lower Vertebrates , Edited by: Feder , ME and Lauder , GV . Chicago, IL : University of Chicago Press, p 109-34 .
- Fallows C , Martin RA , Hammerschlag N . In press . Comparisons between white shark-pinniped interactions at Seal Island (South Africa) with other sites in California (United States) . In : Domeier ML Global Perspectives on the Biology and Life History of the Great White Shark . Boca Raton, FL : CRC Press .
- Giancoli , DC. 1980 . Physics , Englewood Cliffs, NJ : Prentice Hall, Inc. 482 pages .
- Gruber , SH and Cohen , JL. 1985 . Visual system of the white shark, Carcharodon carcharias, with emphasis on retinal structure . Memories of Southern California Academic Sciences , 9 : 61 – 72 .
- Hammerschlag , N , Heithaus , MR and Serafy , JE. 2010 . Influence of predation risk and food availability on nocturnal fish foraging distributions . Marine Ecology Progress Series , 414 : 223 – 25 .
- Hammerschlag , N , Martin , RA and Fallows , C. 2006 . Effects of environmental conditions on predator–prey interactions between white sharks (Carcharodon carcharias) and Cape fur seals (Arctocephalus pusillus pusillus) at Seal Island, South Africa . Environmental Biology of Fishes , 76 : 341 – 50 .
- Heithaus , MR , Wirsing , AJ , Burkholder , D , Thomson , J and Dill , LM. 2009 . Towards a predictive framework for predator risk effects: The interaction of landscape features and prey escape tactics . Journal of Animal Ecology , 78 : 556 – 62 .
- Jerlov , NG. 1976 . Marine Optics , Elsevier, Amsterdam. 231 pages .
- Johnson , R , Bester , MN , Dudley , SFJ , Oosthuizen , WH , Meÿer , MA , Hancke , S and Gennari , E. 2009 . Coastal swimming patterns of white sharks (Carcharodon carcharias) at Mossel Bay, South Africa . Environmental Biology of Fishes , 85 ( 3 ) : 189 – 200 .
- Lavigne , DM and Ronald , K. 1972 . The harp seal, Pagopbilus groenlandicus (Erxleben 1777). XXIII. Spectral sensitivity . Canadian Journal of Zoology , 50 : 1197 – 206 .
- Lavigne , DM and Ronald , K. 1975 . Pinniped visual pigments . Comparative Biochemistry and Physiology Part B , 52 : 325 – 29 .
- Laroche , K , Kock , A , Dill , LM and Oosthuizen , WH. 2008 . Running the gauntlet: A predator–prey game between sharks and two age classes of seals . Animal Behavior , 76 : 1901 – 17 .
- Levenson , DH and Shusterman , RJ. 1999 . Dart adaptation and visual sensitivity in shallow and deep diving pinnipeds . Marine Mammal Science , 15 : 1303 – 13 .
- Lingham-Soliar , T. 2005 . Dorsal fin in the white shark Carcharodon carcharias: a dynamic stabilizer for fast swimming . Journal of Morphology , 263 : 1 – 11 .
- Lythgoe , N and Partridge , JC. 1989 . Visual pigments and the acquisition of visual information . Journal of Experimental Biology , 146 : 1 – 20 .
- Malcolm , SB. 1992 . “ Prey defence and predator foraging ” . In Natural Enemies: The Population Biology of Predators, Parasites and Diseases , Edited by: Crawley , MJ . 458 – 75 . Oxford : Blackwell Scientific Publications .
- Martin , RA , Hammerschlag , N , Collier , RS and Fallows , C. 2005 . Predatory behaviour of white sharks (Carcharodon carcharias) at Seal Island, South Africa . Journal of the Marine Biological Association of the United Kingdom , 85 : 1121 – 35 .
- Martin , RA , Rossmo , DK and Hammerschlag , N. 2009 . Geographic profiling and hunting patterns of white sharks . Journal of Zoology , 279 : 111 – 18 .
- Renouf , D. 1991 . The Behaviour of Pinnipeds , 348 – 56 . London : Chapman and Hall Ltd .
- Schmitz , OJ. 2007 . Predator diversity and trophic interactions . Ecology , 88 : 2415 – 26 .
- Schmitz , OJ. 2008 . Effects of predator hunting mode on grassland ecosystem function . Science , 319 : 952 – 54 .
- Scholtyssek , C , Kelber , A and Dehnhardt , G. 2008 . Brightness discrimination in the harbor seal (Phoca vitulina) . Vision Research , 48 : 96 – 103 .
- Vermeij , GV. 1982 . Unsuccessful predation and evolution . American Naturalist , 120 : 701 – 20 .
- Webb , PW. 1986 . Effect of body form and response threshold on the vulnerability of four species of teleost prey attacked by largemouth bass (Micropterus salmoides) . Canadian Journal of Fisheries and Aquatic Sciences , 43 : 763 – 71 .