Figure 7 in A. S. De A. Ferreira et al.'s Vertical migration of Norwegian spring-spawning herring larvae in relation to predator and prey distribution, Marine Biology Research, 8(7), 605–614, 2012
A. S. DE A. FERREIRA1,2*, ERLING KÅ RE STENEVIK1, KNUT WIIK VOLLSET2, ROLF KORNELIUSSEN1 & ARILD FOLKVORD2
1 Institute of Marine Research, Bergen, Norway, and 2 University of Bergen, Bergen, Norway
The editor would like to state that was printed in black and white and not in colour as referred to in the caption.
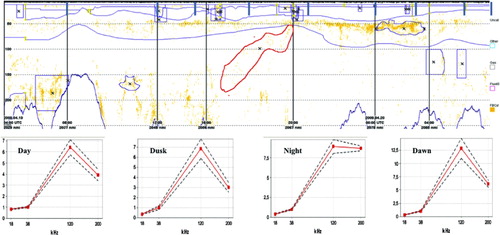
Figure 7. Echogram (a) recorded in April 2009 on board of RV ‘Johan Hjort’. The x axis shows time and the y axis shows depth. Vertical blue markers in the top of the echogram show location of start and stop of different type of stations (MOCNESS, trawl, CTD, etc.). The dark grey fields, usually due to multiple backscatter from the bottom at 18 kHz, were data manually removed. Locations where LSSS had identified krill (randomly oriented fluid bent cylinder) are identified in orange. The krill locations are used to mask the acoustic values at all available frequencies (18, 38, 120 and 200 kHz), so that only krill is retained and all other acoustic categories are removed. The relative frequency response plots indicate standard error curves of frequency response for day (08, 12, 15, and 18 h on 19 April, and 09 h on 20 April), dusk (21 h), night (00 and 03 h), and dawn (06 h).