Abstract
The rivers that drain into the Hardangerfjord were historically known to have numerous populations of both sea trout (Salmo trutta) and Atlantic salmon (Salmo salar). After a decline in catches during the last decades many of the rivers have been closed for fishing. In this study we use snorkelling observations from rivers and catch statistics from 2004 to 2011 to describe the current situation and analyse the patterns of density of wild salmon, sea trout and escaped farmed salmon in the Hardangerfjord rivers. We hypothesize that some of the variance in density of salmon and sea trout can be explained by the location of the river in the fjord, with fish from rivers with a longer fjord exposure having a lower density. A median number of 3.5 salmon×ha−1 and 14.9 sea trout×ha−1 were observed in the rivers. Farmed salmon were observed in all rivers and constituted on average 23.3% of the total number of observed salmon. For salmon, there was an inverse log-linear relationship between density in the river and migration distance to coast, with a higher density in rivers with a shorter migration distance. For sea trout there was no evident relationship with location within the fjord. We suggest that the spatial patterns observed for salmon and sea trout can be related to the species-specific differences in habitat use within the fjord system.
Introduction
Atlantic salmon (Salmo salar Linnaeus, 1758, hereafter salmon) and anadromous brown trout (Salmo trutta Linnaeus, 1758, hereafter sea trout) use a wide variety of habitats due to their complex life cycle. Spawning generally occurs on gravel beds in rivers and streams (Jonsson & Jonsson Citation2011), juveniles live in the river for 2–5 years and smolt migrate to the sea when the size is approximately 12–15 cm. While sea trout prefer coastal waters as feeding grounds, salmon migrate long distances in the northern part of the Atlantic Ocean (Thorstad et al Citation2011b). Both species return as adults to their native stream to spawn (Jonsson & Jonsson Citation2006; Thorstad et al. 2011b). Consequently, the species are vulnerable to a series of anthropogenic stressors and many populations have declined or have become extinct in the last century (Parrish et al. Citation1998). Aas et al. (Citation2011) considered river regulation and pollution as the most relevant threats to salmon and sea trout in freshwater, while overfishing and aquaculture related effects are considered to be highly relevant for sea survival (Heuch et al. Citation2001; Costello Citation2006; Skaala et al. Citation2006).
Vøllestad et al. (Citation2009) examined two data sets on catches of salmon from Scottish and Norwegian rivers and concluded that in addition to temporal trends in catches in the different regions, there was also an indication of a strong local-scale effect (i.e. correlations in patterns for adjacent rivers). While it is vital to understand large-scale regional patterns because they may reflect climate and ecosystem changes, local-scale patterns are important because they reflect the scale on which human encroachments are most relevant (L'Abee-Lund et al. Citation2006). In Norway, most rivers are located within complex fjord systems. Several studies have suggested that there is high mortality during the period of fjord migration due to various physical and biological challenges related to entering the marine environment (Hvidsten & Lund Citation1988; Thorstad et al. Citation2011a). Otero et al. (Citation2011) demonstrated that the trends in catches in 60 Norwegian rivers over 29 years could be explained by a combination of temperature in the coastal water during the smolt run, the presence of hydropower stations in the river and the presence of salmon farms on the migration route of smolts. As noted by Vøllestad et al. (Citation2009), adverse effects during the fjord migration should be more pronounced where complex seaward migration is required. This suggests that salmon populations in the inner parts of fjords with a longer fjord migration route are more affected by impacts during the fjord phase. In contrast, sea trout are known to stay within the fjord system during their marine phase and to move between fresh and salt water according to the prevailing environmental conditions (Jonsson & Jonsson Citation2006). Consequently, we would expect sea trout populations to be more affected by local-scale conditions in the fjord. However, up to now such patterns have not been analysed, as there is a lack of sufficient quantitative data on salmon and sea trout populations that is non-biased by differences in catch reporting.
In the present study, we present the results from an eight-year period (2004–2011) with annual counting by snorkelers of sea trout, salmon and escaped farmed salmon in a total of 18 rivers in the Hardangerfjord, one of the longest fjords in the world sustaining wild populations of salmon and sea trout. During the last two decades many populations of salmon and sea trout in the Hardanger region have been severely reduced, raising conservation concerns for the persistence of wild salmonids in the fjord system (Skaala et al. Citation2014). It has been suggested that population declines may have been caused by increased fjord-related mortality, possibly related to the expansion of the fish-farming industry in the region. The main goal of this work is therefore to relate the spawning populations of salmon and sea trout to the distance the smolt has to swim from each river to reach open ocean, while factoring in potential effects in the watershed (river regulation, glacial effects and physical alteration). We explicitly test the hypothesis that the variance in salmon and sea trout density can be related to the location of the rivers within the fjord.
Material and methods
Study area
This study is based on data from 18 rivers draining into the Hardangerfjord, on the west coast of Norway (). All 18 rivers originate in alpine regions and descend down a steep gradient to a slower-running and anadromous lower part. The size of the anadromous area varies from 1.8 ha (0.9 km length, River Øysteseelva) to 28.9 ha (12.2 km length, River Etneelva). In contrast to many European rivers, the watersheds are not dominated by agricultural (<10%) or urban land use (<3%), but rather by forest, alpine tundra and bedrock (mainly granites and gneisses). The water quality is considered to be well within tolerance limits for both salmon and sea trout. Even though the habitat conditions vary, all rivers can be considered as functioning reproduction areas for salmon and sea trout (Skoglund et al. Citation2008). Nine of the 18 rivers have been regulated for hydropower use. The main regulation effects are caused by changes in water discharge (hydropower plants in side-channels or bypass tubes) leading to reduced water discharge, reduced wetted area and an altered temperature regime. Glaciers are present in 9 of the 18 watersheds, indicating lower summer water temperatures, higher altitude of the drainage area and larger water discharge during summer. Physical alterations (such as bank stabilization and channelization) are found to a varying degree in all rivers (). Due to declining populations, salmon fishing has been closed in many of the rivers since the early 1990s.
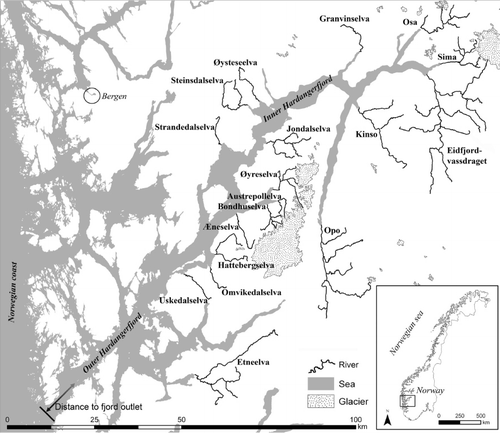
Table I. Categorization of rivers in the Hardangerfjord. Shortened code is abbreviation of name used in graph. Area is the area of river polygons from digital maps using ArcGis©. Length is distance from anadromous obstacle to river outlet following a transect in the middle of the river. Distance is distance from river outlet to outlet of the Hardangerfjord (Bømlafjord). Glacier is presence of glacier in the catchment. Physical is a categorization of the human physical alteration of the river. Regulation is the presence of river regulation in the river. Discharge is the categorization of whether the discharge has been severely reduced.
Snorkelling observations
The drift snorkelling observations were conducted similar to those described earlier by Orell et al. (Citation2011 and references therein), who conducted their studies in similar-sized rivers. In short, the snorkelling teams consist of divers equipped with a dry suit, diving mask, snorkel and neoprene gloves. The snorkelers drift in parallel and make frequent stops to discuss the observations. One team leader notes the exact position of the observations on a waterproof map. In order to avoid double-counting, the count only includes fish that pass the observer in the upstream direction or fish that are holding their position and thereby passed by the diver. Standardization among rivers is obtained by only using trained personnel for snorkelling and by adjusting the numbers of divers to the size and width of the river, i.e. varying from one to three divers in each team. Low discharge and good underwater visibility (>3 m) are required in order to make consistent and unbiased observations. Upon encounter, the fish is visually identified to species and size-class based on morphological characteristics. Likewise, escaped farmed salmon are identified and separated from wild salmon by morphological criteria, i.e. body proportion, fin erosion and pigmentation. Consequently, the proportion of farmed salmon is a minimum estimate.
Snorkelling in Hardanger was conducted annually from 2004 to 2011 during low discharge periods from mid-September to mid-November. This period was chosen to encounter the spawning population, as both sea trout and salmon spawn in autumn (Jonsson & Jonsson Citation2011). In addition, this represents the time after recreational fishing. Within this period, the date varied between rivers and years according to changing ambient conditions. In some of the larger and more complex river systems (e.g. Etne, Eidfjord and Granvin) there is a higher probability of underestimation due the larger amounts of potential hiding place. However, this method is considered to be suitable for the rivers in the Hardangerfjord, as they are relatively small and have low turbidity during low water discharge (Orell et al. Citation2011).
Data analysis
Spawner abundance (i.e. post-fisheries abundance) was defined as the number of wild fish counted. For each river, the anadromous river area was estimated by calculating the area of river polygons from digital maps using ArcGis© (1 : 50,000). Pre-fisheries abundance was defined as spawner abundance plus official river-specific catch statistics registered by the County Governor of Hordaland. However, the catch statistics in these rivers may be underreported and misleading. For example, in many cases farmed salmon and wild salmon are not differentiated. This could cause a bias in the density estimates. To test the effect of variable catch statistics, all analyses were performed on spawner density and contrasted with models using the pre-fisheries density. Significant terms from the two model runs indicate similar results (see below for model details). The relative density of farmed fish was estimated as the number of farmed fish observed divided by the total number of fish observed. However, this may be an underestimation because farmed fish may be difficult to identify based solely on morphological characters. Fishing intensity was estimated by dividing the numbers from the catch statistics by pre-fisheries abundance.
A linear mixed-effect model with the river as a random effect was used to study the spatial and temporal pattern of density of salmon and sea trout. There is considerable debate about which rivers contain self-reproducing populations of salmon, and to make a simple selection, we removed all rivers less than 2 km from the analysis. All rivers were included in the analysis of sea trout. In order to standardize the data among rivers, the observations were calculated to denote number of spawners observed per hectare (i.e. spawner density). Distance from river to fjord outlet was used as a continuous predictor variable. The distance was measured from a line in the middle of the fjord from each river outlet to the fjord outlet (). The between-year variability could not be approximated by a linear pattern and year was thus treated as a factor. An interaction between year and distance from river outlet to fjord outlet was tested to assess the potential variation in slope among years. River regulation was defined as presence of hydropower regulation in the river catchment. However, because not all regulations alter the water discharge, a new variable defining whether the water discharge had been severely reduced following regulation was used in the model. Physical alteration was defined on the basis of a discretionary categorization of the rivers on the basis of technical reports describing the rivers (LFI, report series 1970–2012, http://www.miljo.uni.no/?page_id =56&lang=en). No differences were seen between ‘medium’ and ‘low’ physical alteration and were pooled as ‘medium’ alteration. However, it was not straightforward to define independent explanatory variables. For example, water discharge reduction due to regulation is correlated both with physical alteration and the presence of glacier in the water shed. This needs to be considered when interpreting the statistical results.
The nlme library in R v2.14.1© (R Core Team Citation2012) was used to fit the model. The full model is given by:
Results
Spawner densities
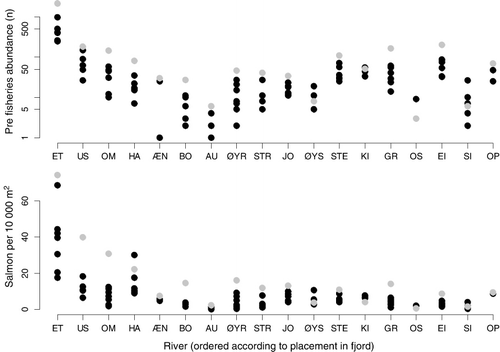
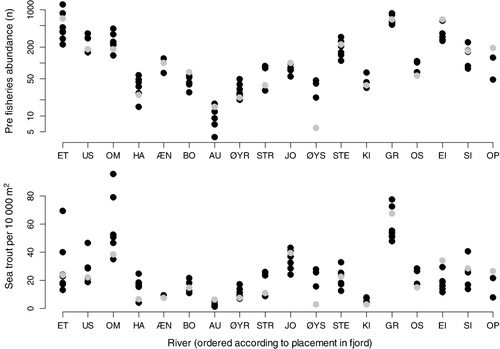
The median number of fish was 3.5 ha−1 (range=0–74.1) and 14.9 ha−1 (range=1.1–93.6) for salmon and sea trout, respectively (). River Etneelva was the river with by far the highest density of salmon both in numbers and density, while the Rivers Granvin and Omvikedal had the highest densities of sea trout ().
Spatial and temporal analysis
The AIC criterion suggested that river should be kept as a random effect for both models of sea trout and salmon. For salmon, there were significantly more fish in rivers with a shorter migration distance to the fjord outlet (LME, F11,1=6.05, p<0.05), and a significant effect of year (LME, F61,7=13.42, p<0.05) (). There were no evident interaction effects among years, and no effects of discharge, physical alteration or presence of glacier. In this model, however, the river Etneelva was a strong outlier. When the model was re-run without Etneelva, the migration distance to the fjord outlet was still significant (Distance : LME, F10,1=15.39, p<0.05; Year : LME, F54,7=8.09, p<0.05) (, ). When removing the random effect of river, both physical alteration and discharge were retained in the final model and had a negative effect on fish density.
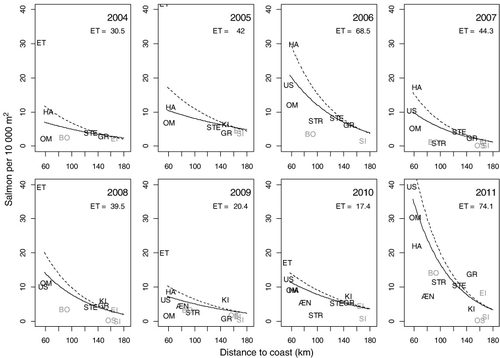
Table II. Results of the linear mixed-effects model of density of fish (DF) without river Etne. River is defined as a random effect. The standard deviation (s.d.) of the random effect and the residual SD was 0.49 and 0.38, respectively; numDF and denDF represent the numerator and denominator degrees of freedom in the test of the respective factors.
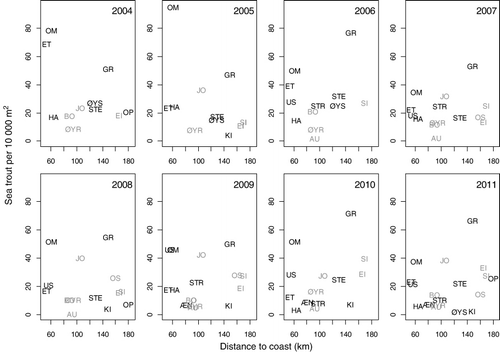
For sea trout, neither year, distance from river to fjord outlet, discharge, physical alteration nor presence of glacier explained the variance (). Consequently, the only term left in the model was the random effect of rivers, suggesting that the pattern in each river was river-specific. When removing the random effect of river, discharge was retained in the model.
Fishing intensity
In the two rivers where fishing intensity could be estimated, the percentage of salmon caught by anglers ranged from 37.6% to 71.6% in the river Uskedalen and 51.6 to 79.8% in the river Etne.
Presence of farmed fish
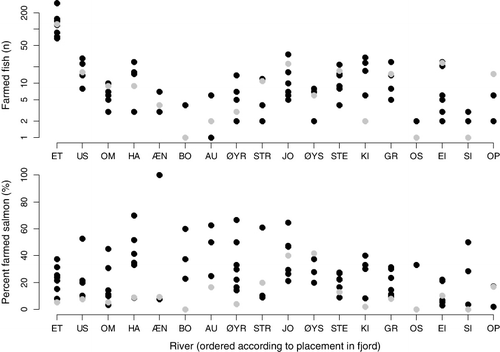
Escaped farmed salmon were observed in all rivers, with the highest number in the river Etneelva for all years. A total of 1064 escaped farmed salmon were identified in the river Etneelva, while 759 escaped farmed salmon were identified in all other rivers pooled. Farmed salmon accounted for 23.3% of the total number of observed salmon (median=21.2%, ). In rivers with highest spawner densities, the among-year variability of farmed salmon ranged from 7.6% to 52.8% in the River Uskedalen and 5.4–37.5% in the River Etne.
Discussion
Our results suggest that there is an inverse log-linear relationship between the density of salmon each year in the period 2004–2011 and the migration distances from river to open sea. In addition, there was a clear yearly variation in density, most likely reflecting differences in open ocean marine survival among year-classes. This is in contrast to sea trout, where no such patterns in distance or year were observed.
Spawner densities in the Hardangerfjord
To our knowledge, there are no data that can conclusively assess the historical density of salmon and sea trout in the various populations in the Hardangerfjord. According to our data, the River Etneelva and in later years the River Uskedalen (which has been limed since 2002) were the only rivers sustaining viable fisheries during the period of observation. However, historically most of the larger river systems in the inner fjord also sustained a viable fishery of salmon and sea trout. In addition, there was an extensive marine fishery for salmon throughout the fjord, which is now banned (Skaala et al. Citation2014). Catch statistics are available for some of the inner rivers, but most of these data are, with few exceptions, of poor quality due to inadequate reporting (Jensen et al. Citation2004). It is therefore difficult to analyse whether the populations in the inner parts of the fjord have had a divergent trend in population size compared to the outer fjord systems. Catches have been estimated for some rivers. For example, in the Eidfjord river system the estimated total catches in the period 1968–1979 (Jensen et al. Citation2004) was on average 10 times larger for salmon and 5 times larger for sea trout than the average observed number of fish in the snorkelling data presented here. Declining catches during the 1990s resulted in protection of salmon in most rivers, which is currently still being enforced. Thus, it seems evident that the populations in the inner fjord system have been severely reduced during the last decades, suggesting that the current populations are at a historically low level.
Salmon
There are several potential mechanisms that can explain the observed spatial pattern of increased density of salmon with decreasing length to fjord outlet. Our a priori hypothesis was that salmon smolt originating from rivers in the inner part of the fjord would have a longer residence time in the fjord and consequently have a higher cumulative fjord-related mortality. This suggests that there is a strong fjord-related mortality during the years of observations. Several studies have recently suggested that the presence of fish farming has caused a decrease in density of wild fish (e.g. Krkošek et al. Citation2007). One of the mechanisms that couples increased mortality in wild salmon populations with fish farming is the increased spread and production of the salmon louse, the parasitic copepod (Lepeophtheirus salmonis), which can infect and kill salmon smolt during migration (Jackson et al. Citation2011; Gargan et al. Citation2012). The Hardangerfjord is one of the fjords with the highest density of salmon farms in the world (Skaala et al. Citation2014). In 2010 the total production of salmon was over 900,000 t. Jansen et al. (Citation2012) demonstrated that there was correlation between sea lice on individual salmon farms and local biomass density in the surrounding farms. Severe infections of salmon lice on wild salmonids in the Hardangerfjord coincide with high infection rates at salmon farms (Bjørn et al. Citation2011). While coordinated delousing (with a limit of >0.3 lice or 0.1 female lice per salmon) during the smolt run in spring have been implemented, the national sea louse monitoring programme has concluded that the action taken by the farming industry has been swamped by the increase in production during the same period (Torrisen et al. 2013). Given that smolt migrate from the rivers at approximate similar times, smolt with a longer migration distance will stay longer in the fjord and be in the outer fjord later in the season. As salmon louse physiological rates are affected strongly by temperature (Boxaspen & Naess Citation2000), there is an increased risk of infection later in the season, when the higher temperature during late spring and summer will increase the production of lice. Heuch et al. (Citation2009) demonstrated that higher salinity in the outer fjord areas correlates with a higher sea louse infection at salmon farms in the Hardangerfjord. However, as noted by Heuch & Mo (Citation2001) and further corroborated by Brooks (Citation2005), local prevailing oceanographic conditions are important to the area-specific interaction between sea lice and salmon smolt, and it is not certain that similar spatial patterns will emerge in the other fjord systems. We strongly recommend that regional analysis of spawner density should be conducted in other similar areas, and especially in areas with lower concentrations of fish farms.
There are alternative mechanisms that also can explain an increased density of salmon with decreasing length to fjord outlet. One possible explanation is that the habitat characteristics of rivers in the inner fjord generally are different from those in the outer fjord, for example due to higher altitude and glacier-affected watersheds or river regulation and physical alteration. However, controlling for this pattern in the model did not alter the fjord-related pattern. Inner fjord rivers like Kinso and Granvin have relatively low physical alteration and little reduced water discharge following regulation. Consequently, factors other than habitat differences most likely explain the consistently low density of salmon relative to the available river area.
One pivotal question that arises from our study is whether the emerging pattern reflects a natural situation or is a consequence of anthropogenic influence. A possibility is that the low recruitment to the salmon populations in recent years is due to poor marine ocean survival (Peyronnet et al. Citation2008). However, the salmon from the river Etneelva, which most likely use the same foraging grounds as the salmon from the other study rivers, have had strong year-classes when fish survival was low in the other rivers. This suggests that ocean survival alone cannot explain the fjord-related pattern in survival. However, the observed pattern is likely to be maintained or reinforced, since rivers with a low density of fish have a reduced smolt production caused by a limited spawning population size. The limited increase in inner fjord spawning populations in the peak year 2011 compared to the outer rivers may partly reflect such a reduced smolt output during previous years. This suggests there is a limited short-term potential for capitalizing from a year with favourable conditions for sea survival.
Sea trout
In contrast to salmon, the density of sea trout was not correlated to river position along the fjord. The only part of the model that was retained was a random effect of rivers, suggesting that the among-river variance was larger than the within-river variance. In general, sea trout populations in the Hardangerfjord have declined and are now probably at an all-time low (Skoglund et al. Citation2008). In contrast to salmon, sea trout has declined more or less over the fjord system. Granvinselva is an exception, with relatively high density of sea trout. However, compared to historical catch statistics from Granvinselva (1969–1990: avg. >2300, max. 7845), the river has sustained a much larger population than it does now.
There seemed to be a pattern of very low concentrations of sea trout per hectare of available river area in the rivers situated in the middle part of the Hardangerfjord (Hatterbergelva, Æneselva, Bondhuselva, Austrepollelva and Øyreselva). These rivers are located in the area of the Hardangerfjord with the highest density of fish farms. However, Omvikedalselva, situated close to Hattebergelva, had one of the highest densities of sea trout per hectare of available river area. This illustrates the complexity of interpreting such data. Sea trout are most likely to be affected by prevailing local conditions, because their habitat use is restricted to the river and the fjord (Jonsson & Jonsson Citation2011). It has been suggested that most sea trout keep relatively close to their river of origin during the marine phase, even though some individuals migrate large distances and even forage offshore, similar to adult salmon (Malcolm et al. Citation2010). In addition, sea trout have a plastic and complex life-history strategy compared to salmon, which can make the sea trout more robust to variable conditions (Jonsson & Jonsson Citation2006). For example, the spawning populations can consist of a larger numbers of year-classes (>10), and the marine residence time varies according to the prevailing conditions in the sea (Jonsson & Jonsson Citation2006).
Fishing intensity
The amount of fish caught by anglers varied among years and among rivers. In a large proportion of the rivers, fishing was closed during the period of analysis. During years when fishing was open, the proportion of the salmon run caught by anglers ranged from 37.6% to 71.6% in the River Uskedalselva and from 51.6% to 79.8% in the River Etne. Thus, fishing has the potential to severely reduce the spawning populations, suggesting that restricting fishing is an important management tool to ensure viable spawning populations. Also, these results suggest that the sole use of catch statistics to evaluate population situations can be severely biased by variation in catch efficiency. The use of additional observations such as snorkelling observations is thus pivotal for appropriate management of endangered populations.
Presence of farmed salmon
Escaped farmed salmon were observed in all rivers. There seemed to be a pattern of more farmed fish in the larger rivers which also sustained more wild fish (i.e. Etneelva). This is reflected in the proportion of farmed fish being relatively similar among rivers. However, a detailed analysis of the spatial distribution of farmed fish is out of the scope of this article. Such an analysis requires more detailed data on the distribution of farming production and escape numbers.
Physical alteration and river regulation
Neither physical alteration nor the discharge alteration due to water regulation had a significant effect on the density of fish. This is in contrast to studies that have shown that salmonids can be strongly affected by these factors (Aas et al. 2010; Johnson et al. Citation2011; Jonsson & Jonsson Citation2011). This discrepancy could either reflect the true situation for our sites and years, or be explained by a suboptimal model design. The responses to the influence of regulation are most likely strongly river-specific, and defining categorical variables are not straightforward. Both discharge alteration and physical alteration were statistically significant when removing the random effect of river, with lower densities in rivers with strong physical alterations and severely reduced discharge. However, the power of this analysis is low because it inflates the degrees of freedom. A larger data set including data on spawning, juvenile density and local habitat characteristics is warranted for a robust analysis of these effects on a river-to-river scale.
Concluding remarks
This study has demonstrated that there is a pattern in the density of salmon related to the location of the rivers in the Hardangerfjord, while no such pattern was evident for sea trout. We suggest that these contrasting spatial patterns can be related to species-specific differences in habitat use within the fjord system.
Editorial responsibility: Franz Uiblein
Acknowledgements
Thanks to Arne Johannesen and Eirik Straume Normann for assistance during field work. Thanks also to Gaute Velle for proof-reading the final manuscript. This work was mainly funded by the NFR project Epigraph, by grants from the Norwegian Directorate for Nature Management, the research project CEDREN and partially by the hydro power company Statkraft. The authors would also like to acknowledge the work done by the editor and two anonymous referees in the process of improving and publishing the article.
References
- Aas Ø, Policansky D, Einum S, Skurdal J. 2011. Salmon ecological research and conservation. Chapter 17 in: Aas Ø, Einum S, Klemetsen A, Skurdal J, editors. Atlantic Salmon Ecology. Oxford: Blackwell Publishing, p 445–54.
- Bjørn PA, Nilsen R, Serra Llinares RM, Asplin L, Boxaspen K, Finstad B, et al. 2011. Sluttrapport til Mattilsynet over lakselusinfeksjonen på vill laksefisk langs norskekysten i 2011. Rapport fra Havforskningen 19(2011). Bergen: Institute of Marine Research. 33 pages.
- Boxaspen K, Naess T. 2000. Development of eggs and the planktonic stages of salmon lice (Lepeophtheirus salmonis) at low temperatures. Contributions to Zoology 69:51–55.
- Brooks KM. 2005. The effects of water temperature, salinity, and currents on the survival and distribution of the infective copepodid stage of sea lice (Lepeophtheirus salmonis) originating on Atlantic salmon farms in the Broughton Archipelago of British Columbia, Canada. Reviews in Fisheries Science 13:177–204. 10.1080/10641260500207109
- Costello MJ. 2006. Ecology of sea lice parasitic on farmed and wild fish. Trends in Parasitology 22:475–83. 10.1016/j.pt.2006.08.006
- Gargan PG, Forde G, Hazon N, Russell DJF, Todd CD. 2012. Evidence for sea lice-induced marine mortality of Atlantic salmon (Salmo salar) in western Ireland from experimental releases of ranched smolts treated with emamectin benzoate. Canadian Journal of Fisheries and Aquatic Sciences 69:343–53. 10.1139/f2011-155
- Heuch PA, Mo TA. 2001. A model of salmon louse production in Norway: Effects of increasing salmon production and public management measures. Diseases of Aquatic Organisms 45:145–52. 10.3354/dao045145
- Heuch PA, Olsen RS, Malkenes R, Revie CW, Gettinby G, Baillie M, et al. 2009. Temporal and spatial variations in lice numbers on salmon farms in the Hardanger fjord 2004–06. Journal of Fish Diseases 32:89–100. 10.1111/j.1365-2761.2008.01002.x
- Hvidsten NA, Lund RA. 1988. Predation on hatchery-reared and wild smolts of atlantic salmon, Salmo salar L, in the estuary of river Orkla, Norway. Journal of Fish Biology 33:121–26. 10.1111/j.1095-8649.1988.tb05453.x
- Jackson D, Cotter D, O'Maoiléidigh N, O'Donohoe P, White J, Kane F, et al. 2011. An evaluation of the impact of early infestation with the salmon louse Lepeophtheirus salmonis on the subsequent survival of outwardly migrating Atlantic salmon, Salmo salar L., smolts. Aquaculture 320:159–63. 10.1016/j.aquaculture.2011.03.029
- Jansen PA, Kristoffersen AB, Viljugrein H, Jimenez D, Aldrin M, Stien A. 2012. Sea lice as a density-dependent constraint to salmonid farming. Proceedings of the Royal Society 279:2330–38. 10.1098/rspb.2012.0084
- Jensen AJ, Johnsen BO, Berger HM, Lamberg A. 2004. Fiskebiologiske undersøkelser i Eidfjordvassdraget, Hordaland fylke 2003. Trodnheim: NINA. 35 pages.
- Johnson BO, Arnekleiv JA, Asplin L, Barlaup BT, Næsje TF, Rosseland BO, et al. 2011. Hydropower development - ecological effects. Chapter 14 in: Aas Ø, Einum S, Klemetsen A, Skurdal J, editors. Atlantic Salmon Ecology. Oxford: Blackwell Publishing, p 352–86.
- Jonsson B, Jonsson N. 2006. Life history of the anadromous trout Salmo trutta. Section 2 in: Harris G, Milner N, editors. Sea Trout – Biology, Conservation and Management. Oxford: Blackwell Publishing, p 196–223.
- Jonsson B, Jonsson N. 2011. Ecology of Atlantic Salmon and Brown Trout – Habitat as a Template for Life Histories. New York: Springer. 708 pages.
- Krkošek M, Ford JS, Morton A, Lele S, Myers RA, Lewis MA. 2007. Declining wild salmon populations in relation to parasites from farm salmon. Science 318:1772–75. 10.1126/science.1148744
- L'Abee-Lund JH, Haugen TO, Vøllestad LA. 2006. Disentangling local from macroenvironmental effects: Quantifying the effect of human encroachments based on historical river catches of anadromous salmonids. Canadian Journal of Fisheries and Aquatic Sciences 63:2318–29. 10.1139/f06-123
- Malcolm IA, Godfrey J, Youngson AF. 2010. Review of migratory routes and behavior of Atlantic salmon, sea trout and European eel in Scotland's coastal environment: Implications for the development of marine renewables. Scottish Marine and Freshwater Science 1(14). 72 pages.
- Orell P, Erkinaro J, Karppinen P. 2011. Accuracy of snorkelling counts in assessing spawning stock of Atlantic salmon, Salmo salar, verified by radio-tagging and underwater video monitoring. Fisheries Management and Ecology 18:392–99. 10.1111/j.1365-2400.2011.00794.x
- Otero J, Jensen AJ, L'Abée-Lund JH, Stenseth NC, Storvik GO, Vollestad LA. 2011. Quantifying the ocean, freshwater and human effects on year-to-year variability of one-sea-winter Atlantic salmon angled in multiple Norwegian rivers. PLoS ONE 6(8): e24005. 11 pages. 10.1371/journal.pone.0024005
- Parrish DL, Behnke RJ, Gephard SR, McCormick SD, Reeves GH. 1998. Why aren't there more Atlantic salmon (Salmo salar)? Canadian Journal of Fisheries and Aquatic Sciences 55:281–87. 10.1139/d98-012
- Peyronnet A, Friedland KD, O'Maoiléidigh N. 2008. Different ocean and climate factors control the marine survival of wild and hatchery Atlantic salmon (Salmo salar) in the north-east Atlantic Ocean. Journal of Fish Biology 73:945–62. 10.1111/j.1095-8649.2008.01984.x
- R Core Team (2012). R: A Language and Environment for Statistical Computing. Vienna: R Foundation for Statistical Computing. http://www.R-project.org/. Computer program.
- Skaala Ø, Wennevik V, Glover KA. 2006. Evidence of temporal genetic change in wild Atlantic salmon populations affected by farm escapees. ICES Journal of Marine Science 63:1224–33. 10.1016/j.icesjms.2006.04.005
- Skaala Ø, Johnson GH, Lo H, Borgstrøm R, Wennevik V, Hansen MM, … 2014. A conservation plan for Atlantic salmon (Salmo salar) and anadromous brown trout (S. trutta) in the Hardangerfjord, a region with intensive industrial use of aquatic habitats. Marine Biology Research 10:308–322.
- Skoglund H, Barlaup BT, Lehmann GB, Wiers T, Garbrielsen S-E, Sandven OR. 2008. Gytefisktellinger i 18 vassdrag i Hardangerfjordsystemet 2004–2007 – bestandsstatus for villfisk og innslag av rømt oppdrettslaks. Bergen: UNI Research, Laboratorium for ferskvannsøkologi og innlandsfiske. 62 pages.
- Thorstad EB, Uglem I, Arechavala-Lopez P, Økland F, Finstad B. 2011a. Low survival of hatchery-released Atlantic salmon smolts during initial river and fjord migration. Boreal Environment Research 16:115–20.
- Thorstad EB, Whoriskey F, Rikardsen AH, Aarestrup K. 2011b. Aquatic nomad: The life and migrations of the Atlantic salmon. Chapter 1 in: Aas Ø, Einum S, Klemetsen A, Skurdal J, editors. Atlantic Salmon Ecology. Oxford: Blackwell Publishing, p 445–54.
- Torrissen O, Jones S, Asche F, Guttormsen A, Skilbrei OT, Nilsen F, et al. 2013. Salmon lice - Impact on wild salmonids and salmon aquaculture. Journal of Fish Diseases 36:171–94.
- Vøllestad LA, Hirst D, L'Abée-Lund JH, Armstrong JD, MacLean JC, Youngsen AF, et al. 2009. Divergent trends in anadromous salmonid populations in Norwegian and Scottish rivers. Proceedings of the Royal Society B 276:1021–27. 10.1098/rspb.2008.1600

