
Abstract
Information about the distribution, composition and status of the benthic environment and communities is important for the implementation of ecosystem-based management involving assessment of the effects of human activities. The MAREANO programme (Marine Areal Database for Norwegian Coasts and Sea Areas) conducts seabed mapping in order to fill knowledge gaps in relation to the implementation of management plans for the Norwegian EEZ. This paper describes the experience from the mapping strategy used by MAREANO. By using a variety of sampling gears the benthic environment and communities from all types of seabed are thoroughly documented. This involves the mapping of bottom topography, seabed substratum, pollutants, species composition, biomass and habitat forming vulnerable biota in a varied marine landscape. The area mapped from 2006 to 2013 is 131,000 km2, spans depths ranging from 40 to 2700 m and covers a variety of topographic features including canyons, cold seeps and coral reefs. The information gained by this broad mapping approach has offered a unique insight into the diversity of benthic species and habitats. Through interpretation and classification of the information gained MAREANO scientists produce a database and detailed maps of seabed surficial geology, marine landscapes, biotopes and particularly sensitive and threatened habitats. Indicators of human impact, such as pollutants, trawl marks and marine litter are also presented on maps. Experience from 8 years of detailed mapping shows the necessity of thorough mapping for informed management decision-making.
Introduction
Mapping for management raises several questions, e.g. (1) What are the relevant methods and scale for documentation of environment and fauna on all bottom-types? (2) How should representative sampling and observation sites be selected in a varied seascape?
The MAREANO programme (Marine Areal Database for Norwegian Coasts and Sea Areas) conducts seabed mapping, upon request from the Norwegian government, in order to fill knowledge gaps in relation to the implementation of management plans for the different parts of the Norwegian EEZ. The programme was launched in 2005 to support the implementation of ‘The Integrated Management Plan for the Marine Environment of the Barents Sea and the Sea Areas off the Lofoten Islands’ (BSMP) (Anonymous Citation2006). MAREANO is jointly financed by the Ministry for the Environment and the Ministry of Trade, Industry and Fisheries. The goal is to obtain information that can be used as a scientific basis for the regulation of human activities such as the petroleum industry and fisheries. Information about benthic habitats and biological communities is important in implementing ecosystem-based management of the sea and in assessing the consequences of human activities (Buhl-Mortensen et al. Citation2012a; Steltzenmüller et al. Citation2013). By using a variety of complementary sampling gears to ensure that a broad set of benthic organisms on all types of seabed are represented, MAREANO offers a unique insight into the diversity, biomass and production of benthic communities within various biotopes.
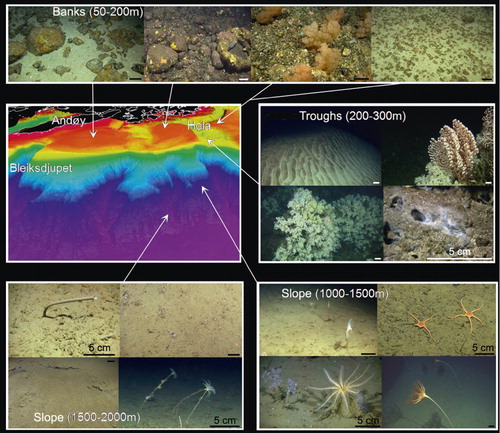
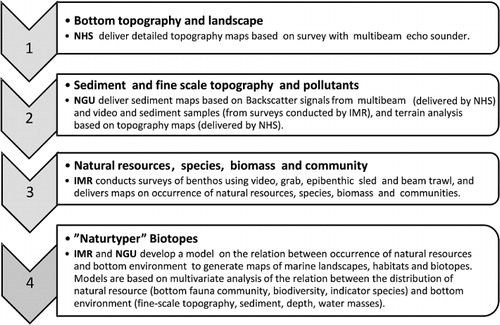
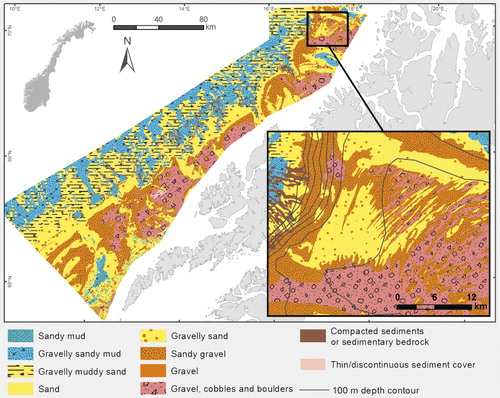
The area mapped by MAREANO in 2006–2013 (131,000 km2) spans depths ranging from 40 to 2700 m and covers a wide variety of topographic features including banks, troughs, ridges, canyons, large sand waves, cold seeps and coral reef areas (). To map bottom topography, seabed substratum, pollutants, biodiversity and vulnerable biota in a varied seascape is challenging and requires a range of mapping methods. Baseline mapping of topography and sediment type relies heavily on acoustic remote sensing. Multibeam echosounder data (bathymetry and acoustic backscatter) provide information on terrain and softness of substratum. Sampling of sediment and benthos is performed with a suite of gears (multicorer, grab, boxcorer, beam-trawl and epibenthic-sledge) and includes visual inspection with video. The three national institutes, Institute of Marine Research (IMR), Geological Survey of Norway (NGU) and Norwegian Hydrographic Service (NHS) work in cooperation to fulfil the various mapping tasks ().
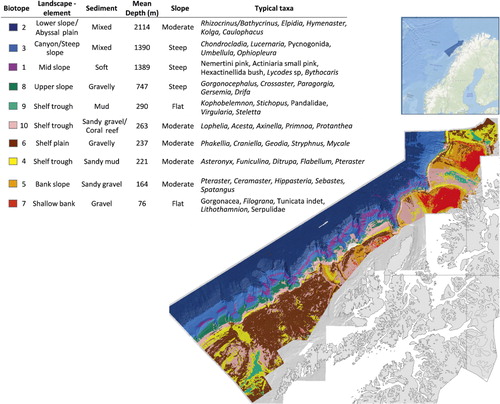
Through interpretation and classification of the acquired data, MAREANO scientists produce maps that provide detailed information of the seabed, geology, biology and marine landscapes. Analysis of the biological data provides information about biodiversity, biomass, distribution of selected species and communities. Further statistical analysis of the relationships between benthic communities and the physical environment allows the identification of distinct benthic biotopes and habitats (Buhl-Mortensen et al. Citation2009), including several vulnerable habitats, which can then be mapped using predictive modelling techniques (Elvenes et al. Citation2014).
The new knowledge gained from MAREANO contributed substantially to the revision of the BSMP in 2010/2011 (Anonymous Citation2011) and MAREANO results have also been used in development of the new strategy for management of human activities such as fishing, oil and gas exploitation, and shipping. MAREANO since 2012 has also been mapping in the Norwegian Sea to provide scientific information needed in relation to the management plan for this area.
All MAREANO maps and data are freely available for public use through the MAREANO website. This paper will describe the methods developed and used in the MAREANO mapping programme so far. We will also show how some of the results from mapping have been of particular use for marine management.
Management goals for mapping
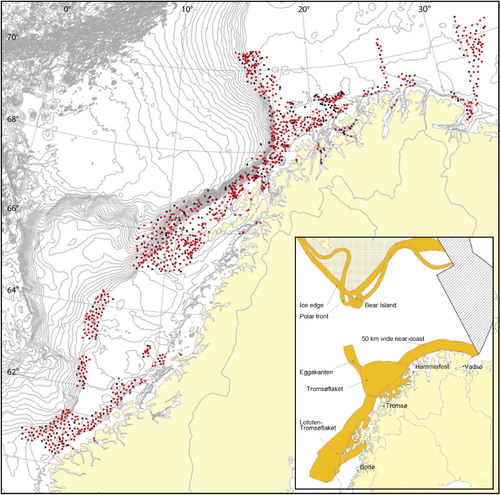
MAREANO was launched in 2005 to cover knowledge gaps defined in the Barents Sea Management Plan presented by the Norwegian Government in 2006 (Anonymous Citation2006). The purpose of the management plan for the Barents Sea is to provide a framework for sustainable use of ecosystem goods and services while at the same time maintaining the structure, function and productivity of the ecosystem (Buhl-Mortensen et al. Citation2012a). The management plan was revised in 2010/2011 (Anonymous Citation2011) and results from MAREANO contributed substantially to the revision and to the new strategy for management of human activities such as fishing, oil and gas exploitation and shipping (Buhl-Mortensen et al. Citation2012a). Prioritized mapping areas were located along the shelf break, on the continental shelf and in areas close to the Russian border in the east (). These areas are regarded as being especially valuable, ecologically important and vulnerable. Since 2010, MAREANO has also been mapping in the Norwegian Sea further to the south to support the implementation of the management plan for the Norwegian Sea (Anonymous Citation2009).
The request from the government is that the MAREANO programme shall:
Map and conduct basic studies of the physical, biological and chemical environment of the seabed and systematize the information in an area database for Norwegian coast and sea areas.
Provide better knowledge about bottom conditions and increased knowledge of ecologically important bottom communities such as coral reefs and sponges.
Contribute to systematic evaluation of which marine biotopes in the Barents Sea should have the status of threatened and/or vulnerable.
For EU member states the Marine Strategy Framework Directive (MSFD) specifies management goals for European seas (Anonymous Citation2008). Particularly relevant to mapping of marine bottom environment and communities are biological diversity and seafloor integrity (descriptors 1 and 6). The goal for descriptor 1 is that biological diversity is maintained, i.e. the quality and occurrence of habitats and the distribution and abundance of species are in line with prevailing physiographic, geographic and climatic conditions. This is to be addressed at four ecological levels: ecosystem, landscape, habitat/community and species. Good environmental status (GES) is achieved if there is no further loss of the diversity of genes, species or habitats/communities at ecologically relevant scales or when deteriorated components are restored to ‘target levels’. The goal for descriptor 6 is that ‘Seafloor integrity is at a level that ensures that the structure and functions of the ecosystems are safeguarded and benthic ecosystems, in particular, are not adversely affected’. The GES for this descriptor relates to sustainable ecosystem use and is achieved when ‘Diversity and productivity are maintained and the uses do not cause serious adverse impacts to the natural ecosystem structure and functioning in both space and time, and recovery should be rapid and secure if a use ceases’.
Clearly these national and international management goals depend on detailed knowledge about the benthic environment and ecosystem, including the state of health and signs of human impact. It does not focus on any particular fauna group or size class of the benthic community, but on function and health of the benthic ecosystem. It is also well known that terms like habitat, biodiversity and ecosystem are concepts that depend upon the sampling methods. Different methods will provide different definitions of the terms (Costello Citation2009; Buhl-Mortensen et al. Citation2012b). With this in mind, the mapping conducted by MAREANO was designed to cover all parts and scales of the benthic community equally well, including diversity and productivity, and with no organism group having specific priority. The results from MAREANO will be useful for the process of specifying GES descriptors and selecting indicators.
Methodology and results
Planning cruises for geology and biology mapping
The density of survey sites is 10 video stations and two ‘full-stations’ per 1000 km2. At ‘full stations’ both video recording and bottom sampling are carried out. Conducting all activities at one single full station at depths >1000 m takes in general ∼24 h, which is three to four times longer than for stations shallower than 300 m. By the end of 2013, a total of 18 sampling cruises were completed, equalling 360 days at sea. Each cruise covers between 5000–10,000 km2 depending on depth. The greater the depth the more time-consuming it becomes to map and a smaller area is covered per cruise.
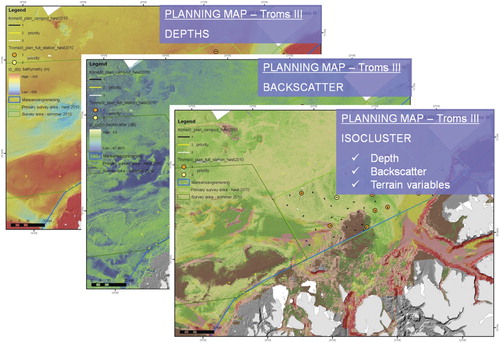
Mapping in an area starts with an initial multibeam survey conducted by the Norwegian Hydrographic Service, which provides bathymetric maps and backscatter information (). The information is used to provide high-resolution bathymetry maps. In addition, this information is vital for the planning of the subsequent sampling surveys that acquire geological and biological information in the same area. The decision on where to position video and sampling stations to document as many habitat types as possible is based on a combined stratified and random sampling strategy. A few stations also specifically targeted features of special scientific interest.
Survey planning makes full use of multibeam bathymetry and backscatter data and video stations are positioned to cover:
Topographic variation and gradients between major geomorphic features (e.g. banks, troughs and canyon walls).
Variation in sediment type (indicated by multibeam backscatter).
Achieve good geographic coverage.
Document features of special scientific interest.
Video registration and sampling
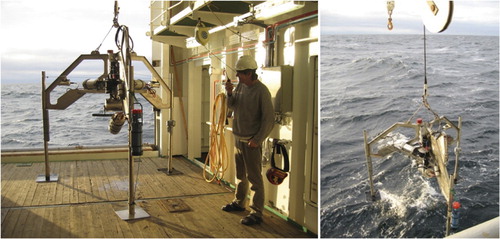
The seabed is inspected with the video platform CAMPOD. This platform is a tripod equipped with a high-definition colour video camera (Sony HDC-X300) tilted forward at an angle of 45°. It also has a standard-definition video camera for navigation purposes, lights (2 × 400W HMI), depth sensor, CTD, current meter, turbidity sensor and altimeter (). The videos are recorded on hard-drives on board the vessel. The video transects were 1000 m long when MAREANO started mapping in 2006. After analysing cumulative taxon curves for these videos it was found that 700 m was sufficient for comparing the fauna composition between sites and for documenting the diversity of megafauna (animals >5 cm). At the beginning of each transect, the video platform stands still on the seafloor recording an overview and zooming in on details within an area of approximately 6 m2. After inspection at the starting point, the video platform ‘CAMPOD’ is towed behind the survey vessel at a speed of 0.7 knots and controlled by a winch operator providing a near-constant altitude of 1.5 m above the seabed. To provide the best view the video is towed uphill over steep terrain. At the end of the video transect the video platform is parked on the seabed and the area is inspected in the same way as at the starting point. Geopositioning for the video data is provided by a hydroacoustic positioning system (Simrad HIPAP and Eiva Navipac software) with a transponder mounted on ‘CAMPOD’, giving a position accurate to 2% of water depth. Navigational data (date, UTC time, positions and depth) were recorded automatically at 10-second intervals using the software CampodLogger (version 2.0.39) developed at IMR.
This software is also used for real-time annotation of seabed observations (occurrence of taxa, bottom types, signs of fishing impact, occurrence of litter and local geological seabed features) during video recording. It allows for selecting generic bottom types from a drop-down menu, entering taxon names and comments manually. These entries are automatically ‘tagged’ with: date, time, depth (both from the ship's echosounder and the video platform's depth sensor), altitude (above seabed), latitude and longitude (both from the ship and the video platform).
In the laboratory, a detailed analysis of the video is undertaken and all organisms are identified to the lowest possible taxon and counted, or quantified as% seabed coverage following the method described by Mortensen & Buhl-Mortensen (Citation2005). This is facilitated by using software (Video Navigator, version 1.0.0.15; IMR), which is used for more quantitative post-cruise analysis of video records. The biological and substrate entries are ‘tagged’ with: date, time, depth, altitude, latitude and longitude, similar to the real-time logging software. This is facilitated by synchronizing the videoplayer with a time-coded navigational file.
Abundance data (the number of organisms counted, divided by the area observed) were standardized as number of individuals per 100 m2 (Buhl-Mortensen et al. Citation2009; Dolan et al. Citation2009).
At sampling stations a van Veen grab (0.25 m2) is used for documentation of infauna. Epifauna were sampled by beam trawl (mesh size 5 mm, 2 m opening width, 5 min hauls; see Bergman et al. Citation2009 for gear description). Hyperfauna were sampled with an RP-sled (mesh size 0.5 mm, 1 m opening width, 10 min hauls; see Buhl-Jensen Citation1986 for a description). The sampled organisms were identified to species level in the lab, counted and weighed for biomass registration (Buhl-Mortensen et al. Citation2012c).
Geological mapping in MAREANO
Geological mapping makes full use of multibeam bathymetry and backscatter data, which are typically available to at least 5 m resolution on the shelf. Data are interpreted with respect to surficial bottom sediments following methods described by Bellec et al. (Citation2009) to produce maps of sediment grain size, sedimentary environment (erosion and deposition areas) and sediment formation. In making their interpretation the geologists use video and other supporting data to classify backscatter decibel values in backscatter mosaics, and to interpret sediment variation with respect to topography. This expert-driven process allows the geological processes occurring in a study area to be interpreted and consolidated in map form at the appropriate level of detail for the 1:100,000 maps produced by MAREANO (). Recent mapping in parts of the Norwegian Sea has also been conducted without the use of 100% multibeam data coverage. The limitations of this approach for sediment interpretation are discussed by Elvenes et al. (Citation2014), but it seems the approach is viable, at least in areas where sediment cover is more homogeneous. Broad-scale geomorphic features are also identified by MAREANO and represented as landscape maps. These maps are based on terrain analysis of bathymetry data as detailed by Elvenes et al. (Citation2014) and are in accordance with landscape level classification under the Norwegian Nature Type classification system (Halvorsen et al. Citation2009)
In addition to their utility as a delimiter for geomorphic feature types, bathymetry-derived terrain variables, e.g. slope, curvature etc. (see summaries by Wilson et al. Citation2007; Dolan et al. Citation2012), may also serve as proxies for more direct effects that influence the distribution of benthic fauna. These influences operate across many spatial scales, and it can therefore be valuable to derive proxy terrain variables at different scales in order to promote the chance of finding the most relevant variables for use in biotope distribution modelling.
Classification and modelling of habitats/biotopes
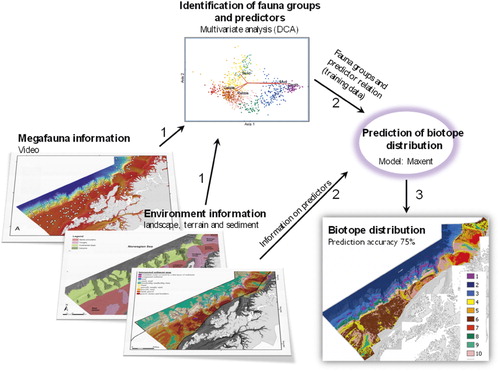
To produce full coverage maps of the distribution of habitats and biotopes, as required by management, predictive modelling techniques are used. These models use information on the characteristics and distribution of biological communities (based on visual documentation) and combine it with physical characteristics of the seabed identified by terrain analysis and geological interpretation. MAREANO has refined the methods used for spatial prediction of biotopes over the years since the first map for Tromsøflaket was produced in 2008, testing various methods for classification and modelling. Currently, prediction of biotope distribution is performed using maximum entropy distribution modelling – Maxent (Phillips et al. Citation2004), while modelling of vulnerable habitats has employed methods based on Random Forests (Breiman Citation2001). The workflow for biotope modelling is summarized in (see also Buhl-Mortensen et al. Citation2009; Dolan et al. Citation2009; Elvenes et al. Citation2014). Detrended correspondence analysis (DCA) is used to identify groups of samples (video sequences of 100–200 m length) with high similarity of fauna composition and clustering of these points allows the classification of biotopes. By re-plotting these samples in geographic space using GIS we are able to see the geographic distribution of biotope-classified sample points. Moreover, this step allows extraction of physical characteristics for each sample (biotope) point from the full coverage quantitative terrain variables described above, as well as sediment classes and landscape type. Together these provide a large number of physical seabed descriptors that can potentially serve as predictor variables that allow the model to predict from point observations to a full coverage map. To avoid using predictors that are strongly inter-correlated, or indicators for the same forcing factors, and to avoid overfitting of the models, we use forward selection with Monte Carlo permutation using CANOCO for Windows 4.52 (ter Braak & Smilauer Citation2002) to select the most suitable (continuous) predictor variables from all those available, while internal routines in Maxent are used to assess the importance of categorical variables.
Results that have been particularly useful for management
Until recently, visual inspection of benthic communities was very costly and almost non-existent from below scuba diving depths. The definition of marine biotopes and their distribution was mainly based on sampling ‘blindfolded’ and inspecting organisms taken out of their natural habitat. Our knowledge of the extent, geographic range and ecological functioning of benthic habitats is still extremely poor, and it is estimated that only 5–10% of the seafloor is mapped with a resolution of similar studies on land (Wright & Heyman Citation2008).
The new results from the MAREANO mapping include detailed distribution of biotopes and particularly sensitive and threatened habitats in areas that are closed to the petroleum industry while new information is gained on natural resources (, ). This new information has been crucial for the revision of the Barents Sea management plan in 2010/11 and the decision to maintain the closure of this area.
The new visual information that is quickly accumulating through MAREANO has been used to define new habitat and biotope entities for the varied marine areas off northern Norway. This information has also been used by OSPAR in the development of more relevant threatened and endangered habitat categories and to identify their health status.
To date MAREANO has conducted multi-scale terrain analysis in connection with all biotope mapping and modelling. These terrain variables (continuous variables), together with sediment and landscape classifications (categorical variables), serve as effective predictor variables for predictive modelling of biotopes from point observations to produce a full coverage map required by management.
In the model the different biotopes are characterized by composition of megafauna species documented by video, substrata, depths, landscapes and terrain characteristics. The total species diversity of the identified biotopes is described by the content of the bottom samples (Buhl-Mortensen et al. Citation2012b).
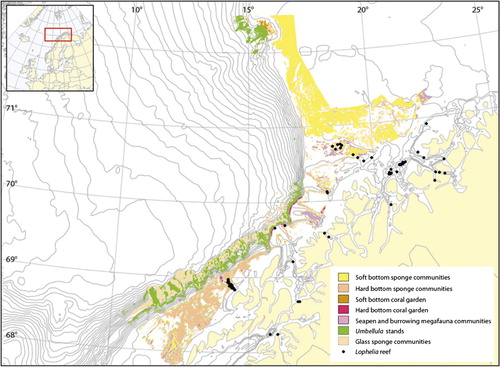
Several of the biotopes are characterized by species typical for habitats defined by OSPAR as threatened and/or declining (OSPAR Commission Citation2008). The classification of seabed locations based on multivariate analyses has provided further details about the taxonomic composition of ‘OSPAR habitats’ and suggests the division of certain habitats/biotopes, such as deep-sea sponge aggregations and coral gardens (Buhl-Mortensen et al. Citation2013b). The new habitat classes separate the coral gardens and the sponge aggregations into soft and hard bottoms, and define the glass-sponge dominated sponge communities in deep and cold water as a separate class. These vulnerable biotopes are more relevant for the management since they represent different environments with different industries and pressures. Predictive modelling of vulnerable habitats is presently under development, but maps are already presented on the MAREANO website (see ). The occurrence of vulnerable biotopes has been used by the Norwegian Environment Agency to assess environmental value together with other valuable, vulnerable or threatened biological resources (fish, mammals and birds).
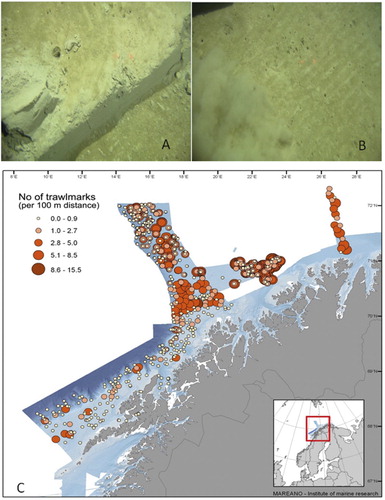
In addition, the video recording has provided detailed information on physical impact from fisheries on the bottom substratum (). This has highlighted the need for protection of specific vulnerable areas but also the importance of upgrading sea maps with information on these habitats, e.g. the position of coral reefs. The availability of the compiled information for the public and politicians on the MAREANO website has been a success, judging from the large number of visitors from many user groups and the questions from users related to content. On the other hand the process from cruise planning to biotope maps takes several years and this is not always easy to communicate.
The huge amount of information from video inspections and samples collected by MAREANO has been used in several national and international projects. In the national project for development of a Norwegian Nature Type classification system (NiN), input on marine biotopes identified by MAREANO has been important (Halvorsen et al. Citation2009). As a Barents Sea case study in the EU project MESMA (Buhl-Mortensen et al. Citation2012a), effects of new knowledge gained from MAREANO on marine spatial management were tested using a framework for the monitoring and evaluation of spatially managed areas developed by MESMA (Steltzenmüller et al. Citation2013). Results from this test highlighted the importance of detailed baseline mapping and relevant indicators for informed management decisions, findings that have inspired the development of marine management plans in Norway. Information on the distribution of vulnerable habitats and signs of fisheries impact has provided valuable input to a report on fisheries effects on benthos (Buhl-Mortensen et al. Citation2013a), and to the EU project BENTHIS (Benthic Ecosystem Fisheries Impact Study). Furthermore, input from MAREANO has been provided for the development of MSFD indicators in the EU project STAGES having the specific aims to improve the scientific knowledge base to support the implementation of the MSFD.
Conclusions
MAREANO has made use of interpretation and modelling in map production. Whilst these approaches help integrate video/sample and full coverage data, the models will only ever be as good as the input data and knowledge that contribute to them. The major part of the species diversity of our oceans consists of benthic organisms and at present, our knowledge of the benthic marine ecosystem is still at a state where species diversity and categories for defining habitat and biotope are lacking in many areas. This means it is often not possible to identify areas that are unique, vulnerable or biologically rich. When no information exists on what the natural healthy benthos composition is, it is not possible to discriminate effects of human-induced pressures from natural variation. Furthermore, it is difficult to develop indicators that are useful for monitoring health status. Thus, a thorough mapping of the benthic environment and community is needed, and should involve a comprehensive sampling approach to ensure that the composition of the various communities is properly documented.
The MAREANO mapping strategy has proved that the production of new information is highly relevant for the future of ecosystem-based management of marine resources.
Funding
The MAREANO programme is supported by the Norwegian Ministry for the Environment and the Ministry of Trade, Industry and Fisheries.
Editorial responsibility: Dan Smale
Additional information
Funding
Related Research Data
References
- Anonymous. 2006. St.meld. nr. 8 (2005–2006). Helhetlig forvaltning av det marine miljø i Barentshavet og havområdene utenfor Lofoten (Barents Sea Management Plan). Oslo: Ministry of Environment. 141 pages. ( in Norwegian)
- Anonymous. 2008. European Council. Directive 2008/56/EC of the European Parliament and of the Council of 17 June 2008 establishing a framework for community action in the field of marine environmental policy (Marine Strategy Framework Directive). Official Journal of the European Communities 2008. 22 pages.
- Anonymous. 2009. St.meld. nr. 37 (2008-2009). Helhetlig forvaltning av det marine miljø i Norskehavet (forvaltningsplan). Oslo: Ministry of Environment. 141 pages. ( in Norwegian)
- Anonymous. 2011. Meld. St.10. Oppdatering av forvaltningsplanen for det marine miljø i Barentshavet og havområdene utenfor Lofoten (Revised Barents Sea Management Plan). Oslo: Ministry of Environment. 144 pages. ( in Norwegian)
- Bellec VK, Dolan MFJ, Bøe R, Thorsnes T, Rise L, Buhl-Mortensen L, et al. 2009. Sediment distribution and seabed processes in the Troms II area – Offshore North Norway. Norwegian Journal of Geology 89:29–40.
- Bergman MJN, Birchenough SNR, Borja Á, Boyd SE, Brown CJ, Buhl-Mortensen L, et al. 2009. Guidelines for the study of the epibenthos of subtidal environments. ICES Techniques in Marine Environmental Sciences 42:1–88.
- Boitsov S, Petrova V, Jensen HKB, Kursheva A, Litvinenko I, Chen Y, Klungsøyr J. 2011. Petroleum-related hydrocarbons in deep and subsurface sediments from South-Western Barents Sea. Marine Environmental Research 71:357–68.
- Boitsov S, Petrova V, Jensen HKB, Kursheva A, Litvinenko I, Klungsøyr J. 2013. Sources of polycyclic hydrocarbons in marine sediments from southern and northern areas of the Norwegian continental shelf. Marine Environmental Research 87–88:73–84.
- Breiman L. 2001. Random forests. Machine Learning 45:5–32. 10.1023/A:1010933404324
- Buhl-Jensen L. 1986. The benthic amphipod fauna of the west-Norwegian continental shelf compared with the fauna of five adjacent fjords. Sarsia 71:193–208.
- Buhl-Mortensen L, Hodnesdal H, Torsnes T. 2010. Til bunns i Barentshavet. Skipnes Press. 128 pages. ( in Norwegian with English summary)
- Buhl-Mortensen L, Olsen E, Røttingen I, Buhl-Mortensen P, Hoel AH, Lid Ringheim S, et al. 2012a. Application of the MESMA Framework. Case Study: The Barents Sea. MESMA report. 138 pages.
- Buhl-Mortensen L, Buhl-Mortensen P, Dolan MFJ, Dannheim J, Bellec V, Holte B. 2012b. Habitat complexity and bottom fauna composition at different scales on the continental shelf and slope of northern Norway. Hydrobiologia 685:191–219. 10.1007/s10750-011-0988-6
- Buhl-Mortensen L, Bøe R, Dolan MFJ, Buhl-Mortensen P, Thorsnes T, Elvenes S, et al. 2012c. Banks, troughs and canyons on the continental margin off Lofoten, Vesterålen, and Troms, Norway. In: Harris P, Baker E, editors. Seafloor Geomorphology as Benthic Habitat: GeoHab Atlas of Seafloor Geomorphic Features and Benthic Habitats. Elsevier Insights eBook, p 703–15.
- Buhl-Mortensen L, Aglen A, Breen M, Buhl-Mortensen P, Ervik A, Husa V, et al. 2013a. Impacts of fisheries and aquaculture on sediments and benthic fauna: Suggestions for new management approaches. Fisken og Havet 2:1–69.
- Buhl-Mortensen P, Dolan M, Buhl-Mortensen L. 2009. Prediction of benthic biotopes on a Norwegian offshore bank using a combination of multivariate analysis and GIS classification. ICES Journal of Marine Science 66:2026–32. 10.1093/icesjms/fsp200
- Buhl-Mortensen P, Buhl-Mortensen L, Guillaumont G, Skjoldal HR. 2013b. Deep-water megafauna habitats – Report from a workshop on the improvement of the definitions of habitats on the OSPAR List, Bergen, 20–21 October 2011. Report for OSPAR. 22 pages.
- Costello MJ. 2009. Distinguishing marine habitat classification concepts for ecological data management. Marine Ecology Progress Series 397:253–68. 10.3354/meps08317
- Dolan MFJ, Buhl-Mortensen P, Thorsnes T, Buhl-Mortensen L, Bellec VK, Bøe R. 2009. Developing seabed nature-type maps offshore Norway: Initial results from the MAREANO programme. Norwegian Journal of Geology 89:17–28.
- Dolan MFJ, Thorsnes T, Leth J, Alhamdani Z, Guinan J, Van Lancker V. 2012. Terrain characterization from bathymetry data at various resolutions in European waters – Experiences and recommendations. NGU Report 2012.045. Trondheim: Geological Survey of Norway. 44 pages.
- Elvenes S, Dolan MFJ, Buhl-Mortensen P, Bellec VK. 2014. An evaluation of compiled single-beam bathymetry data as a basis for regional sediment and biotope mapping. ICES Journal of Marine Science 71:867–81. 10.1093/icesjms/fst154
- Gonzalez-Mirelis G, Buhl-Mortensen P, Buhl-Mortensen L, Holte B. 2014. Sårbare naturtyper i dypet. In: Bakketeig IE, Gjøsæter H, Hauge M, Sunnset BH, Toft KØ, editors. Havforskningsrapporten 2014. Fisken og havet, special issue 1–2014, p 142–51. (in Norwegian)
- Halvorsen R, Andersen T, Blom HH, Elvebakk A, Elven R, Erikstad L, et al. 2009. Naturtyper i Norge – Teoretisk grunnlag, prinsipper for inndeling og definisjoner. Naturtyper i Norge, version 1.0, article 1:1–210. ( in Norwegian)
- Mortensen PB, Buhl-Mortensen L. 2005. Coral habitats in The Gully, a submarine canyon off Atlantic Canada. In: Freiwald A, Roberts JM, editors. Cold-water Corals and Ecosystems. Berlin: Springer-Verlag, p 247–77.
- OSPAR Commission. 2008. Case Reports for the OSPAR List of Threatened and/or Declining Species and Habitats. London: OSPAR Commission. 261 pages.
- Phillips SJ, Dudík M, Schapire RE. 2004. A maximum entropy approach to species distribution modeling. In: Proceedings of the 21st International Conference on Machine Learning, Banff, Alberta, p 655–62.
- Steltzenmüller W, Breen P, Stamford T, Thomsen F, Badalamenti F, Borja A, et al. 2013. Monitoring and evaluating of spatially managed areas: A generic framework for implementation of ecosystem based marine management and its application. Marine Pollution Bulletin 37:149–64.
- ter Braak CJF, Smilauer P. 2002. CANOCO Reference Manual and CanoDraw for Windows User's Guide: Software for Canonical Community Ordination (version 4.5). Ithaca NY: Microcomputer Power. 11 pages.
- UN. 1992. Convention on Biological Diversity, June 5, 1992, art. 1, 31 I.L.M. 818. 30 pages.
- Wilson MFJ, O'Connell B, Brown C, Guinan JC, Grehan AJ. 2007. Multiscale terrain analysis of multibeam bathymetry data for habitat mapping on the continental slope. Marine Geodesy 30:3–35. 10.1080/01490410701295962
- Wright D, Heyman W. 2008. Introduction to the special issue: Marine and coastal GIS for geomorphology, habitat mapping, and marine reserves. Marine Geodesy 31:223–30. 10.1080/01490410802466306