
Abstract
Phenotypic and genetic differentiation among goatfish species of the genus Upeneus which had been formerly included in the so-called ‘vittatus group’ were examined using a comprehensive alpha-taxonomic and barcoding approach. Four of the five species of this group, U. indicus, U. suahelicus, U. supravittatus and U. vittatus, occur in the Western Indian Ocean (WIO), while U. parvus occurs in the Western Atlantic. An updated diagnosis of the WIO species, followed by detailed inter- and intraspecific comparison, is provided based on a large set of morphological and colour characters obtained from 134 specimens. The phenotypic comparisons among all five species and the evidence obtained from barcoding analyses of four species support the separation of U. parvus and U. vittatus from the other three more similar and closely related species which form the here newly established suahelicus group. An identification key for this species group is provided that should also minimize possible confusion with U. vittatus and species of the U. stenopsis group, two of which also occur in the WIO. New records for Madagascar and Saudi Arabia (U. suahelicus), Iran and Pakistan (U. supravittatus) and Sudan (U. vittatus) are reported. Application of this integrative approach to other species groups and species of Upeneus and the need to uncover intra- and interspecific distribution patterns and diversity more fully within the suahelicus group are outlined.
Introduction
Taxonomic accounts of species-rich genera often seek – primarily for practical reasons – to assemble species groups based on concurring similarity of a few easily identifiable phenotypic characters. While this approach facilitates within-genus comparisons and the preparation of identification keys, it will not necessarily convey reliable information about phylogenetic relationships. To investigate if previously established species groups indeed reflect evolutionary relationships, or should be re-assembled or split into other coherent units, more refined comparative studies that integrate a large number of phenotypic characters and genetic information have to be conducted.
The goatfish genus Upeneus currently consists of 37 species (Uiblein & Gledhill Citation2015; Uiblein & White Citation2015) for which five phenotypically distinct species groups have been identified in previous taxonomic accounts (Uiblein & Heemstra Citation2010; Uiblein & Causse Citation2013; Uiblein & Gouws Citation2014). Accordingly, the vittatus group, which we focus on here, can be distinguished from the japonicus, tragula and moluccensis groups by the combination of high counts of pectoral-fin rays, gill-rakers and lateral-line scales, and several dark oblique bars on both lobes of the caudal fin (Uiblein & Heemstra Citation2010). More recently, the so-called stenopsis group was established, which differs from the vittatus group in the absence of body stripes, shallower caudal-peduncle, larger head and larger eyes (Uiblein & McGrouther Citation2012; Uiblein & Causse Citation2013).
The vittatus group currently consists of five species, U. indicus Uiblein & Heemstra, Citation2010, U. parvus Poey, 1852, U. suahelicus Uiblein & Heemstra, Citation2010, U. supravittatus Uiblein & Heemstra, Citation2010 and U. vittatus (Forsskål, 1775). All these species have at least one yellowish body stripe, dark oblique bars on both caudal-fin lobes, a dark first dorsal-fin tip, and comparatively high pectoral-fin ray, gill-raker and lateral-line counts. Two of these species, U. suahelicus and U. supravittatus, appeared to be particularly similar in the original account by Uiblein & Heemstra (Citation2010), while the other three species could be more easily distinguished by single morphometric characters. These are body depth at anal-fin origin in U. indicus, barbel length in U. parvus, or species-specific colour patterns (strong size variation among both the lower caudal-fin lobe bars and their pale interspaces in U. vittatus). While U. parvus is restricted to the Western Atlantic Ocean, the other four species occur in the Western Indian Ocean region (WIO). Upeneus supravittatus also occurs off E India, Eastern Indian Ocean (EIO), and U. vittatus is widely distributed in the Indo-Pacific.
Recently, more study material and photographs of freshly collected specimens have become available for more detailed phenotypic comparisons among the WIO species of the vittatus group, using a large set of morphological and colour characters. Along with the alpha-taxonomic studies, a large number of genetic tissue samples of four vittatus group species (no genetic samples of U. indicus were available), as well as from other Upeneus species were analysed to examine molecular differentiation and genetic relationships using barcoding (Hebert et al. Citation2003).
This comprehensive alpha-taxonomic and genetic approach allows us to (1) establish a new, distinct species group, the so-called suahelicus group, based on updated taxonomic diagnoses and comparisons, and (2) further examine these findings by genetic methods. For the species of the suahelicus group an identification key is provided. The benefits and challenges of jointly applying phenotypically based taxonomy and genetic barcoding studies for the proper distinction of species with rather different degrees of evolutionary diversification are discussed.
Materials and methods
Alpha-taxonomic studies
A total of 136 specimens from various museum collections were identified as Upeneus indicus (n = 2), U. parvus (n = 3), U. suahelicus (n = 49), U. supravittatus (n = 55) and U. vittatus (n = 27) using earlier published keys and diagnostic information (Uiblein & Heemstra Citation2010, Citation2011a; Uiblein & Causse Citation2013; Uiblein & Gouws Citation2014; Uiblein & Gledhill Citation2015). For 134 specimens (only photographs were examined of two U. suahelicus from Madagascar), 41 morphometric characters including standard length (SL) (all in mm, to the nearest second decimal point), 10 meristic characters and several colour characters were compiled, following earlier published work (e.g. Uiblein & Heemstra Citation2010, Citation2011a, Citation2011b; Uiblein & Gouws Citation2014). As in Uiblein & Gouws (Citation2014), the number of oblique bars on each caudal-fin lobe was determined and quantitatively studied. All percentage and ratio values smaller than 10.0 were rounded up to the nearest first decimal point, while larger values were rounded up to the nearest unit position. Methods for measuring and counting, as well as descriptions of colour based on preserved specimens and photographs of fresh fish, follow Uiblein & Heemstra (Citation2010).
Particular attention was paid to elaborate the most important diagnostic characters for distinction among species in the subsequent comparisons. Species and population differences were only accepted for overlapping ranges of quantitative characters, if the overlaps were minor compared with overall within-sample variation, the means by which the compared samples clearly differed from each other, and the number of specimens involved in the overlap was clearly less than the respective sample size. To differentiate species more completely and since many of the overlaps were for single characters, pairwise combinations of characters were graphically explored and statistical comparisons of meristic characters were performed using Chi-square tests for trends (significance level of P ≤ 0.01; GraphPad Prism 5 Software).
For clear identification of the new species group established here, a key was prepared, accounting also for U. vittatus and the species of the stenopis group (Uiblein & Causse Citation2013), two of which occur in the WIO (U. davidaromi Golani, 2001 and U. mascareinsis Fourmanoir & Guézé, 1967). Both in the comparisons and the key, special emphasis was given to the combined use of two or three different character types and to include diagnostically important information on colour patterns of both fresh and preserved fish.
Possible geographic variation was explored by population comparisons between the East African coast (South Africa to Kenya) and the Red Sea for U. suahelicus, from Pakistan/S Iran, Kerala (W India), Sri Lanka, and Madras (E India) for U. supravittatus, and from the WIO proper, the Red Sea, and the EIO (Thailand to W Indonesia) for U. vittatus. To account for allometric changes during early ontogeny, the morphometric and caudal-fin bar data obtained from a single 72 mm SL U. vittatus from the Red Sea was treated separately from the comparisons among all larger specimens (> 75 mm SL).
Institutional abbreviations follow Eschmeyer (Citation2015). Other abbreviations are: HIFIRE = Fish collection of the Institute of Marine Research, Bergen, Norway; HT = holotype; LL = lateral-line scales; PT = paratype(s).
Comparative material examined
Upeneus parvus (n = 3, 110–148 mm SL): Eastern Central Atlantic: USNM 394942, 2 specimens, 110–119 mm, USA, Gulf of Mexico, Texas, 27°15′59″N, 96°27′58″W, 100 m; Caribbean, Bahamas: USNM 395433, 148 mm, 23°04′N, 78°46′W. For comparative data of the stenopsis group see Uiblein & Causse (Citation2013) and references therein.
Genetic studies
Taxon and sample selection
Most representatives of Upeneus suahelicus, U. supravittatus and U. vittatus for which tissue samples were available through the National Fish Collection at the South African Institute for Aquatic Biodiversity (SAIAB), Grahamstown, South Africa, were included in this study. The ‘barcoding’ (Hebert et al. Citation2003) fragment of the cytochrome c oxidase subunit I (COI) gene was sequenced for each of these specimens, as outlined by Uiblein & Gouws (Citation2014). Published or publicly available data for these species were also obtained from the Barcode of Life Data Systems v3 (BOLD, Boldsystems Citation2015) and were included in the analyses. Such data were only included if (1) the length of the available sequence exceeded 500 nucleotides; (2) information on the sampling locality of the specimen was specifically indicated; (3) a voucher specimen or an e-voucher (photograph) was indicated; and (4) if the sequences themselves did not appear to be outliers of the clades formed by the nominal taxa in a preliminary tree constructed using all available BOLD data and unpublished BOLD data in projects managed by the SAIAB and CSIRO Australia. Data for the three species were also sourced from SAIAB's ‘Fishes of the Western Indian Ocean’ projects on BOLD (all available data for these species), from CSIRO Australia (selected sequences of U. vittatus) and the Senckenberg Natural History Museum, Frankfurt (sequences of U. suahelicus from the Red Sea). Where possible, identifications of representatives of these species for which existing data were included, were confirmed by examination of the voucher material or photographs (see ). COI data from selected representatives of other Upeneus species, Upeneus guttatus (Day, 1868), U. heemstra Uiblein & Gouws, Citation2014, U. margarethae Uiblein & Heemstra, Citation2010, U. mascareinsis, U. moluccensis (Bleeker, 1855), U. parvus, U. quadrilineatus Cheng & Wang, 1963, U. sulphureus Cuvier, 1829 and U. tragula Richardson, 1846, were included to contextualize divergences and relationships among individuals of the three species above, and to provide a preliminary assessment of relationships among the major morphological groups within Upeneus. Such data were obtained from the sources above. Unfortunately, genetic samples of U. indicus were not available. Parupeneus barberinus (Lacepède, 1801) and Mulloidichthys vanicolensis (Valenciennes, 1831) were used as outgroups in the preliminary stages of the analysis. All specimens from which data were produced and the sources of the mined data are indicated in .
Table I. Details of the cytochrome c oxidase subunit I (COI) sequences of the 12 species of Upeneus included in the genetic study. Information provided includes the species assignment in the present study, the species identity under which the data are accessioned on BOLD and/or GenBank (if different from the identification in the present study), the GenBank number and/or the BOLD Process ID (if available), the collection locality, the accession details of the corresponding voucher specimen, and details on the original reference for the data and/or other significant information. SAIAB accession numbers presented in parentheses refer to lots for which no vouchers are retained, but for which associated images (e-vouchers) and tissue samples have been catalogued.
Data analysis
Sequences were aligned using Clustal X (Larkin et al. Citation2007), using the default parameters. Phylogenetic analyses were conducted under maximum likelihood (ML) and unweighted parsimony (UP) frameworks, using PAUP* 4b10 (Swofford Citation2002). For the likelihood and parsimony analyses, heuristic tree searches with TBR (= tree bisection and reconnection) branch-swapping of starting trees (100 in the case of ML and 1000 for UP, each obtained using a random stepwise addition of taxa) were used to find the most likely or parsimonious trees. Prior to the ML analysis, the most appropriate model of nucleotide substitution was determined for the data set, using jModelTest 4.1.2 (Darriba et al. Citation2012). The Akaike (Citation1974) Information Criterion was used to evaluate and choose among competing models. Support for relationships in the UP analysis was determined by bootstrapping (Felsenstein Citation1985), using 1000 pseudoreplicates of the data, each with 100 random taxon addition iterations. Support for relationships under a likelihood framework was determined by calculating the Bayesian Posterior Probability (BPP) for each node by Bayesian Inference in MrBayes 3.1.2 (Ronquist & Huelsenbeck Citation2003). Four independent analyses (each starting from a random tree and employing four MCMC (= Markov chain Monte Carlo) chains) were run simultaneously over 107 generations, with the posterior distribution sampled every 2000 generations. The model selected above was implemented, but with MrBayes estimating the model parameters. Default priors were used. Convergence among the independent runs was determined by considering the standard deviation of split frequencies. Tracer 1.5 (Rambaut & Drummond Citation2009) was used to determine stationarity and whether sampling of the various parameters from the posterior distribution was sufficient (i.e. each with an ESS ≥ 200), as well as to determine the burn-in length. Post burn-in trees from all four analyses were combined and summarized as a single majority-rule consensus tree, with the proportional retrieval of particular nodes representing the posterior probabilities for those relationships.
A 95%-credible parsimony network was constructed using TCS 1.21 (Clement et al. Citation2000) to examine genealogical relationships, which may be non-bifurcating and reticulate, among those COI haplotypes present within a number of nominal taxa (see below).
Sequence divergence within and among the nominal taxa and clades identified in the analyses were calculated and corrected using the Kimura (Citation1980) two-parameter model to enable comparison to other barcoding surveys and an earlier genetic study on Upeneus (see Uiblein & Gouws Citation2014).
Results
The alpha-taxonomic studies, in agreement with the currently available genetic information (see above and below), revealed the existence of a distinct species group, termed the suahelicus group, consisting of the three species Upeneus indicus, U. suahelicus and U. supravittatus. Accordingly, U. vittatus and U. parvus can be well distinguished and are neither tightly related to this group nor to each other.
Taxonomy
Genus Upeneus Cuvier, 1829
Key to the species of the suahelicus group
This key aims to properly identify the three species of the suhaelicus group and distinguish them from the phenotypically most similar Upeneus vittatus and the stenopsis species group, of which U. davidaromi and U. mascareinsis occur in the WIO (see Uiblein & Heemstra Citation2010, for species diagnoses and key).
1a. Oblique bars on both lobes of caudal fin at least partly black or dark brown, frequently varying in colour intensity, bars or interspaces between them often unequal in width; oblique bars on upper caudal-fin lobe not curved; 0 or >2 yellow or pale brown lateral body stripes in fresh fish; body depth at anus 4.1–5.8 in SL; pectoral-fin length 3.8–4.9 in SL and 1.3–1.6 in head length; total gill-rakers 25–29 2 (U. vittatus and stenopsis group)
1b. Oblique bars on both lobes of caudal fin pale brown to brown, mostly uniformly coloured, pale interspaces between bars nearly equal in width; oblique bars on upper caudal-fin lobe curved; 2 narrow yellow or pale brown lateral mid-body stripes in fresh fish; body depth at anus 3.7–4.6 in SL; pectoral-fin length 3.5–4.5 in SL and 1.1–1.4 in head length; total gill-rakers 26–32 3 (suahelicus group)
2a. Height of black tip of 1st dorsal fin and width of largest oblique bar and/or interspace between distal oblique bars of lower caudal-fin lobe subequal to or greater than orbit length; 3 or 4 narrow, yellow to bronze stripes on body in fresh fish; caudal-peduncle depth 8.6–10 in SL U. vittatus
2b. Height of black tip of 1st dorsal fin and width of largest oblique bar and/or interspace between distal oblique bars of lower caudal-fin lobe less than orbit length; no stripes on body in fresh fish; caudal-peduncle depth 10–12 in SL stenopsis group
3a. Lateral-line scales 36; body depth at anus 3.7–3.9 in SL; pectoral-fin length 4.2–4.5 in SL and 1.3 in maximum body depth; stripes on mid-body not connecting to mid-lateral oblique bars on caudal fin U. indicus
3b. Lateral-line scales 34–35 (rarely 36); body depth at anus 3.8–4.6 in SL; pectoral-fin length 3.5–4.4 in SL and 1.0–1.2 in maximum body depth; stripes on mid-body connecting to mid-lateral oblique bars on caudal fin 4
4a. Total gill-rakers 26–28; head length 3.2–3.5 in SL; barbel length 4.7–6.5 in SL; pectoral-fin length 3.9–4.4 in SL; South Africa to Red Sea U. suahelicus
4b. Total gill-rakers 27–32 (mostly 29–31); head length 3.0–3.3 in SL; barbel length 4.3–6.0 in SL; pectoral-fin length 3.5–4.3 in SL; S Iran to Sri Lanka and E India U. supravittatus
Upeneus indicus Uiblein & Heemstra, Citation2010
Cochin goatfish
(, –)
Upeneus indicus Uiblein & Heemstra, Citation2010: 43, plates 1, 3 (type locality: Cochin, southwestern India).
Material examined (n = 2, 131–136 mm SL)
BPBM 27524, 136 mm, HT, Southwestern India, Cochin; BPBM 40987, 131 mm, PT, same locality as HT.
Diagnosis
Dorsal fin VIII spines, 9 rays; pectoral fins 15 or 16 rays; gill-rakers 9 + 20–22 = 29–31; LL 36; measurements in % of SL: body depth at 1st dorsal-fin origin 29–31, at anus 26–27; caudal-peduncle depth 11; maximum head depth 25–26; head length 30–31; barbel length 19–20; caudal-fin length 27–28; anal-fin height 15; pelvic-fin length 19; pectoral-fin length 22–24; 1st dorsal-fin height 22–23; total oblique bars on caudal fin 8–9, wider than interspaces, 4–5 pale brown oblique bars on upper caudal-fin lobe and 4 on lower caudal-fin lobe, the 3 proximal oblique bars on upper lobe slightly curved; 2 oblique caudal-fin bars mid-laterally (close to fork) reduced and not extending to fin base; oblique bars on caudal fin not or only weakly retained in preserved fish; head and body reddish dorsally, silvery pink on side and ventrally, including anterior part of caudal fin; 3 narrow, pale brown stripes on side of body, one at eye level, one from base of pectoral fin, one short and weak stripe dorsally below dorsal fins; mid-body stripes not connecting to oblique bars on caudal fin; body uniformly pale brown in preserved fish, stripes not retained; tip of first dorsal fin dark, also in preserved fish; barbels white.
Distribution
Known only from the type locality, Cochin, southwestern India.
Size
Upeneus indicus attains at least 14 cm SL.
Upeneus suahelicus Uiblein & Heemstra, Citation2010
Swahili goatfish
( and SI, )
Table II. Morphometrics, meristics, and caudal-fin colour characters in four species of Upeneus.
Figure 1. (A) U. suahelicus, SAIAB 13948, HT, 10.1 cm SL, Kenya (P.C. Heemstra); (B) Upeneus suahelicus, SAIAB 97929, 10.4 cm SL, Fort Dauphin, Madagascar (P.C. Heemstra); (C) U. indicus, BPBM 27524, HT, 13.7 cm SL, Cochin, W India (J.E. Randall); (D) U. supravittatus, SAIAB 187367, 11.7 cm SL, Negombo, Sri Lanka (F. Uiblein); (E) U. supravittatus, BPBM 20504, PT, 12.0 cm SL, Madras, E India (J.E. Randall); (F) U. vittatus, 16.1 cm SL, Zanzibar Channel, Tanzania (J.E. Randall).
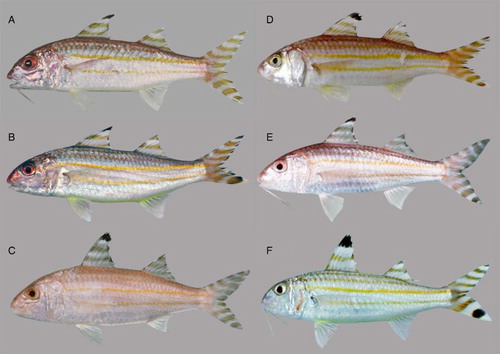
Figure 2. Morphological distinction among the four species using SL, three morphometric characters, and total number of gill rakers, with polygons drawn for delimiting species (U. suahelicus – continuous line; U. supravittatus – dashed line; Upeneus vittatus – dotted line). The three specimens not placed within the two barcoding clades (see and text) are indicated by filled (i.e., completely black) symbols.
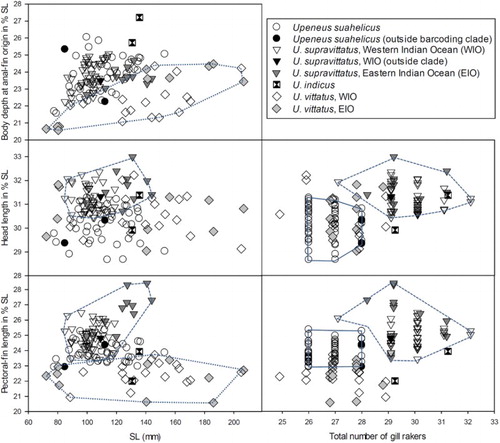
Figure 3. Meristic characters for the three quantitatively studied species indicating pairs of species which do not differ significantly (‘ns’) based on the Chi2 test for trends. The three specimens not placed within the two barcoding clades (see and text) are indicated by filled circles.
Figure 4. Counts of caudal fin bars for the three quantitatively studied species indicating pairs of species which do not differ significantly (‘ns’) based on the Chi2 test for trends.
Upeneus suahelicus Uiblein & Heemstra, Citation2010: 50, plates 2, 3 (type locality: off Malindi, Kenya).
Material examined (n = 49, 78–153 mm SL)
Lots from which genetic tissue samples were analysed are highlighted in bold (see also ).
Red Sea: HUJ 8555, 124 mm, Massawa, Eritrea; SMF 33643, 130 mm, Saudi Arabia, Jeddah, fish market; SMF 35488, 85 mm, Saudi Arabia, Jizan, 16°57′52″N, 42°25′31″E, 16–19 m; Kenya: SAIAB 13948, 101 mm, HT, and SAIAB 82816, 102 mm, PT, off Malindi, 03°07′S, 40°11′E; Tanzania: SAIAB 87011, 81 mm, Zanzibar town, Malindi fish market; Mozambique: BPBM 41187, 5 specimens, 91–117 mm, Mozambique, 19˚09′S, 26˚20′E, 27–30 m; SAIAB 55589 and 82805, 2 specimens, 100–135 mm, PT, Lipobane estuary, 19°00′14S, 39°04′44E; SAIAB 74521, 3 specimens, 100–114 mm, PT, off Quelimane, 20 m; SAIAB 81952, 95 mm, 34°46.57′S, 25°07.31′E, 99 m; SAIAB 81957, 88 mm, PT, 34°22.15′S, 25˚00.03′E, 46 m; SAIAB 82006, 3 specimens, 108–120 mm, 24°33′42″S, 35°15′36″E, 50–51 m; SAIAB 82296, 94 mm, Mozambique, 19°13′42″S, 36°18′48″E, 29–32 m; SAIAB 190098, 5 specimens, 107–129 mm, N Mozambique, 17°19′27″S 39°77′06″E; USNM 396113, 93 mm, PT, Ponta Mahone-Inhaca; South Africa: SAIAB 76122, 2 specimens, 107–121 mm, PT, KwaZulu-Natal, Richards Bay, 28°49′54″S, 32°10′04″E, 45 m; SAIAB 82820, 89 mm, PT, 36°31.38′S, 19°22.85′E, 29 m; SAIAB 82824, 78 mm, KwaZulu-Natal, Richards Bay, 28°49′54″S, 32°10′04″E, 45 m; SAIAB 11478, 101 mm, PT, Durban, 29°S, 31°E; SAIAB 62742, 136 mm, KwaZulu-Natal, Tugela Bank, 29°6′36″S, 31°50′E; SAIAB 87793, 2 specimens, 136–153 mm, KwaZulu-Natal, Tugela Bank, 29°07′30″S, 31°45′E, 40 m; SAIAB 88454, 2 specimens, 127–128 mm, KwaZulu Natal, Richards Bay, 28°49′54″S, 32°10′04′E, 45 m; SAIAB 186414, 5 specimens, 100–114 mm, KwaZulu-Natal, 29°31′11″S, 31°50′E, 27 m; SAIAB 188882, 134 mm, KwaZulu-Natal, Tugela Bank, 29°07′30″S, 31°45′E, 30 m; SAIAB 188947, 2 specimens, 126–127 mm, KwaZulu-Natal, Vetch's Pier, 29°52′S, 31°02′54″E; SAM 34162, 114 mm, 19°28′S, 36°37′E; Madagascar: SAIAB 97929, 2 specimens, 104–107 mm SL, Fort Dauphin (only photographs examined, the larger specimen also genetically studied).
Diagnosis
Dorsal fin VIII spines, 9 rays; pectoral fins 13–17 rays; gill-rakers 6–8 + 18–21 = 26–28; LL 33–35; measurements in % of SL: body depth at 1st dorsal-fin origin 25–30; at anus 22–26; caudal-peduncle depth 9.7–12; maximum head depth 21–25; head length 29–31; barbel length 15–21; caudal-fin length 26–30; anal-fin height 15–17; pelvic-fin length 18–21; pectoral-fin length 23–25; 1st dorsal-fin height 21–26; total number of oblique bars on caudal fin 8–11, 4–6 pale brown oblique bars on upper caudal-fin lobe, and 3–5 of same colour on lower caudal-fin lobe; 3 upper-lobe proximal bars slightly curved; oblique bars and pale interspaces on upper caudal-fin lobe nearly equal in width; lower caudal-fin lobe in adult specimens sometimes considerably shorter than upper lobe, with distal-most oblique bar increased in size (B); oblique bars on caudal fin entirely retained in preserved fish; head and body reddish-brown dorsally, silvery white laterally, and white ventrally, with 2 yellow or pale brown stripes on mid-body, each stripe connecting to a mid-lateral oblique bar on caudal fin; body pale brown in preserved fish, sometimes darker dorsally, stripes lost; tip of 1st dorsal fin dark, also in preserved fish; barbels white.
Distribution
WIO. Southern Red Sea, Kenya to South Africa (Durban) and Madagascar. New record for Saudi Arabia and Madagascar. Depth: 20–99 m.
Remarks
The colour of the oblique caudal-fin bars may occasionally fade away during preservation, as may have happened in six additional specimens from Eritrea, Red Sea (HUJ 4944, HUJ 11664), which were only tentatively referred to Upeneus suahelicus and hence not included in this study.
Size
Upeneus suahelicus attains 15 cm.
Upeneus supravittatus Uiblein & Heemstra, Citation2010
Longfin goatfish
and SII, )
Upeneus supravittatus Uiblein & Heemstra, Citation2010: 53, plates 2, 3 (type locality: Kelani river drainage, Colombo, Sri Lanka).
Upeneus vittatus: Blegvad & Løppenthin Citation1944: 134, plate 7, figure 2 (colour painting)
Material examined (n = 55, 85–144 mm SL)
Lots from which genetic tissue samples were analysed are highlighted in bold (see also ).
Iran, Gulf of Oman: ZMUC P49156, 113 mm, Chahabar; Pakistan: BPBM 31267, 9 specimens, 96–115 mm; Southwest India, Kerala: USNM 267679, 5 specimens, 104–108 mm, PT, Vizhingam, 8˚22'N, 76˚58′E; Sri Lanka: NRM 24606, 6 specimens, 85–99 mm, PT, Colombo, Slave Island Market, Kelani River drainage, 6˚55′55″N, 79˚50′52″E; NRM 51635, 96 mm, HT, Sri Lanka, Colombo, Slave Island Market, Kelani River drainage, 6˚55′55″N, 79˚50′52″E; NRM 18877, 118 mm, PT, off Negombo; SAIAB 187367, 22 specimens, 89–119 mm, Sri Lanka, Negombo fish market, 7°12′20″N, 79°49′41″E; East India, Madras State: BPBM 20504, 3 specimens, 112–133 mm, PT, Madras, 40 m; MNHN A3463, 100 mm, Puducherry, 11°58′59″N, 79°49′59″E; USNM 396114, 6 specimens, 127–144 mm, PT, Puducherry.
Diagnosis
Dorsal fin VIII spines, 9 rays; pectoral fins 16–17 rays; gill-rakers 7–9 + 19–23 = 27–32; LL 34–36; measurements in % of SL: body depth at 1st dorsal-fin origin 25–30, at anus 22–25; caudal-peduncle depth 9.7–11; maximum head depth 22–26; head length 30–33; barbel length 17–23; caudal-fin length 27–31; anal-fin height 15–17; pelvic-fin length 18–21; pectoral-fin length 23–28; 1st dorsal-fin height 22–26; total oblique bars on caudal fin 8–11, 4–6 oblique brown bars on upper caudal-fin lobe, 3–5 of same colour on lower caudal-fin lobe; 3 upper-lobe proximal oblique bars strongly curved, 2 lower-lobe proximal bars slightly curved; oblique bars and pale interspaces on upper caudal-fin lobe nearly equal in width; lower caudal-fin lobe in adult specimens sometimes considerably shorter than upper lobe, with distal-most oblique bar increased in size; oblique bars on caudal fin retained in preserved fish; head and body brassy or silvery grey, pale rose laterally and slightly darker dorsally, pale ventrally; two pale-brown mid-body stripes in fresh fish, one from upper rear margin of opercle to caudal-fin base, and the other from pectoral-fin base to caudal-fin base, each stripe connecting to an oblique bar on caudal fin; body uniformly brown in preserved fish, sometimes dorsally darker, stripes lost; tip of 1st dorsal fin dark, also in preserved fish; barbels white.
Distribution
Indian Ocean. S Iran (Gulf of Oman), Pakistan, India, Sri Lanka. New record for Iran (Gulf of Oman) and Pakistan. Depth: 40 m.
Remarks
The specimen from Chahabar, S Iran (ZMUC P49156) had been previously published (under incorrect locality information) as Upeneus sulphureus in Uiblein & Heemstra (Citation2010). The oblique caudal-fin bars, as indicated in a drawing by Blegvad & Løppenthin (Citation1944), which is most probably based on this specimen (John E. Randall, personal communication, 2010), have faded away. This loss of the caudal-fin bar pigmentation in preserved specimens parallels U. suahelicus (see account above), thus rendering the distinction from other congeneric species that lack those bars (like U. sulphureus) more difficult.
Recently, after the alpha-taxonomic studies had been completed, an 18.7 cm SL voucher specimen (SAIAB 200573) from Pakistan with a tissue sample were obtained and identified as U. supravittatus by barcoding (GenBank KR057900 – this sequence was not included in the genetic analysis due to its shorter length).
Size
Upeneus supravittatus commonly attains 14 cm SL, but may reach at least 18.7 cm SL (see Remarks section above).
Upeneus vittatus (Forsskål, 1775)
Yellowstriped goatfish
( and SIII, )
Mullus vittatus Forsskål, 1775: 31 (type locality: Jeddah, Red Sea).
Upeneus vittatus: Uiblein & Heemstra Citation2010, Uiblein & McGrouther Citation2012, Uiblein & Causse Citation2013
Material examined (n = 27, 72–207 mm SL)
Lots from which genetic tissue samples were analysed are highlighted in bold (see also ).
Red Sea: BPBM 41188, 72 mm, Sudan, Port Sudan harbour; SMF 1185, 163 mm, neotype, most probably Ethiopia; SMF 33642, 132 mm, Saudi Arabia, Jeddah fish market; Mozambique: SAIAB 82327, 146 mm, 38˚21′26″S, 17˚42′46″E, 25 m; SAIAB 189865, 2 specimens, 153–170 mm, 16°06′56″S, 44°10′22″E, 31–32 m; SAIAB 190996, 5 specimens, 124–140 mm, 17°19′26″S, 39°18′46″E; South Africa: SAIAB 40593, 161 mm, KwaZulu-Natal, Sodwana; SAIAB 190806, 97 mm, Kariega estuary, 33°38′13″S, 26°38′33″E; SAM 25942, 205 mm, Durban, 29°52′15″S, 31°03′29″E; SAM 26521, 88 mm, Durban, 29°52′15″S, 31°03′29″E; Mauritius: SAIAB 31413, 144 mm; Réunion: MNHN1965-76, 168 mm, 21˚07′0″S, 55˚35′00″E; MNHN1965-77, 149 mm, 21˚07′0″S, 55˚35′00″E; Thailand, EIO: ZMUC P49379–81, 3 specimens, 140–186 mm, Phuket fish market; Indonesia, EIO: BMNH 1986.10.1.39, 156 mm; CSIRO H7370-01, 81 mm, West Java, Pelabuhanratu; CSIRO H7363-02, 207 mm, and CSIRO H7370-02, 2 specimens, 80 mm, Lombok, Tanjung Luar; CSIRO H7793-01, 141 mm, Bali, Kedonganan.
Diagnosis
Dorsal fin VIII spines, 9 rays; pectoral fins 15–17 rays; gill-rakers 5–9 + 18–21 = 25–29; LL 35–37; measurements in % of SL: body depth at 1st dorsal-fin origin 24–30, at anus 21–24; caudal-peduncle depth 9.8–12; maximum head depth 21–26; head length 29–32; barbel length 16–21; caudal-fin length 27–31; anal-fin height 14–18; pelvic-fin length 18–20; pectoral-fin length 21–24; 1st dorsal-fin height 22–28; total number of oblique bars on caudal fin 7–10; 4–6 oblique brown or dark brown bars on upper caudal-fin lobe; 3 (rarely 4) oblique bars on lower caudal-fin lobe, increasing distally in width, distal-most bar widest, black or dark brown, other bars pale brown or brown; width of largest oblique bar and/or pale interspace between distal-most oblique bars on lower caudal-fin lobe equal to or larger than orbit; tip of lower-fin lobe pale; oblique bars on caudal fin retained in preserved fish; body white to silvery on sides, dorsally reddish brown, ventrally white, faint yellowish patches along pelvic and anal-fin bases; body pale brown in preserved fish, slightly darker dorsally; 2 yellow or pale brown mid-body stripes, one from eye to caudal-fin base and the other from pectoral-fin base to caudal peduncle, each stripe connecting to an oblique bar on caudal fin; 2 brown or pale brown stripes further dorsally, one from upper rear margin of opercle to behind 2nd dorsal fin, other indistinct and much shorter below 1st dorsal fin; all body stripes lost in preserved fish; tip of 1st dorsal fin dark, height of pigmented area similar to width of widest oblique bar on lower caudal-fin lobe; dark tip of 1st dorsal fin retained in preserved fish; barbels white.
Distribution
Indo-Pacific. WIO: Red Sea, Tanzania, Mozambique, South Africa (W of Port Alfred), Madagascar and Mauritius; elsewhere to Hawaii and Samoa. First verified record for Sudan. Depth: to at least 100 m.
Size
Upeneus vittatus attains 28 cm.
Comparisons
Species of the suahelicus group can be distinguished from all other congeneric species by the following combination of characters: 26–32 total gill-rakers; body depth at anus 22–27% SL; pectoral-fin length 22–28% SL and 1.1–1.4 in head length; oblique pale-brown to brown bars on both caudal-fin lobes in fresh and preserved fish (sometimes lost in preservative); pale interspaces between bars nearly equal in width; bars on upper caudal-fin lobe curved; two narrow yellow or pale-brown mid-body stripes in fresh fish; first dorsal fin with dark tip.
The three species of the suahelicus group can be distinguished from each other by the combination of several characteristics as follows: Upeneus indicus differs from the other two species of the suahelicus group in having more lateral-line scales, a larger body depth at anus, shorter pectoral fins and the mid-body stripes not connecting to the oblique bars on the caudal fin; Upeneus suahelicus differs from U. supravittatus in having fewer pectoral-fin rays and gill-rakers, a shorter head and slightly shorter barbels. While there is overlap between those two species in single diagnostic characters, clear species distinction is achieved by a combination of head length, barbel length and gill-raker number (). These morphological a comparisons included several specimens of U. suahelicus and U. supravittatus which were also analysed genetically, including the three individuals which could not be correctly classified by barcoding technique (see below).
No marked intraspecific differences were found among populations of U. suahelicus from the WIO proper and the Red Sea (Table SI). The only population differences found for U. supravittatus are shorter barbels in the easternmost population (S Iran to Pakistan; barbel length 17–19% SL) compared with the other three populations (18–23% SL) and longer pectoral fins in specimens from the easternmost population (Madras; pectoral-fin length 25–28% SL) compared with the populations from Sri Lanka, West India and Pakistan/South Iran (23–26% SL) (Table SII, ).
Upeneus vittatus differs from the three suahelicus-group species in the irregular width and spacing of the oblique bars on the lower caudal-fin lobe, with the distal-most bar much wider, a larger dark tip on the first dorsal fin and mostly shallower body depth at anal-fin origin; furthermore, it differs from U. indicus in a shorter anal-fin base; from U. suahelicus it differs in having shorter pectoral fins, more gill-rakers and lateral-line scales, and fewer oblique bars on the caudal fin; and from U. supravittatus it differs in having shorter pectoral fins, fewer pectoral-fin rays and gill-rakers, more lateral-line scales, and fewer oblique bars on the caudal fin. No population differences were found among U. vittatus from the SW Indian Ocean, the Red Sea and the EIO (Table SIII, ). The small 72 mm SL specimen from Sudan deviates mainly in having a slightly shallower body depth (e.g. half-body depth at first dorsal-fin origin 18 vs 19–24% SL, pectoral-fin depth 14 vs 16–21% SL) and shorter barbels (barbel length 15 vs 16–21% SL) compared to larger conspecifics (Table SIII).
Comparisons with the three U. parvus specimens revealed clear differences in several morphometric characters from all four WIO species, with a shallower body at anal-fin origin (20–21 vs. 21–27% SL), shallower caudal peduncle (8.4–9.4 vs 9.7–12% SL), longer barbels (24–25 vs 15–23% SL), a shorter anal fin (8.7–9.3 vs 9.3–13% SL) and a lower anal fin (13–14 vs 14–18% SL); examination of fresh photographs of U. parvus available through FishBase (Froese & Pauly Citation2015) showed that this species has no dark first dorsal-fin tip and only a single mid-body stripe, which is in contrast to the two or more stripes in the four WIO species.
Genetic study
The initial COI sequence alignment (575 nucleotides once trimmed to equal length) contained sequences of 75 individuals from 14 nominal taxa, including the two outgroup species (Mulloidichthys vanicolensis (Valenciennes, 1831) and Parupeneus barberinus (Lacepède, 1801)). New sequences generated in this study are lodged in GenBank (accession numbers KP293705–KP293729 and KR057890–KR057899; ). An initial parsimony analysis, based on 143 parsimony informative characters (out of 163 variable characters), yielded three equally parsimonious trees (not shown) of 402 steps (Consistency Index (CI) = 0.542, Retention Index (RI) = 0.843, Rescaled CI = 0.457). Using the above outgroups, the strict and majority-rule consensus topologies revealed a clade containing Upeneus guttatus, U. heemstra, U. margarethae, U. parvus and U. tragula to be basally derived amongst the ingroup. This was supported by the maximum likelihood phylogram (–lnL = 2727.018; tree not shown). Consequently, final analyses proceeded with these taxa designated as outgroups. This was done to depict relationships among the remaining ingroup specimens better, with the distantly related Mulloidichthys and Parupeneus specimens removed.
The final ML analysis was performed implementing the parameters of a Hasegawa et al. (Citation1985) model (HKY) with a transition/transversion rate of 5.099, unequal base frequencies (A = 0.237, C = 0.295, G = 0.167 and T = 0.302), a proportion (0.268) of invariant sites and a gamma-distribution of among-site rate variation (α = 0.211). The maximum likelihood phylogram (–lnL = 2329.670) obtained using these parameters is presented in . This topology is identical to that of the strict consensus (not shown) of the two equally parsimonious trees (315 steps, CI = 0.610, RI = 0.882; Rescaled CI = 0.538), obtained in the parsimony analysis of 138 parsimony informative characters, with respect to the relationships in the ‘crown’ group of all included U. quadrilineatus, U. supravittatus and U. suahelicus individuals. There was no conflict among these topologies with respect to supported relationships among those species basal to the ‘crown group’ (excluding those taxa designated as outgroups): Upeneus mascareinsis, U. moluccensis, U. sulphureus and U. vittatus. These topologies were similarly congruent to the consensus tree (not shown), constructed to determine nodal support (BPPs), of the 10,000 trees pooled from each of the four Bayesian Inferences after a burn-in of 50% in each.
Figure 5. Maximum-likelihood phylogram (–lnL = 2329.670) of relationships among the included individuals of 12 species of Upeneus from the analysis of COI sequence data. The tree was rooted with U. guttatus, U. heemstra, U. margarethae, U. parvus and U. tragula as outgroups. Bayesian Posterior Probabilities (BPPs) from the Bayesian inference and bootstrap support from the parsimony analysis are presented on the nodes (in the order BPP/bootstrap). Only BPPs > 0.95 and bootstraps > 75% are shown. Clades formed by U. supravittatus and U. suahelicus are indicated as A and B, respectively. Terminal names include GenBank accession numbers or BOLD Process IDs, as well as sampling regions.
Two separate, but unsupported clades were recovered within the ‘crown’ group, corresponding to U. supravittatus (A) and U. suahelicus (B), respectively. All but one U. supravittatus (KP293719) and two U. suahelicus (KAU13-663 and KP293707) sequences were placed within these clades. These three individuals were placed in a polytomy with the two major clades and formed a larger, well-supported clade (1.00 BPP, 87% bootstrap) to the exclusion of the clade formed by U. quadrilineatus. In turn, the well-supported Upeneus vittatus clade (1.00 BPP, 100%) was excluded from this larger clade with strong support (1.00 BPP, 90% bootstrap).
Given the genetic placement of the above three specimens (KAU13-663, KP293707 and KP293719), the genealogical relationships among the haplotypes present in all included U. suahelicus and U. supravittatus individuals were examined further by means of a parsimony network. Eighteen COI haplotypes were found among the 52 specimens included (). These haplotypes were partitioned into two distinct, but shallowly divergent haplogroups, corresponding to U. supravittatus (A) and U. suahelicus (B). The three individuals above shared a single haplotype that occupied a somewhat central position in the network, between the two defined haplogroups.
Figure 6. 95%-credible parsimony network indicating genealogical relationships among the 18 cytochrome c oxidase subunit I (COI) haplotypes found within the 52 Upeneus suahelicus and U. supravittatus specimens included in the genetic study. The sizes of the circles correspond to the frequency occurrence of each haplotype, according to the inset. The U. supravittatus (A) and U. suahelicus (B) haplogroups are indicated. Colours indicate the species identifications of individuals in which each haplotype was found. Each node represents one mutational step with small grey circles representing unsampled or missing haplotypes.
Sequence divergences, corrected according to Kimura's (Citation1980) two-parameter model, among nominal species and the Upeneus supravittatus and U. suahelicus clades (excluding the three individuals mentioned above) are presented in . Mean intraspecific or within-clade sequence divergences ranged from zero to 0.5%, with divergences of zero to 0.9% being obtained in individual comparisons. Comparisons among individuals of different species and clades yielded sequence divergences of 0.5 to 18.5%. The lowest values from individual comparisons (0.5–1.4%), and the lowest mean values of 0.8 and 1.0% were observed between the U. supravittatus and U. suahelicus clades and between U. heemstra and U. tragula, respectively. These divergences were well below those observed among other species and clades (the next lowest mean divergence was 2.2%) and showed some overlap with certain intraspecific or within-clade comparisons. The haplotype present in the three extra-clade U. suahelicus and U. supravittatus individuals was on average 0.2% (0.2–0.5% for individual comparisons) and 0.6% (0.4–0.9%) divergent from the U. suahelicus and U. supravittatus clades, respectively. Upeneus vittatus was 8.2% (7.8–8.4%) divergent from both of these clades.
Table III. Kimura (Citation1980) two-parameter corrected cytochrome c oxidase subunit I sequence divergences among the nominal taxa and major clades of Upeneus included and identified in this study. Mean sequence divergences are indicated (as percentages) with ranges presented in parentheses. Values below the diagonal refer to interspecific or inter-clade comparisons, while those on the diagonal (in bold) result from intraspecific or intraclade comparisons where more than a single individual was included. Divergences involving the extra-clade U. suahelicus and U. supravitattus individuals (see text) are not included.
Discussion
Taxonomic analysis
The three species Upeneus indicus, U. suahelicus and U. supravittatus form a coherent species group within the genus Upeneus that can be clearly distinguished from all other congeneric species or species groups by a combination of colour and morphological characters. Consequently, the vittatus group, as originally defined by Uiblein & Heemstra (Citation2010), has been subsequently split into additional species groups, with the stenopsis group established by Uiblein & Causse (Citation2013), followed now by the suahelicus group. Further studies will have to examine if the remaining vittatus group is indeed represented by the nominal species only. Upeneus vittatus is widely distributed and certainly more taxonomic work with inclusion of the Pacific populations has to be conducted. Upeneus parvus is geographically isolated, differing considerably from all other species that were formerly subsumed in the vittatus group and hence should be treated independently, as also suggested by barcoding.
The taxonomic accounts of three of the four WIO species are based on much larger sample sizes than available for the original study by Uiblein & Heemstra (Citation2010), providing more detailed diagnoses and semi-quantitative comparisons, an updated identification key, and new distributional information. This information should be of assistance in ecological and fisheries-biological studies and provide a sound basis to fill further knowledge gaps, which still exist. For instance, U. indicus is currently only known from the type locality (Cochin, SW India) and neither additional specimens nor any genetic samples have become available since the original description (cf. Uiblein & Heemstra Citation2010). Also, U. suahelicus overlaps with U. vittatus throughout its distributional range, but there is currently no information on whether these two species occur in the northern Red Sea and if any of them co-occur with U. supravittatus or U. indicus.
Due to the considerable material available for the current study, one can assume that U. suahelicus is geographically separated from U. supravittatus and restricted to the westernmost part of the WIO. Upeneus supravittatus seems to be restricted to the coastal area between S Iran and E India and may be locally rather abundant, as well as economically important, as it has been encountered in high numbers at the fish markets of Negombo, Sri Lanka (Franz Uiblein, personal observations, 2012) and Visakhapatnam (Sujatha Kandula, personal observations, 2012). The overall distributional information for this species is, however, still rather discontinuous and sampling in more remote and less-studied areas is still lacking.
A considerable challenge for regional ecological and fisheries-biological investigations of these species is the possibly still ongoing confusion of U. supravittatus with U. vittatus. In several fisheries or faunistic studies, for instance, U. vittatus has been indicated to occur around India and Sri Lanka (e.g. Bhargava et al. Citation2004; Rajkumar Citation2004; Kumuran et al. Citation2012; Sluka Citation2013), but the only well-documented evidence of its occurrence in or near that area comes from the Laccadive Islands in the west (Jones & Kumaran Citation1980) and the Andaman and Nicobar Islands to the east of India (Rajan et al. Citation2012). As this species is widely distributed, one can assume that it should also occur along the coasts of Pakistan, India and Sri Lanka. This species can reach relatively large sizes and may indeed have been a target for fisheries in that area over many years. Therefore, in order to implement sustainable management plans, a high priority should be given to clarify if and where exactly U. supravittatus and U. vittatus co-occur.
The possible confusion in identification between U. vittatus and U. supravittatus is mirrored by similar misidentifications between U. vittatus and U. suahelicus. This is manifested in the data available on BOLD, where barcode sequences for specimens of U. vittatus belong to two distinct BINs (Ratnasingham & Hebert Citation2013). Indeed, many of the publicly-available U. suahelicus barcodes obtained from BOLD and used in the present study are identified as U. vittatus on BOLD and were re-identified through examination of the associated voucher specimens and/or photographs (electronic vouchers). It is therefore most likely that the two BINs present in U. vittatus correspond to the nominal species and U. suahelicus.
Regarding intraspecific geographic variation, no evidence was found for differences between U. suahelicus populations from the African coast of the WIO proper and the Red Sea. This is in contrast to findings in recent taxonomic accounts of several other Upeneus species (e.g. Uiblein & Heemstra Citation2011a, Citation2011b; Uiblein & Gouws Citation2014). However, as in those previous studies, the sample size for the Red Sea populations was very low. The same also applies here for the differences found among U. supravittatus populations, which could reflect either geographic or size-related effects. The difference in pectoral fin length between the Eastern Indian population and those from the WIO areas is most probably caused by strong positive allometry during late ontogeny. The finding of shorter barbels in the westernmost population of U. supravittatus may, however, indicate geographic differentiation and deserves further study by integration of refined population-genetic methods.
Many goatfish species undergo considerable changes in body form, accompanied by shifts in lifestyle during ontogeny (Uiblein Citation1991, Citation2007; Uiblein & Gledhill Citation2015). The small 72 mm SL specimen of Upeneus vittatus differs only slightly from larger conspecifics in several morphometric characters that have been found to change allometrically in other Upeneus species (e.g. characters related to body depth and eye size; Uiblein & Gouws Citation2014; Uiblein & Gledhill Citation2015). For a basic understanding of body form allometry and associated lifestyle changes in U. vittatus and the suahelicus group species, representative samples of all size classes (including small-sized fish) will need to be obtained from distinct populations.
Genetic analysis
Data from the barcoding mitochondrial gene fragment indicated that Upeneus suahelicus and U. supravittatus formed two separate clades. However, these clades were not well supported and divergence among them was shallow. The mean sequence divergence among the U. suahelicus and U. supravittatus clades was the lowest observed and was substantially lower than most interspecific divergences obtained in the present study, as well as in an earlier study of Upeneus (Uiblein & Gouws Citation2014). This value was also much lower than published mean interspecific values from a number of DNA barcoding surveys of marine fishes (Ward et al. Citation2005; Mabragaña et al. Citation2011; Zhang Citation2011; Weigt et al. Citation2012; Ribeiro et al. Citation2012), including the Mullidae (Lakra et al. Citation2011; Zhang Citation2011; Zhang & Hanner Citation2012). This value was only marginally lower than those obtained in the comparison of U. heemstra and U. tragula in the present study and in Uiblein & Gouws (Citation2014). However, the range of values from individual comparisons among the two clades overlapped with values obtained in the comparison of the latter species. These species were identified and described as distinct taxa on the basis of cumulative genetic evidence (including the extent of sequence divergence), multivariate morphometrics and a combination of taxonomic/morphological characters (Uiblein & Gouws Citation2014). Although the divergence between the U. suahelicus and U. supravittatus clades is low and similar to certain intraspecific divergences, several barcoding studies have revealed equally low divergence values (∼1% or less) among congeneric species pairs (either in terms of the ranges obtained in individual comparisons among specimens or in mean divergence values) (Ward et al. Citation2005; Mabragaña et al. Citation2011; Zhang Citation2011; Zhang & Hanner Citation2012; Weigt et al. Citation2012; Ribeiro et al. Citation2012).
All of the barcoding surveys cited above revealed species to form distinct, cohesive clusters or units (i.e. reciprocally monophyletic clades) and to be characterized by a ‘barcoding gap’ – a notable disparity between divergences among conspecifics and among congeneric species. While U. suahelicus and U. supravittatus superficially form cohesive units, these taxa are not monophyletic as three individuals, representing both species, were placed outside of and in a polytomy with these clades. Moreover, these three individuals shared a single haplotype. The ‘barcoding gap’ between these taxa, excluding these three individuals, was also slight. Species being para- or polyphyletic or sharing haplotypes in barcoding surveys are thought to result from misidentification or mislabelling, hybridization and introgression, pseudogenes, or recent speciation (with the retention of ancestral polymorphism and incomplete lineage sorting) (Ward et al. Citation2005; Hubert et al. Citation2008, Citation2012; Mabragaña et al. Citation2011; Zhang Citation2011).
Misidentification is unlikely in the present case, given the phenotypic distinction among the species, the accuracy of identifications (based on morphology) of those individuals placed within the two clades, and the apparent geographic circumscription of the two taxa. Similarly, hybridization and introgression are unlikely. There were no patterns indicative of introgressive hybridization (Hubert et al. Citation2008) and no evidence of hybridization or introgression involving individuals placed within the two clades; the individuals sharing haplotypes fell outside of these clades. There was also no evidence of pseudogenes, as these protein-coding sequences showed no loss of functionality, or the presence of stop-codons or frame-shifts when translated to amino acids. The placement of this U. supravittatus and the two U. suahelicus individuals in the trees and the central position occupied by the shared haplotype in the parsimony network (which represents an ancestral haplotype and incomplete sorting of the two haplogroups) strongly suggest recent speciation. This is reflected by the sharing of haplotypes, the non-monophyly or incomplete clustering of the two taxa, the shallow divergence among them, and the lack of a clear ‘barcoding gap’. This pattern is a population-genetic phenomenon, whereby, under coalescent theory, haplotypes of recently separated species (aided by potentially large population sizes) coalesce to a most recent common ancestor (the shared ancestral haplotype in this case) that pre-dates the actual speciation event, causing incomplete lineage sorting (Van Velzen et al. Citation2012). This is then reflected in para- or polyphyly and the lack of a ‘barcode gap’ (Van Velzen et al. Citation2012), with shallow divergences between taxa reflecting their recent separation and indicating insufficient time for monophyly to be established (Ward et al. Citation2005; Hubert et al. Citation2008). Such a pattern of haplotypes being shared among morphologically valid species is not uncommon (Hubert et al. Citation2008, Citation2012; Mabragaña et al. Citation2011; Van Velzen et al. Citation2012) and is well documented in reef fishes (Victor Citation2014).
In terms of the specific geographic patterns of intraspecific variation mentioned in the Introduction and the alpha-taxonomic study, the COI data revealed no differentiation between U. suahelicus specimens from the Red Sea and those from the East African coast, and no evidence of differentiation among Western Indonesian and WIO specimens of U. vittatus, as well as no differentiation within the WIO proper for either species. Indeed, no species included in the current study showed evidence of a geographic genetic structure (at least in terms of the samples included and marker used).
Both the reconstructed trees and the extent of sequence divergences indicate that U. vittatus is well differentiated from both U. suahelicus and U. supravittatus. This supports the clear phenotypic distinction of this taxon. Cladistic analyses revealed a closer, sister-taxon relationship among U. quadrilineatus and U. suahelicus + U. supravittatus, with U. vittatus sister to this larger clade. Furthermore, the analyses suggest that very few of the morphological groups established by Uiblein & Heemstra (Citation2010) and Uiblein & Causse (Citation2013) – to facilitate morphological comparisons among Upeneus species – are monophyletic, suggestive of evolutionary relationships, or valid species complexes. Based on the barcoding data, the vittatus group appears as both para- and polyphyletic, with U. quadrilineatus (moluccensis group) nested among U. suahelicus, U. supravittatus and U. vittatus, and with U. parvus appearing basally in the phylogeny. This clearly substantiates the results of the present alpha-taxonomic study and supports the removal of U. suahelicus and U. supravittatus (U. indicus is still pending a genetic study) from the vittatus group. Similarly, the moluccensis group (represented here by U. moluccensis and U. sulphureus) and the tragula group (represented by U. heemstra, U. margarethae and U. tragula) appear to be polyphyletic. However, these results must be regarded as preliminary, as support for many relationships was low and these remain to be tested with more complete taxonomic representation and additional data (both genetic and phenotypic).
Conclusions
This comprehensive phenotypic and genetic approach integrates alpha-taxonomy and barcoding in a mutually beneficial way to better understand distinction and relatedness among species of the genus Upeneus. While alpha-taxonomy elaborates similarity based on a large comparative data set, barcoding explores evolutionary distances towards (re-)assembling species into phenotypically and genetically coherent units. While only a relatively small number of species were targeted here, this approach could also be applied to the other species groups and species. It will also be important to fully uncover the diversity within the newly formed groups, interspecifically and intraspecifically, phenotypically and genetically, so as to arrive at a more thorough understanding of overall diversity and evolutionary differentiation in speciose genera like Upeneus.
Supplementary material (Tables SI–SIII)
The supplementary material for this article is available via the Supplemental tab of the article's online page at http://dx.doi.org/10.1080/17451000.2015.1064963.
Editorial responsibility: Sharon Appleyard
Supplementary Tables SI-SIII
Download MS Word (298 KB)Acknowledgements
We thank the following colleagues for hospitality and assistance during visits to collections or for providing other collection-related favours: James Maclaine (BMNH); Arnold Suzumoto, Jack Randall and Lori OHara (BPBM); Alastair Graham, Will White, Daniel Gledhill, Carlie Devine, Peter Last, John Pogonoski and Robert Ward (CSIRO); Peter Psomadakis (FAO); Rupert Wienerroither (HIFIRE); Daniel Golani (HUJ); Thomas Razafimanambina (IH.SM); Philippe Bouchet, Romain Causse and Patrice Pruvost (MNHN); Renny Hadiaty (MZB); Sven Kullander and Erik Åhlander (NRM); Roger Bills, Bafo Konobe, Mark Lisher and the SAIAB National Fish Collection staff, Elaine and Phil Heemstra, Alan Whitfield, Wouter Holleman, and Monica Mwale (all SAIAB); Michael Bougaardt & Dylan Clarke (SAM); Tilman Alpermann, Friedhelm Krupp and Horst Zetzsche (SMF); Jeff Williams and the USNM collection staff; Peter Møller, Jørgen Nielsen, Marcus Krag and Tammes Menne (ZMUC); Sergey Bogorodsky (Omsk), Allan Connell (Durban), Dimitri Pavlov (Moscow) and Pako Uiblein (Vienna); and the Atimo Vatae scientific expedition to Madagascar in 2010 (http://www.ifremer.fr/sismer/UK/catal/campagne/campagnea.htql?crno=10110040). For photographs of fresh fish and/or assistance with compiling the colour plate we thank Carlie Devine, Phil and Elaine Heemstra, and Jack Randall. We gratefully acknowledge CSIRO Australia and the SMF Frankfurt, for access to and the use of unpublished or unreleased barcoding data, and thank Bob Ward, Will White, Alastair Graham and Tilman Alpermann for their assistance in this regard.
Disclosure statement
No potential conflict of interest was reported by the authors.
ORCID
Franz Uiblein http://orcid.org/0000-0002-5642-0384
Additional information
Funding
References
- Akaike H. 1974. A new look at the statistical model identification. IEEE Transactions on Automatic Control 19:716–23. doi: 10.1109/TAC.1974.1100705
- Bhargava AK, Gulati DK, Varghese S, Uikey DE, Mali KS. 2004. Field Guide for Identification of Marine Fisheries Resources. Mumbai: Fishery Survey of India. 71 pages.
- Blegvad H, Løppenthin B. 1944. Fishes of the Iranian Gulf. Danish Scientific Investigations in Iran. Copenhagen: Einar Munksgaard. 247 pages.
- Boldsystems. 2015. The Barcode of Life Systems. http://www.boldsystems.org (accessed 18 June 2015).
- Clement M, Posada D, Crandall KA. 2000. TCS: A computer program to estimate gene genealogies. Molecular Ecology 9:1657–60. doi: 10.1046/j.1365-294x.2000.01020.x
- Darriba D, Taboada GL, Doallo R, Posada D. 2012. jModelTest 2: More models, new heuristics and parallel computing. Nature Methods 9:772. doi: 10.1038/nmeth.2109
- Eschmeyer WN, editor. 2015. Catalog of Fishes: Genera, Species, References. http://research.calacademy.org/research/ichthyology/catalog/fishcatmain.asp (accessed 23 January 2015).
- Felsenstein J. 1985. Confidence limits on phylogenies: An approach using the bootstrap. Evolution 39:783–91. doi: 10.2307/2408678
- Froese R, Pauly D, editors. 2015. FishBase. World Wide Web Electronic Publication. www.fishbase.org (accessed April 2015).
- Hasegawa M, Kishino K, Yano T. 1985. Dating the human-ape splitting by a molecular clock of mitochondrial DNA. Journal of Molecular Evolution 22:160–74. doi: 10.1007/BF02101694
- Hebert PDN, Cywinska A, Ball SL, DeWaart JR. 2003. Biological identifications through DNA barcodes. Proceedings of the Royal Society B 270:313–21. doi: 10.1098/rspb.2002.2218
- Hubert N, Hanner R, Holm E, Mandrak NE, Taylor E, Burridge M, et al 2008. Identifying Canadian freshwater fishes through DNA barcodes. PLoS One 3:e2490. 8 pages. doi: 10.1371/journal.pone.0002490
- Hubert N, Meyer CP, Bruggemann HJ, Guérin F, Komeno RJL, Espiau B, et al. 2012. Cryptic diversity in Indo-Pacific coral-reef fishes revealed by DNA-barcoding provides new support to the Centre-of-Overlap hypothesis. PLoS One 7:e28987. 8 pages. doi: 10.1371/journal.pone.0028987
- Jones S, Kumaran M. 1980. Fishes of the Laccadive Archipelago. Cochin, India: Mathrubhumi Press. 760 pages.
- Khedkar GD, Jamdade R, Naik S, David L, Haymer D. 2014. DNA barcodes for the fishes of the Narmada, one of India's longest rivers. PLoS One 9:e101460. 10 pages. doi: 10.1371/journal.pone.0101460
- Kimura M. 1980. A simple method for estimating evolutionary rates of base substitutions through comparative studies of nucleotide sequences. Journal of Molecular Evolution 16:111–20. doi: 10.1007/BF01731581
- Kumaran B, Kambala SN, Nadarajan J. 2012. Assessment of ichthyo-faunal diversity in Giriyampeta Estuary, Yanam (U.T.of Puducherry). Bulletin of Environment, Pharmacology and Life Sciences 1:17–25.
- Lakra WS, Verma MS, Goswami M, Lal KK, Mohindra V, Punia P, et al. 2011. DNA barcoding of Indian marine fishes. Molecular Ecology Resources 11:60–71. doi: 10.1111/j.1755-0998.2010.02894.x
- Larkin MA, Blackshields G, Brown NP, Chenna R, McGettigan PA, McWilliam H, et al. 2007. Clustal W and Clustal X version 2.0. Bioinformatics 23:2947–48. doi: 10.1093/bioinformatics/btm404
- Mabragaña E, Díaz de Astarloa JM, Hanner R, Zhang J, González Castro M. 2011. DNA barcoding identifies Argentine fishes from marine and brackish waters. PLoS One 6:e28655. 11 pages. doi: 10.1371/journal.pone.0028655
- Rajan PT, Sreeraj CR, Immanuel T. 2012. The goatfishes (family Mullidae) of Andaman and Nicobar Islands. Records of the Zoological Survey of India 111:35–48.
- Rajkumar U. 2004. Fishery and some aspects of population dynamics of goatfish Upeneus vittatus (Forskal) off Visakhapatnam. Journal of the Marine Biological Association of India 46:192–97.
- Rambaut A, Drummond AJ. 2009. Tracer version 1.5. http://beast.bio.ed.ac.uk (accessed 5 March 2015). Computer program.
- Ratnasingham S, Hebert PDN. 2013. A DNA-based registry for all animal species: The Barcode Index Number (BIN) system. PLoS One 8:e66213. 16 pages. doi: 10.1371/journal.pone.0066213
- Ribeiro AD, Caires RA, Mariguela TC, Pereira LHG, Hanner R, Oliveira C. 2012. DNA barcodes identify marine fishes of São Paulo State, Brazil. Molecular Ecology Resources 12:1012–20. doi: 10.1111/1755-0998.12007
- Ronquist F, Huelsenbeck JP. 2003. MrBayes 3: Bayesian phylogenetic inference under mixed models. Bioinformatics 19:1572–74. doi: 10.1093/bioinformatics/btg180
- Sluka RD. 2013. Coastal marine fish biodiversity along the western coast of India. Journal of Threatened Taxa 5:3574–79. doi: 10.11609/JoTT.o3187.118
- Swofford DL. 2002. PAUP*. Phylogenetic Analysis Using Parsimony (*and Other Methods). Version 4. Sunderland, MA: Sinauer Associates. Computer program.
- Uiblein F. 1991. Ontogenetic shifts in resource use and shoaling tendency related to body size in Red Sea goatfish (Parupeneus forsskali, Mullidae). Marine Ecology 12:153–61. doi: 10.1111/j.1439-0485.1991.tb00249.x
- Uiblein F. 2007. Goatfishes (Mullidae) as indicators in tropical and temperate coastal habitat monitoring and management. Marine Biology Research 3:265–88. doi: 10.1080/17451000701687129
- Uiblein F, Causse R. 2013. A new deep-water goatfish of the genus Upeneus (Mullidae) from Vanuatu, South Pacific. Zootaxa 3666:337–44. doi: 10.11646/zootaxa.3666.3.4
- Uiblein F, Gledhill D. 2015. A new goatfish of the genus Upeneus (Mullidae) from Australia and Vanuatu, with inter- and intraspecific comparisons. Marine Biology Research 11:475–91. doi: 10.1080/17451000.2014.958088
- Uiblein F, Gouws G. 2014. A new goatfish species of the genus Upeneus (Mullidae) based on molecular and morphological screening and subsequent taxonomic analysis. Marine Biology Research 10:655–81. doi: 10.1080/17451000.2013.850515
- Uiblein F, Heemstra PC. 2010. A taxonomic review of the Western Indian goatfishes of the genus Upeneus (family Mullidae), with descriptions of four new species. Smithiana Bulletin 11:35–71.
- Uiblein F, Heemstra PC. 2011a. A new goatfish, Upeneus seychellensis sp. nov. (Mullidae), from the Seychelles Bank, with remarks on Upeneus guttatus and a key to Western Indian Ocean Upeneus species. Marine Biology Research 7:637–50. doi: 10.1080/17451000.2010.547202
- Uiblein F, Heemstra PC. 2011b. Description of a new goatfish species, Upeneus randalli n. sp. (Mullidae), from the Persian Gulf, with remarks and identification keys for the genus Upeneus. Scientia Marina 75:585–94. doi: 10.3989/scimar.2011.75n3585
- Uiblein F, McGrouther M. 2012. A new deep-water goatfish of the genus Upeneus (Mullidae) from northern Australia and the Philippines, with a taxonomic account of U. subvittatus and remarks on U. mascareinsis. Zootaxa 3550:61–70.
- Uiblein F, White WT. 2015. A new goatfish of the genus Upeneus (Mullidae) from Lombok, Indonesia and first verified record of U. asymmetricus for the Indian Ocean. Zootaxa 3980:51–66.
- Van Velzen R, Weitschek E, Felici G, Bakker FT. 2012. DNA barcoding of recently diverged species: relative performance of matching methods. PLoS One 7:e30490. 12 pages. doi: 10.1371/journal.pone.0030490
- Victor BC. 2014. Three new endemic cryptic species revealed by DNA barcoding of the gobies of the Cayman Islands (Teleostei: Gobiidae). Journal of the Ocean Science Foundation 12:25–60.
- Ward RD, Zemlak TS, Innes BH, Last PR, Hebert PDN. 2005. DNA barcoding Australia's fish species. Philosophical Transactions of the Royal Society B 360:1847–57. doi: 10.1098/rstb.2005.1716
- Weigt LA, Baldwin CC, Driskell A, Smith DG, Ormos A, Reyier EA. 2012. Using DNA barcoding to assess Caribbean reef fish biodiversity: Expanding taxonomic and geographic coverage. PLoS One 7:e41059. 7 pages. doi: 10.1371/journal.pone.0041059
- Zhang J. 2011. Species identification of marine fishes in China with DNA barcoding. Evidence-Based Complementary and Alternative Medicine 978253:1–10.
- Zhang J, Hanner R. 2012. Molecular approach to the identification of fish in the South China Sea. PLoS One 7:e30621. 9 pages. doi: 10.1371/journal.pone.0030621