
ABSTRACT
Zooplankton is a vital component in the pelagic marine ecosystems, linking lower to higher trophic levels. A survey was conducted with R/V Dr. Fridtjof Nansen in Sri Lankan waters in summer 2018 to explore zooplankton dynamics in relation to abiotic and biotic variables. A distinct pattern in physical and biological properties characterized Sri Lankan waters into two ecosystems: (1) low production, high temperature, and low salinity in the east, and (2) high production, low temperature, and high salinity in the west. The highest mean abundance (1931 ind. m−3) and biomass (1.79 g dry wt. m−2) of zooplankton were significantly associated with cooler, high saline, and more productive waters in the North West and South West. In general, zooplankton were significantly more abundant in the west (1841 ind. m−3) than the east (707 ind. m−3). The most abundant copepod families were Paracalanidae (20.4%) and Tachidiidae (10.2%). The copepod Paracalanus parvus was the most dominant species. Our study reveals that temperature is a key driver explaining 67% of the variance in zooplankton biomass in this region. This study provides novel baseline results on spatial patterns of zooplankton abundance, biomass, and species composition from an understudied region of the north central Indian Ocean.
Introduction
Zooplankton is a key player in pelagic marine ecosystems particularly as prey for shellfish, fish, marine mammals and seabirds. In addition, zooplankton waste products are also of importance for the vertical flux of organic matter. The sediment matter fuels the benthic community (Maar Citation2003), thus, zooplankton occupies a key position in shaping the pelagic system and coupling of pelagic and benthic food webs.
Sri Lanka lies within the equatorial belt of the northern Indian Ocean, with the Arabian Sea on its west and the Bay of Bengal on its east sides (de Vos et al. Citation2014; Hood et al. Citation2017). The island experiences bi-annually reversing monsoon winds (de Vos et al. Citation2014; Hood et al. Citation2017) that act as the major physical driver for coastal and open-ocean upwelling (Sreeush et al. Citation2018). The physical and biological processes and their variability in upwelling regions are inseparably tied to the strength of the monsoon winds and associated nutrient dynamics (Sreeush et al. Citation2018). Off the southern coast of Sri Lanka, seasonal reversals in the boundary currents are associated with dramatic variations in the intensity of coastal upwelling, chlorophyll a (Chl a) concentration and catch per unit effort of fishes (Hood et al. Citation2017). The surface ocean currents in the region follow the monsoon patterns; during the southwest monsoon (June to October), the eastward flowing South Monsoon Current (SMC) brings high salinity, productive Arabian Sea waters into the Bay of Bengal (Tomczak and Godfrey Citation1994; Hood et al. Citation2009). In contrast, during the northeast monsoon (December to April), the westward flowing northeast Monsoon Current (NMC) brings warm and low salinity water to the Arabian Sea from the Bay of Bengal (Wyrtki Citation1973; Krakstad et al. Citation2018).
Only sporadic zooplankton studies at varying temporal and spatial scales have been conducted in Sri Lankan and adjacent waters of the Indian Ocean (Nair et al. Citation1981; Jayasiri Citation2007; Jitlang et al. Citation2008; Pitchaikani and Lipton Citation2015; Lathasumathi et al. Citation2017). Compared with other oceans, the Indian Ocean is one of the least studied marine regions, hence, an urgent need for further research efforts has recently been stressed (Hood et al. Citation2009). Particularly, plankton and larval fish dynamics from the central Indian Ocean, in Sri Lankan waters, are poorly known (Krakstad et al. Citation2018). Furthermore, different sampling gears, methods, and mesh sizes were used in most of these studies, hence, the abundances are not directly comparable.
The plankton data sets used in this study are unique, as no similar ecosystem surveys have been conducted previously in this region of the Indian Ocean. In addition to survey observations, we have used satellite data on Chl a as a proxy for phytoplankton biomass to study seasonal patterns, particularly related to the two monsoon periods. We explored a variety of physical (temperature, salinity, oxygen) and biological (Chl a) data gathered during the survey that were hypothesized to be the main drivers of zooplankton abundance and distribution in waters off Sri Lanka. The objectives of this study were to investigate: (1) spatial patterns in temperature, salinity, oxygen, and Chl a; (2) seasonal dynamics in Chl a; (3) spatial distribution patterns and abundance in zooplankton biomass; and (4) assess the role of physical and biological processes in structuring zooplankton abundance biomass, and composition in Sri Lankan waters.
Materials and methods
Study area
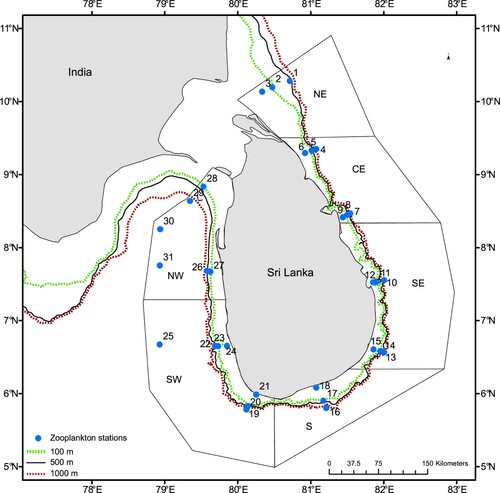
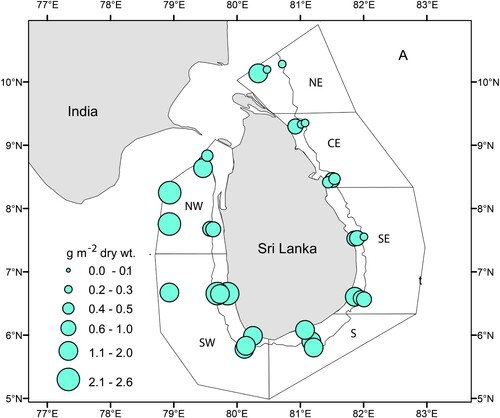
An ecosystem survey was conducted by R/V Dr. Fridtjof Nansen in waters off Sri Lanka (located between latitudes 5°24′ and 10°23′ N and longitudes 78°55′ and 82°25′ E) from 24 June to 16 July 2018, during the southwest monsoon period. There is a relatively narrow continental shelf and a steep slope in most regions off Sri Lanka, except Palk Bay, the Gulf of Mannar, and the Pedro Bank (see for locations). In this paper, the east was defined as North East (NE), Central East (CE), and South East (SE) whereas the west included South (S), South West (SW), and North West (NW) regions. Except for a few stations in the NW region, the sampling stations were in transects perpendicular to the coastline varying from 20 m to above 1000 m depth.
Figure 1. Sampling locations of zooplankton stations by R/V Dr. Fridtjof Nansen survey between 24 June and 16 July 2018 around Sri Lanka. NE = North East, CE = Central East, SE = South East, S = South, SW = South West, NW = North West. Station numbers 1–31 are running station numbers. See Table SI for corresponding survey station numbers. The solid line at 500 m depth contour delineates the shelf and deep-water polygons. The green and red dotted lines show the 100 m and 1000 depth contours respectively.
Remote sensing data – Chl a
Satellite-derived surface Chl a concentrations (mg m−3) (Level 3, 8 days binned, reprocessing version R2018.0) based on MODIS-Aqua sensor (https://doi.org//10.5067/AQUA/MODIS/L3B/CHL/2018) were processed at the Department of Earth System Science, Stanford University, USA. The mean, standard deviation and number of all valid pixels of Chl a for each of the six regions () were calculated for 2016–2018 using monthly level 3 binned images. We used data from three years adjacent to the survey period to explore the consistency of seasonal patterns. A Chl a composite for the survey period was generated from daily level-3 images.
Temperature, salinity, oxygen, and Chl a measurements
A shipboard conductivity, temperature and depth profiler (CTD) (Sea Bird Inc. 19+), along with an oxygen sensor and a fluorometer attached to a 12-bottle rosette system were used to measure vertical distributions of temperature, salinity, oxygen, and fluorescence in the waters around Sri Lanka (Krakstad et al. Citation2018). The CTD was equipped with dual temperature and conductivity sensors to obtain data with high precision along with a Chelsea AQUATracka III fluorometer. In situ Chl a measurements (mg m−3) from the fluorometer sensor were obtained based on estimations made onboard (Krakstad et al. Citation2018).
Zooplankton sampling
Mesozooplankton (generally organisms between 0.2 and 20.0 mm) samples were collected with a WP2 ring net at sampling depth intervals close to 30–0 m, 100–0 m, and 200–0 m respectively, corresponding to bottom depths of ∼30 m, ∼100 m, and ∼1000 m (). In addition, samples were taken from ∼30 m depth to the surface at the deeper waters (100 and 1000 m) to enable a direct comparison of the zooplankton composition and concentrations in the uppermost 30 m layer of the water column. The WP2 net (diameter: 56 cm, mesh size: 180 µm) was hauled vertically at a speed of ∼0.5 m s−1 at each station.
Zooplankton biomass estimation and taxonomic identification
Each zooplankton sample was divided into two equal halves using a Motoda plankton splitter (Motoda Citation1959). One half of the sample was size fractioned successively by using three sieves with the decreasing mesh-sizes of 2000, 1000, and 180 µm. The content on each screen was briefly rinsed with fresh water to remove salt and transferred to pre-weighed aluminium trays before it was dried at 60 °C for 24 h and frozen on board. The samples were later dried once more and weighed at the plankton laboratory at the Institute of Marine Research (IMR), Norway, for obtaining biomass estimates for the different size groups. The volume filtered was estimated from tow length and mouth opening area of the net, assuming 100% filtration efficiency. The integrated biomass over the sampled water column was calculated by using the area (net mouth opening) combined with volume filtered and expressed as g dry wt. m−2 and g dry wt. m−3 respectively. The zooplankton integrated biomass from bottom to surface (g dry wt. m−2) was used to monitor biomass distribution patterns whereas biomass per volume filtered (g dry wt. m−3) was obtained to compare values in different areas/water masses.
The other half of the sample was preserved in seawater with a final solution of 4% formaldehyde buffered with borax for subsequent species identification and quantification, using an Optika light microscope at the NARA laboratory, Sri Lanka. Existing tropical zooplankton identification guides by Conway et al. (Citation2003) and Razouls et al. (Citation2005) were used for species identification. Based on the total counts made on the preserved samples, abundance was expressed as ind. m−3. The contribution from different families/species to total abundance was segregated to obtain more detailed information on percentage contribution of each of the categories to the total abundance.
Data analyses
Maps in this study were created using ArcGIS and MATLAB software. A non-parametric Mann–Whitney test (Zar Citation1999) was used to explore for differences in the abiotic and biotic factors in the east and west. Correlation analysis was performed between the response variable zooplankton biomass (g dry wt. m−3) and explanatory variables (temperature, salinity, oxygen, and Chl a) in the upper ∼30 m to test their significance; We hypothesize that these variables are key drivers structuring the zooplankton biomass in the north central Indian Ocean.
We used principal component analysis (PCA; Legendre and Legendre Citation2012) to explore how regions/polygons were related to the biotic (Chl a, zooplankton biomass/abundance) and abiotic (temperature, salinity, oxygen and bottom depth) variables. The PCA was performed with the software R v. 3.6.2 (R Core Team Citation2018) and applying the function ‘prcomp’. As the variables were on different scales, PCA was run on the correlation matrix, which is equivalent to standardizing the variables to mean zero and standard deviation one.
Results
Environmental variables
Results from the current study showed that temperature and salinity distributions clearly varied between east and west regions off Sri Lanka (). When considering polygon wise, temperature, salinity, and oxygen distribution in the upper 30 m showed that the east side is much warmer (NE, CE, SE), less saline, and has slightly higher oxygen concentrations than the west (S, SW, NW; ). The east coast of Sri Lanka borders the Bay of Bengal, which is warmer (∼29 °C) than the Arabian Sea to the west (∼27 °C). The South polygon (S) had the lowest temperature. The profoundly cooler signal in the upper ∼30 m in the south region indicates coastal upwelling during the southwest monsoon.
Figure 2. Temperature (°C) (a) and salinity distributions (b) in the upper 30 m between 24 June and 16 July 2018 in Sri Lankan waters.
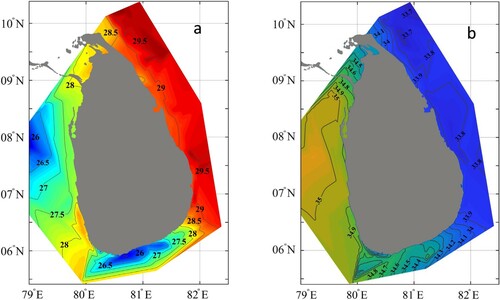
Figure 3. In situ temperature (°C), salinity, and oxygen (ml L−1) distribution (0–25 m) in different polygon regions. NE = North East, CE = Central East, SE = South East, S = South, SW = South West, and NW = North West. The error bars show standard deviation. See Table S1 for more details. See for locations.
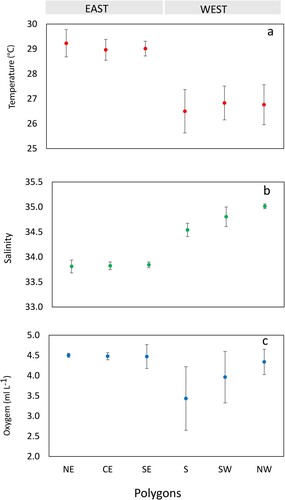
The salinity profiles showed the opposite pattern, with low salinity water (∼34) in the east and high salinity water to the west (35) at 0–25 (). The oxygen concentrations at the surface were relatively uniform (4.0–5.0 ml L−1) around Sri Lanka, except in coastal waters in the south region, which had less oxygenated waters. The physical properties seemed to divide Sri Lankan waters into two main regions, the east with high temperatures, low salinity and somewhat higher oxygenated waters at 0–25 m and the west with lower temperature and more saline waters ( and ). The Mann–Whitney test showed that the average temperature in the east was significantly higher (W = 36, P = 0.002), while salinity was significantly lower (W = 0, P = 0.002) than in the west. The oxygen levels between east and west were not significantly different (W = 30, P = 0.064) with east having more stable conditions than the west.
Spatial distribution patterns and seasonal dynamics of Chl a
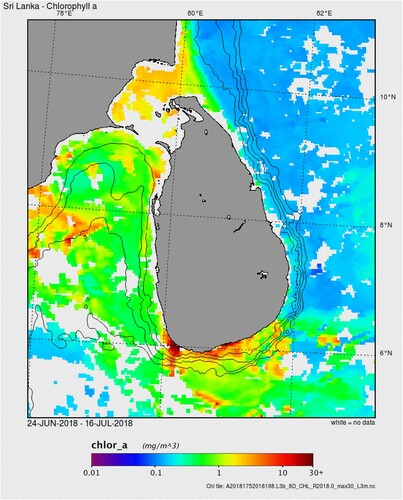
Remote sensing data, providing high spatial and temporal resolution, were used to explore the variability in mean surface Chl a distribution in Sri Lankan waters. Satellite data during the survey period (24 June to 16 July 2018) showed that there was large spatial variability in Chl a (). East Sri Lankan waters had very low Chl a concentration (<0.4 mg m−3) compared with the south and west coastal regions (3.3 and 2.8 mg m−3, respectively). The lowest value (0.1 mg m−3) was observed in the North East deep regions. Mann–Whitney test showed that in situ Chl a values in the west were significantly higher than in the east (W = 3, P = 0.015).
Figure 4. Spatial distribution patterns of Chl a (mg m −3) (satellite data) in Sri Lankan waters between 24 June and 16 July 2018. Isobaths are shown for 100, 1000, 2000, and 3000 m respectively from inner to outer contours.
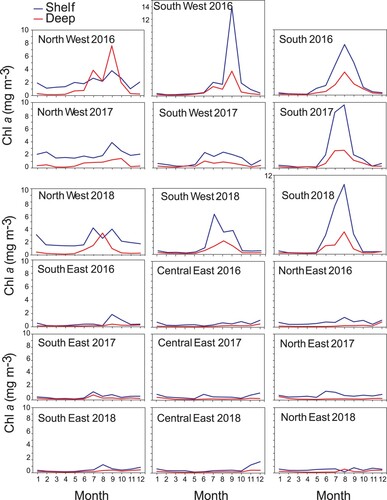
Satellite based monthly mean Chl a concentrations for 2016, 2017, and 2018 for each of the six main regions were used to explore the spatial differences in seasonal phytoplankton dynamics off Sri Lanka (). There was a distinct pattern of Chl a concentration dividing Sri Lankan waters into two regions: a region of low phytoplankton biomass in the South East, Central East, and North East and a region of high phytoplankton biomass in the South, South West and North West. Furthermore, seasonal patterns in Chl a revealed that in general, the shelf area had higher Chl a concentrations and higher spatial variability. The South East, Central East, and North East regions showed no distinct seasonal pattern in Chl a in the off-shelf areas. In the shelf areas, there was some temporal variability, with a tendency for Chl a to increase in the June–August period. In the South West (SW), a clear seasonal pattern was evident, with peak Chl a in September 2016. Although this pattern was less clear in 2017, it appeared again in 2018. Among all regions explored, the South (S) showed distinct seasonal dynamics both on the shelf and off the shelf, with a phytoplankton bloom during July–September and peak Chl a concentration in August 2018. This peak coincided with the south-west monsoon, a key driver of the biological productivity in the region. We also observed heavy blooms in the southern regions off Sri Lanka during our survey in July 2018 (). In the North West (NW), less distinct seasonal dynamics were observed, especially in the shelf regions, compared with other western regions. One striking feature was the rather low Chl a concentration (<2 mg m−3) in the east zone off Sri Lanka during both southwest (June–September) and northeast (December–March) monsoon periods.
Figure 5. Seasonal dynamics of Chl a (mg m−3) (satellite data) in different polygons in Sri Lankan waters during 2016–2018. See for locations. Note different scales on y-axis.
Zooplankton biomass and abundance
Total biomass
Zooplankton biomass showed large spatial variability in waters around Sri Lanka (, Tables SI and SII). High zooplankton biomass was observed in the west regions whereas along the east coast, the biomass was significantly lower (W = 1, P = 0.004, N = 31). In the 30–0 m samples (, Table SI), the lowest biomass (0.110 g dry wt. m−2 or 0.004 g dry wt. m−3) was recorded in off-shelf waters of the Central East polygon and the highest (2.634 g dry wt. m−2 or 0.094 g dry wt. m−3) was recorded in shelf waters on the South West shelf. The average biomass in the 30–0 m samples was 0.020 g dry wt. m−3 in the east region and 0.051 g dry wt. m−3 in the south and west regions.
Figure 6. Zooplankton biomass (g dry wt. m−2) in the upper 30 m depth based on in situ data collected from WP2 net in Sri Lankan waters. See Table S1 for more details.
A limited number of samples was taken between 100 and 0 m. However, these also showed a similar distribution pattern with higher biomass in the west and south regions compared with the east (, Table SI). Furthermore, the 200–0 m samples also revealed higher biomass in the west and south regions (average 0.016 g dry wt. m−3) than in the east region (0.007 g dry wt. m−3). The biomass distributions indicate that production was low in the east region off Sri Lanka while high production areas were restricted to the south and west regions.
For most transects, the shelf water stations showed a higher zooplankton biomass (g dry wt. m−3) than off-shelf stations. The mean biomass in the upper 30 m was significantly higher than that from the deeper hauls, indicating that a substantial part of the zooplankton population was distributed close to the surface and near the coastal areas off Sri Lanka.
Biomass of size fractions
The highest mean biomass values were recorded in SW region and the lowest in the CE region (a). The biomass fraction (>2000 µm) which represents larger-size zooplankton was highest in NW area (0.248 g dry wt. m−2) followed by S region (0.243 g dry wt. m−2). It is noteworthy that the biomass of larger zooplankton (>2000 µm) fraction was completely absent in NE and CE regions (b).
Figure 7. Zooplankton biomass (g dry wt. m−2) in the upper 30 m at different regions: NE = North East, CE = Central East, SE = South East, S = South, SW = South West, and NW = North West. (a) Total, (b) >2000, (c) 1000–2000, (d) 180–1000 µm. The vertical bars show Standard error. Note that scales are different on y-axis. See for locations.
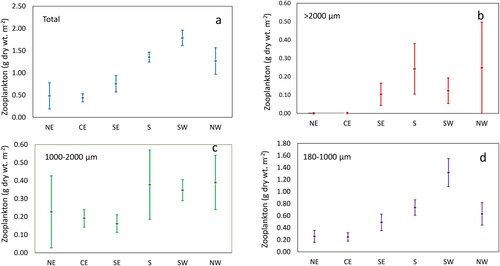
The 1000–2000 µm biomass fraction showed high biomasses in S, SW and NW regions (0.378, 0.347, and 0.390 g dry wt. m−2 respectively) while low biomasses were recorded in NE, CE and SE regions (0.227, 0.191 and 0.162 g dry wt. m−2 respectively) (; Table SII). The smallest biomass fraction (180–1000 µm) indicated high biomass in SW (1.316 g dry wt. m−2) and lowest values in CE (0.246 g dry wt. m−2, d). The zooplankton biomass data clearly indicated that the upper 30 m of the Sri Lankan waters was dominated by smaller zooplankton (180–1000 µm) species (; Tables SI and SII).
Zooplankton abundance
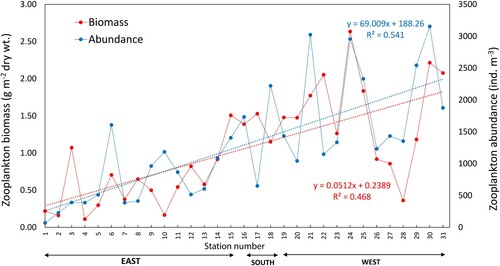
Zooplankton abundance showed a very similar pattern as the biomass (). Mann–Whitney test showed that both biomass and abundance were significantly different between west and east, with the west region having higher biomass and abundance than the east (P < 0.01). Region wise comparison showed that the lowest mean abundance (229 ind. m−3) was recorded in the NE whereas the highest (1931 ind. m−3) was observed in the NW (Table SII). In the regions CE (711 ind. m−3) and SE (944 ind. m−3), the mean abundances were lower than in the S (1534 ind. m−3) and SW (1895 ind. m−3) (Table SII). The trend lines in showed an increase when moving from the east to the west except for three stations from NW (two shelf and one deep station). The increase in both biomass and abundance observed in this study are statistically significant (P < 0.01).
Figure 8. Station wise variation of zooplankton abundance (ind. m−3) and biomass (g dry wt. m−2) in the upper 30 m between 24 June and 16 July 2018 in Sri Lankan waters. See Table SI for corresponding survey station numbers and polygons.
Zooplankton composition
In this study we observed 28 Copepod families. Most of the copepods (∼80%) belonged to 10 families (Paracalanidae, Tachidiidae, Subeucalanidae, Oncaeidae, Oithonidae, Corycaeidae, Clausocalanidae, Acartiidae, Calocalanidae, and Pontellidae). The contribution of copepod to the mean total zooplankton abundance varied from 72–90% in the six different regions with the lowest observed in the NE and highest in NW. The most abundant families, in descending order were Paracalanidae, Tachidiidae, and Subeucalanidae (). Copepods belonging to the family Paracalanidae were abundant in all regions with highest abundance in the SE region and lowest in the NE. The Tachidiidae copepods were abundant in the SW and NW regions, while they were completely absent in the NE and CE. Highest abundance of Subeucalanidae family was observed in the NW and lowest in the NE (). In the NE region, the most abundant zooplankton species were appendicularian Oikopleura dioica (30 ind. m−3) and copepod Paracalanus parvus (23 ind. m−3) (). The dominating zooplankton in the CE region was Paracalanus spp. (85 ind. m−3) followed by salps (44 ind. m−3). In the CE, the density of the foraminiferan Globigerina spp. (18 ind. m−3) was notably higher than in other regions. In the SE region, O. dioica showed the highest abundance (107 ind. m−3).
Figure 9. Most dominant zooplankton abundance at family level in each of the six regions in Sri Lankan waters: NE = North East, CE = Central East, SE = South East, S = South, SW = South West, and NW = North West. See for locations.
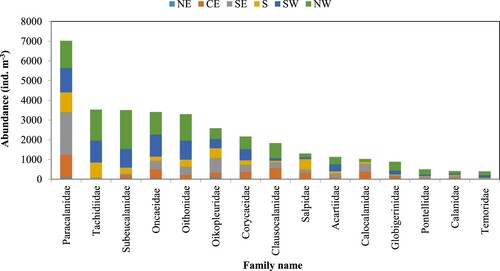
Table I. Most abundant zooplankton groups and species in the upper 30 m in Sri Lankan waters between 24 June and 16 July 2018.
The abundances of the copepod Euterpina acutifrons were high both in the S (188 ind. m−3) and SW (185 ind. m−3) regions followed by Paracalanus spp. (182 and 110 ind. m−3 respectively). In the NW region, Subeucalanus spp. (432 ind. m−3) was the highest abundant zooplankton species (, Figure S1). Results from the present study showed that in general, copepods were more abundant in the west (S, SW, NW) than in the east (NE, CE, SE).
Correlations between zooplankton biomass and biotic and abiotic variables
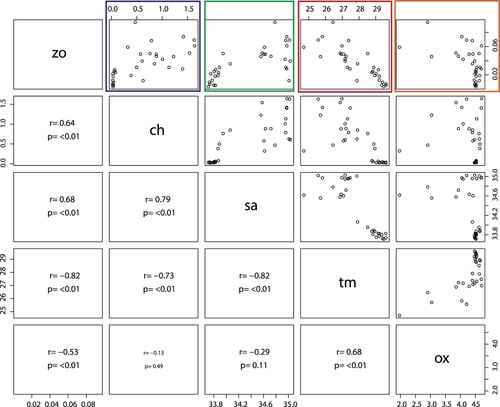
Zooplankton biomass (g dry wt. m−3) was significantly negatively correlated with temperature (P < 0.001, R2 = 0.67, – red box) with temperature explaining ∼67% of the variability of the biomass in Sri Lankan waters (). A positive correlation was seen between zooplankton biomass and Chl a concentration (P < 0.001, R2 = 0.41; – blue box) indicating that high biomasses are associated with high primary production (high Chl a concentrations) areas. Furthermore, zooplankton biomass was positively significantly correlated with salinity (P < 0.001, R2 = 0.46; – green box) and negatively correlated with oxygen though with low explanatory power (P < 0.001, R2 = 0.28 – orange box).
Figure 10. Correlation analysis between the explanatory variables (main drivers) of the zo (zooplankton biomass g dry wt. m−3), ch (in situ chlorophyll a mg m−3), sa (salinity) tm (temperature °C), and ox (oxygen ml L−1) in the upper 25 m. r = coefficient of correlation; P = probability.
Principal component analysis
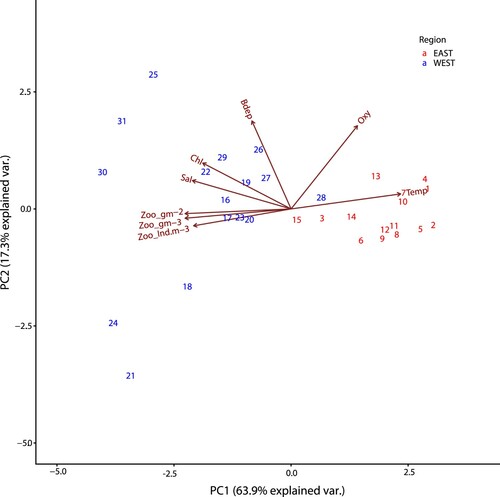
The PC1 and PC2 axes explained ∼81% of the variance in the data set across stations (). The PCA showed a clear separation of eastern and western stations along the PC1 axis, which explains most of the variance (∼63.9%). Increasing PC1 scores are associated with decreasing salinity (Sal) and increasing temperature (Temp). We find that eastern stations are associated with warmer, less saline waters on the right-hand side of the PCA biplot (in red). The western stations are characterized by cooler, more saline, less oxygenated (Oxy) waters with higher Chl a (Chl) concentrations and high zooplankton productivity (Zoo g m−2, Zoo_g m−3, Zoo_ind. m−3) and are found on the left-hand side of the biplot (in blue). Increasing PC2 scores (∼17.3%) are mostly associated with bottom depth (Bdep), and is likely driven by very deep stations 25, 30 and 31 (>1500 m) ().
Figure 11. PCA biplot for zooplankton biomass (Zoo_g m−2 and Zoo_g m−3), zooplankton abundance (Zoo_Ind.m−3), Chl a (Chl), salinity (Sal), oxygen (Oxy), bottom depth (Bdep), and temperature (Temp).
Discussion
Regional differences in oceanographic conditions
Environmental parameters such as temperature and salinity in pertinent levels are important provisions for marine life. These parameters do not merely provide a suitable living environment, but also facilitate important marine processes to support the sustenance of different categories of marine life, particularly plankton.
Our study showed a significant variation in temperature and salinity among different regions in Sri Lankan waters. We observed a distinct pattern in physical properties characterizing Sri Lankan waters into two ecosystems, a clear separation of east (NE, CE, SE) and west (S, SW, NW) regions. The major causes of these variations are the adjoining water masses and the peripatetic ocean currents that act as sources of marine water that are wide-ranging in salinity, density and temperature (Prasad Citation2004; Shenoi et al. Citation2004). Furthermore, the intense solar radiation, monsoonal winds, and the associated oceanic influences that administer vertical mixing and upwelling collectively contribute to these changes (Shenoi et al. Citation2004).
The Bay of Bengal is warmer compared with the Arabian Sea, due to the effect of vertical stratification (Shenoi et al. Citation2004; Li et al. Citation2017, our study). The freshwater outflow from several Indian rivers dominates in the Bay of Bengal and produces a shallow mix layer, restraining vertical mixing to a comparatively narrowed depth in the water column (Narvekar and Kumar Citation2006; Sengupta et al. Citation2006; Agarwal et al. Citation2012). Consequently, the diffusion of heat in water that has been absorbed from solar radiation is confined to the upper most layer, resulting in a warm sea surface in the Bay of Bengal. Conversely, the surface water mass in the Arabian Sea is relatively colder as it encounters no such extensive stratification or restricted vertical mixing as compared with the Bay of Bengal (Shenoi et al. Citation2004). The eastern region around the country is susceptible to freshwater influx compared with the west coast, due to the relative position of the island that encounters the warm and less saline water from the Bay of Bengal (Anutaliya et al. Citation2017; Chakraborty et al. Citation2018). According to Chakraborty et al. (Citation2018) freshwater inflow results in significant warmth and a dilution of salinity, compared with other regions, and cause a prevailing thick layer of low-density surface water that acts as a barrier for vertical mixing. In contrast, the western region remains highly saline, as the region is not in direct interaction with the Bay of Bengal (Jensen Citation2001). There could also be an upwelling as lower stratification and strong favourable winds facilitate vertical mixing bringing up water from beneath the pycnocline (Walter et al. Citation2014; Miller and Tziperman Citation2017).
Our results indicate a moderately warm region in the south with anomalies in both surface temperature and salinity within the region. A colder ocean patch with a strong temperature gradient exists closer to the southern coastline. This indicates an upwelling in the region, caused by the prevailing monsoonal weather (Vinayachandran et al. Citation2004; Yapa Citation2009).
Phytoplankton aggregations
Our study showed characteristic patterns in phytoplankton distributions in Sri Lankan waters. The satellite Chl a distribution revealed a clear significant distinction between low concentrations in the east, and high concentrations in the south and west during the survey period. Furthermore, seasonal dynamics of Chl a distribution showed that surface concentrations in the east of Sri Lanka are lower than in the west throughout the year, implying low biological productivity in the east during both southwest and northeast monsoon periods (see ). In contrast, the south region of Sri Lanka showed seasonal peaks in Chl a concentration that coincided with the southwest monsoon period. The shelf region in general had higher concentrations than the deep offshore waters. The southern coast is a major upwelling region, during both monsoon periods (northeast and southwest), resulting from southward flow converging along the southern coast and subsequent divergence associated with the offshore transport of water (de Vos et al. Citation2014; Hood et al. Citation2017). A similar high seasonal concentration and spatial Chl a pattern was previously reported in the Sri Lankan waters (Yapa, Citation2009). In the Indo–Sri Lanka region, the shallow mixed layer and nutrient enrichment driven by upwelling and Ekman pumping result in Chl a enhancement (Narvekar and Kumar, Citation2006). The Chl a concentration (>5 mg m−3) previously recorded for the upwelling along the southern coast of Sri Lanka (Vinayachandran et al. Citation2004) is comparable to those observed in this study. In the west, the Chl a was higher in deeper waters, likely due to strong mixing in this area. Several studies have shown that the phytoplankton production is highest during the southwest monsoon (June–September) all along the west coast of India (Radhakrishna Citation1969; Subrahmanyan et al. Citation1975; Nair et al. Citation1981). From other upwelling regions, peak summer Chl a concentration close to 10 mg m−3 in various parts of the Arabian Sea, and 6 mg m−3 off the western coast of India have been reported (Prakash et al. Citation2015; Dalpadado et al. Citation2021). These studies confirm the importance of the southwest monsoon as a key driver of the high phytoplankton production we observed in the west zone off Sri Lanka.
Spatial patterns in zooplankton biomass
The mean zooplankton biomass in the west regions in the upper 30 m were almost three times higher (1.5 g dry wt. m−2) than in the east (0.57 g dry wt. m−2). Statistical analyses confirm that the zooplankton production in the east was significantly much lower compared with the west. The high zooplankton biomass in the west region off India has been linked to the southwest monsoon (Menon and George Citation1977). The high zooplankton biomass observed in the west regions in our study is likely associated with better feeding conditions for these organisms during the productive southwest monsoon period. The zooplankton densities reported previously from the eastern Indian Ocean (Piontkovski et al. Citation1995) are within the range presented here (0.01–0.04 g m−3 dry wt.). Using a conversion factor for carbon content as 40% of the dry weight of zooplankton (Postel et al. Citation2000), our values from shelf waters are comparable (∼ 0.4 C g m−2) to samples (200 µm mesh) from the North East Indian Ocean (Munk et al. Citation2004).
The east and west differences we observe in zooplankton biomass and abundance are also reflected in the wider Indian Ocean. Zooplankton investigations by Fernandes and Ramaiah (Citation2019) showed that the zooplankton biomass is ∼4 times higher in the Arabian Sea than in the Bay of Bengal (Monolisha et al. Citation2017; Fernandes and Ramaiah Citation2019). Assuming that zooplankton biomass is a proxy for secondary production, results from our study also indicate that the western region (cooler areas with high phytoplankton concentrations) of Sri Lanka is ∼3 times more productive than the eastern region (warm areas with low phytoplankton concentrations) during the southwest monsoon, corroborating the above findings.
The high zooplankton biomass, particularly in the SW and S regions could be associated with major upwelling areas off Sri Lanka (Piontkovski et al. Citation1995; de Vos et al. Citation2014). The results from this study confirm previous findings, that the zooplankton production in the west (S, SW, NW) is significantly higher than the east (NE, CE, SE) during the summer monsoon period (Maruthanayagam and Subramanian Citation1999; Wijetunge and Ranatunga Citation2012; Anandakumar and Thajuddin Citation2013; Bandaranayake et al. Citation2014; Manikarachchi et al. Citation2014).
With respect to primary and secondary production, the east region (North East, Central East, and South East) can be described as being oligotrophic, with very low Chl a concentration (<0.4 mg m−3) and zooplankton biomass (<2 g m−2). The distinct patterns in abiotic (temperature, salinity, oxygen) and biotic (phytoplankton, mesozooplankton) distributions in the east and west observed in this study likely reflects the processes driven by the two monsoons. The seas around Sri Lanka serve as channels for exchange between the Bay of Bengal and the Arabian Sea (Lee et al. Citation2016), which are situated on either side of Sri Lanka having significantly different hydrographical features (Krakstad et al. Citation2018). The exchange of waters between the two flanks of Sri Lanka occurs with its offshore waters transporting water with different properties through reversing ocean currents driven by monsoon winds (de Vos et al. Citation2014; Krakstad et al. Citation2018). Circulation and water mass exchange between the Bay of Bengal and Arabian Sea happen along the periphery of Sri Lanka, thus creating extensive seasonal ocean circulation dynamics and very different water mass characteristics on the east, south and west coast (Krakstad et al. Citation2018). In the south of Sri Lanka, the intense phytoplankton blooms as clearly seen in our study are caused by coastal upwelling and Ekman suction, and are swept into the Bay of Bengal by the southwest Monsoon Current (McCreary et al. Citation2009). Many investigations have shown that zooplankton abundances are high in the south coast of Sri Lanka during the southwest monsoon (Wijetunge and Ranatunga Citation2012; Manikarachchi et al. Citation2014).
A study by Johannes (Citation1978) showed that plankton densities are generally low near the equator compared with higher latitudes due to low levels of nutrients, except in regions of upwelling, confirming the importance of upwelling for production. This high phytoplankton abundance in the south coast is likely due to monsoon mixing of water columns and high nutrient concentrations during the southwest monsoon (Jyothibabu and Madhu Citation2007). The upwelling in this region gives rise to high primary production (proxy for phytoplankton concentrations) providing good feeding conditions for zooplankton, hence, likely the high secondary production (proxy for zooplankton biomass) observed in the southern coast.
Spatial patterns in zooplankton species composition
Although zooplankton plays an important role in the structuring of pelagic communities, knowledge on species diversity from the northern Indian Ocean covering all the seasons and regions is scarce (Monolisha et al. Citation2017). One such study had been conducted by Jinadasa (Citation1985) where he observed different types of zooplankton including Mysis spp., Anomalocera spp., Sagitta spp., Calanus spp. and Megalops spp. during the study period. Furthermore, another study from the east coast of Sri Lanka also recorded low zooplankton abundance during the southwest monsoon period (Bandaranayake et al. Citation2014). Unlike our study, the work by Bandaranayake et al. (Citation2014) was based on a smaller mesh size plankton net (55 µm), hence, they observed high numbers of smaller organisms such as larval stages of copepods and other crustaceans.
In the west coast of Sri Lanka, Ranatunga (Citation1999) observed the zooplankton composition (55 µm net) to be dominated by radiolaria, foraminifera, chaetognatha (Sagitta sp.), copepoda, appendicularia (Oikopleura spp.), naupliar stages of crustaceans and larval stages of fish and polychaetes. In the current study, we used much bigger mesh size net (180 µm, generally used for catching mesozooplankton), hence, our results indicated high abundance of somewhat larger organisms in later developmental stages such as Euterpina acutifrons, Paracalanus parvus, Subeucalanus spp., and Oikopleura dioca.
In the north-western regions of Sri Lanka, our study exhibited very high zooplankton abundances (1931 ind. m−3). Several other studies also have shown high zooplankton abundances in the north-western regions of Sri Lanka during the April–June period (Maruthanayagam and Subramanian Citation1999; Anandakumar and Thajuddin Citation2013; Varadharajan and Soundarapandian Citation2013). A study conducted by Varadharajan and Soundarapandian (Citation2013) in the north-western region close to India showed high species abundance and different species composition compared with the current study. These authors used a smaller net (diameter 35 cm) with a smaller mesh size (158 µm), towing horizontally in the surface layer for an hour, hence, likely catching a large number of smaller individuals and young developmental stages (e.g. copepod developmental stages) compared with our study. In their study, Acartia spp., Pseudodiaptomus aurivilli, Eucalanus elongatus, Labidocera acuta, and Nannocalanus minor were abundant compared with our study where Euterpina acutifrons and Subeucalanus spp. were dominant. However, in both studies Paracalanus parvus was indicated as a common species. Anandakumar and Thajuddin (Citation2013) using a much smaller mesh size (20 µm) observed high micro zooplankton density (1400–23,200 m−3) in the Gulf of Mannar region. These smaller organisms are likely not representatively caught in the WP2 net (180 µm) used in our study.
Important feeding grounds for higher trophic levels
If the abundance of zooplankton is an indication of the potential fishery resources of an area, particularly the western Indian Ocean can be considered as valuable fishing grounds (Monolisha et al. Citation2017). In the west coast of Sri Lanka where high zooplankton biomass was recorded, the main coastal fisheries have been developed for zoo-planktivorous clupeids, mainly for Amblygaster spp. and Sardinella spp. (Dayaratne Citation1984; Pillai and Rohit Citation2003; Karunasinghe and Wijeyaratne Citation1995). In the SW regions of Sri Lanka, high biomasses of small pelagic fish (dominated by clupeids) were observed both by landing catch statistics (Karunasinghe and Fonseka Citation1985; Haputhantri et al. Citation2008) and acoustic survey estimates (Krakstad et al. Citation2018). Presence of high biomass of zooplankton in the west coast most likely contributes to sustaining coastal fisheries in this region of Sri Lanka. Moreover, the productive upwelling areas of the south coast of Sri Lanka are considered as important feeding grounds for organisms living in the area, spanning from larval fish (Rathnasuriya et al. Citation2021) to whales, e.g. the blue whale (Balaenoptera musculus) population observed year-round in this region (de Vos et al. Citation2010).
Key drivers of zooplankton
In this study, we focused only on the bottom-up (climate effects on zooplankton) and not on top-down (predation effects on zooplankton) processes. High zooplankton biomass was recorded in the western areas (S, SW, NW), and particularly in regions with upwelling (S and SW). A study by de Vos et al. (Citation2014) showed that major upwelling occurs during both monsoon periods, along the southern coast (SW and S, as defined in our study). Their study did, however, indicate that surface chlorophyll concentrations observed during the southwest monsoon, were much higher than in the northeast monsoon. The observed high zooplankton productive waters in the west compared with the east in our study in the summer monsoon period, are likely due to optimal feeding and growth conditions in this region.
A recent long-term study showed that the Indian Ocean is undergoing unprecedented changes in temperature with significantly increasing trends in sea surface temperature (SST) (Dalpadado et al. Citation2021). In the tropical waters, increase in SST leads to stratification altering phytoplankton productivity negatively due to nutrient limitation (Doney Citation2006). PCA and correlation analyses in our study clearly showed that Chl a acts as a significant positive driver of zooplankton biomass while temperature has an opposite effect. These results confirm that vertical mixing processes (e.g. upwelling) bringing cooler, nutrient-rich deeper waters into productive upper layers, are important for high zooplankton biomass/production. The expected increase in SST predicted by the climate model scenarios and likely subsequent decrease in phytoplankton production (Doney Citation2006; Roxy et al. Citation2016) may impact zooplankton and higher trophic levels negatively.
Conclusions
Our study clearly demonstrates that Chl a concentrations are much lower in the east zone off Sri Lanka during both monsoon periods compared with the west. The southwest monsoon seems to be a key driver for high phytoplankton production in the west region. This is reflected in that we see zooplankton biomass and abundance to be significantly higher in the west compared with the east in Sri Lankan waters during the southwest monsoon. Our study revealed that salinity and Chl a values were higher in the west (NW, SW, S) than in the east (NE, CE, SE), while temperature showed an opposite pattern. Results from this study clearly show that temperature is the main driver of zooplankton biomass in these waters. Zooplankton communities in the west were mainly dominated by larger zooplankton (copepods) while in the east, smaller organisms (foraminifera) were dominant. Further studies are required to explore the phenology of zooplankton in Sri Lankan waters during the southwest and northeast monsoon periods. The impact of warming (rising SST) on plankton productivity and higher trophic levels in the Indian Ocean should be carefully monitored in future studies.
Supplemental Material
Download MS Word (808.2 KB)Acknowledgements
This paper was produced with the support of the EAF-Nansen Programme, a partnership between the Food and Agriculture Organization of the United Nations (FAO), the Norwegian Agency for Development Cooperation (Norad), and the Institute of Marine Research (IMR), Norway, for sustainable management of fisheries in partner countries and regions. The support given by the National Aquatic Resources Research and Development Agency (NARA) and the crew of R/V Dr. Fridtjof Nansen is greatly acknowledged. We extend our gratitude to Mr J.O. Krakstad (IMR), Mr M.I.G. Rathnasuriya, Ms R.R.A.R. Shirantha (NARA), Mr H.M.T.C. Madhushanka (NARA) and Mr W.A.D. Sampath (Department of Fisheries and Aquatic Resources, Sri Lanka) for their immense help provided during the survey. The authors are very grateful to Professor Kevin R. Arrigo and Gert L. van Dijken (Stanford University, USA) for giving permission to use satellite data. We are also grateful to Dr Palitha Kithsiri, the Director General of NARA and Coordinator of EAF-Nansen Programme, Sri Lanka, for providing facilities and encouragement. This work was also supported by the Sri Lanka-Norway bilateral project (Grant Number 15113-39). We are indebted to the academic editor and anonymous referees for their valuable and constructive comments on the manuscript.
Disclosure statement
No potential conflict of interest was reported by the author(s).
Additional information
Funding
References
- Agarwal N, Sharma R, Parekh A, Basu S, Sarkar A, Agarwal VK. 2012. Argo observations of barrier layer in the tropical Indian ocean. Advances in Space Research. 50(5):642–654. doi:https://doi.org/10.1016/j.asr.2012.05.021
- Anandakumar N, Thajuddin N. 2013. Physico-chemical properties, seasonal variations in species composition and abundance of micro zooplankton in the Gulf of Mannar, India. Indian Journal of Geo-Marine Sciences. 42(3):383–389.
- Anutaliya A, Send U, McClean JL, Sprintall J, Rainville L, Lee CM, Jinadasa SUP, Wallcraft AJ, Metzger EJ. 2017. An undercurrent off the east coast of Sri Lanka. Ocean Science. 13(6):1035–1044. doi:https://doi.org/10.5194/os-13-1035-2017
- Bandaranayake KHK, Weerasekara KAWS, Azmyl SAM, Ranatunga RRMKP, Hettige ND. 2014. A study on zooplankton composition and their potentiality as bio indicators in selected coastal habitats, Sri Lanka. Journal of the National Aquatic Resources Research and Development Agency. 43:53–67.
- Chakraborty K, Valsala V, Gupta GVM, Sarma VVSS. 2018. Dominant biological control over upwelling on pCO2 in sea east of Sri Lanka. Journal of Geophysical Research: Biogeosciences. 123(10):3250–3261. doi:https://doi.org/10.1029/2018JG004446
- Conway DV, White RG, Hugues-Dit-Ciles J, Gallienne CP, Robins DB. 2003. Guide to the coastal and surface zooplankton of the south-western Indian Ocean. occasional publication of the Marine Biological Association of the United Kingdom, No 15. UK: Plymouth.
- Dalpadado P, Arrigo KA, Dijken GL, Gunasekara SS, Ostrowski M, Bianchi G, Sperfeld E. 2021. Warming of the Indian Ocean and its impact on temporal and spatial dynamics of primary production. Progress in Oceangraphy. https://doi.org/https://doi.org/10.1016/j.pocean.2021.102688
- Dayaratne P. 1984. Fisheries biology of some small pelagic fish species (Clupeiodes) from the west coast of Sri Lanka. Bergen, Norway: University of Bergen.
- de Vos A, Pattiaratchi C, Harcourt R. 2010. Factors influencing aggregations of blue whales off southern Sri Lanka. 15th Physics of estuaries and coastal seas (PECS) conference proceedings. doi:https://doi.org/10.13140/2.1.1839.9683.
- de Vos A, Pattiaratchi CB, Wijeratne EMS. 2014. Surface circulation and upwelling patterns around Sri Lanka. Biogeosciences (online). 11(20):5909–5930. doi:https://doi.org/10.5194/bg-11-5909-2014
- Doney SC. 2006. Plankton in a warmer world. Nature. 444:695–696. doi:https://doi.org/10.1038/444695a
- Fernandes V, Ramaiah N. 2019. Spatial structuring of zooplankton communities through partitioning of habitat and resources in the Bay of Bengal during spring intermonsoon. Turkish Journal of Zoology. 43(1):68–93. doi:https://doi.org/10.3906/zoo-1805-6
- Haputhantri SSK, Villanueva MCS, Moreau J. 2008. Trophic interactions in the coastal ecosystem of Sri Lanka: an ECOPATH preliminary approach. Estuarine Coastal and Shelf Science. 76(2):304–318. doi:https://doi.org/10.1016/j.ecss.2007.07.013
- Hood RR, Beckley LE, Wiggert JD. 2017. Biogeochemical and ecological impacts of boundary currents in the Indian cean. Progress in Oceanography. 156:290–325. doi:https://doi.org/10.1016/j.pocean.2017.04.011
- Hood RR, Wiggert JD, Naqvi SWA. 2009. Indian Ocean research: opportunities and challenges. Geophysical Monograph Series. 185:409–428.
- Jayasiri H. 2007. Hydrobiological aspects of Palk Bay and Palk Strait area. PART (III): composition, abundance and spatial variation of phytoplankton and zooplankton-off Jaffna (Palk Strait). Journal of National Aquatic Resources Research and Development Agency. 38:60–76.
- Jensen TG. 2001. Arabian Sea and Bay of Bengal exchange of salt and tracers in an ocean model. Geophysical Research Letters. 28(20):3967–3970. doi:https://doi.org/10.1029/2001GL013422
- Jinadasa, J. 1985. A study of some oceanographic factors off Trincomalee in Relation to flying fish fishery. Vidyodaya Journal of Arts, Science and Letters 9(1 and 2): 15–28.
- Jitlang I, Pattarajinda S, Mishra A, Wongrat L. 2008. Composition, abundance and distribution of zooplankton in the Bay of Bengal. The Ecosystem-Based Fishery Management in the Bay of Bengal. 65–92.
- Johannes RE. 1978. Reproductive strategies of coastal marine fishes in the tropics. Environmental biology of fishes, 3(1):65–84. doi:https://doi.org/10.1007/BF00006309
- Jyothibabu RM, Madhu NM. 2007. Zooplankton. Chapter 7. National Institute of Oceanography, Regional Centre, Kochi 682 018, India; pp. 83:145.
- Karunasinghe W, Fonseka M. 1985. A preliminary analysis of small mesh gillnet fishery in the inshore waters of Sri Lanka (December 1983 to November 1984). Journal of National Aquatic Resources Research and Development Agency. 32:34–45.
- Karunasinghe WPN, Wijeyaratne MJS. 1995. Studies on the exploitation of trenched sardine Amblygaster sirm (WALBAUM) off the Negombo Coast. Journal of National Science Foundation of Sri Lanka. 23(1):1–7. doi:https://doi.org/10.4038/jnsfsr.v23i1.5565
- Krakstad JO, Jayasinghe P, Totland A, Dalpadado P, Søiland H, Cervantes D, Gunasekara S, Liyanage U, Haputhantri S, Arulananthan K, et al. 2018. Survey of regional resources and ecosystems off the Bay of Bengal: Part 1 Sri Lanka. Survey no 2018408. pp. 137.
- Lathasumathi C, Escalante PDR, Kalaiarasi M, Stella C. 2017. Seasonal variation of community composition of zooplankton in the Palk strait (9-10° N, Arabian Sea, India). Bulletin de la Société Royale des Sciences de Liège. 86:78–87. doi:https://doi.org/10.25518/0037-9565.7209.
- Lee CM, Jinadasa SUP, Anutaliya A, Centurioni LR, Fernando HJS, Hormann V, Lankhorst M, Rainville L, Send U, Wijesekera HW. 2016. Collaborative observations of boundary currents, water mass variability, and monsoon response in the southern Bay of Bengal. Oceanography. 29(2):102–111. doi:https://doi.org/10.5670/oceanog.2016.43
- Legendre P, Legendre L. 2012. Numerical ecology. Amsterdam: Elsevier.
- Li Y, Han W, Wang W, Ravichandran M, Lee T, Shinoda T. 2017. Bay of Bengal salinity stratification and Indian summer monsoon intraseasonal oscillation: 2. Impact on SST and convection. Journal of Geophysical Research: Oceans. 122(5):4312–4328. doi:https://doi.org/10.1002/2017JC012692
- Maar M. 2003. Distributions of zooplankton in relation to biological-physical factors [PhD]. National Environmental Research Institute. Ministry of Environment, Denmark. pp.1-30.
- Manikarachchi MIU, Kumara PBTP, Iroshanie RGA. 2014. Evaluation of changes in zooplankton community and water quality parameters in the polhena reef ecosystem observed during November 2010 to February 2011. Journal of the University of Ruhuna. 1(2):9–17. doi:https://doi.org/10.4038/jur.v1i2.6621
- Maruthanayagam C, Subramanian P. 1999. Hydrological and zooplankton biomass variation in Palk Bay and Gulf of Mannar along the east coast of India. Journal of Marine Biological Association India. 41(1&2):7–18.
- McCreary JP, Murtugudde R, Vialard J, Vinayachandran VPN, Wiggert JD, Hood RR, Shankar D, Shetye S. 2009. Biophysical processes in the Indian Ocean. In: Wiggert JD, Hood RR, Naqvi SWA, Brink KH, Smith SL, editor. Indian Ocean biogeochemical processes and ecological variability. 185:9-32. Geophysical monograph series. doi:https://doi.org/10.1029/2008GM000768.
- Menon MD and George KC. 1977. On the abundance of zooplankton along the south west coast of India during the year 1971–75. In Proceedings of the Symposium on Warm Water Zooplankton, Special. Publication. pp. 205–213
- Miller MD, Tziperman E. 2017. The effect of changes in surface winds and ocean stratification on coastal upwelling and sea surface temperatures in the pliocene. Paleoceanography and Paleoclimatology. 32(4):371–383. doi:https://doi.org/10.1002/2016PA002996
- Monolisha S, George G, Platt T. 2017. Biogeography of northern Indian Ocean. Structure and Function of the Marine Ecosystem: Fisheries. 1–21. http://eprints.cmfri.org.in/id/eprint/12769.
- Motoda S. 1959. Devices of simple plankton apparatus. Memoirs of the faculty of fisheries Hokkaido University. 7:73–94.
- Munk P, Bjørnsen PK, Boonruang P, Fryd M, Hansen PJ, Janekarn V, Limtrakulvong V, Nielsen TG, Hansen OS, Satapoomin S, et al. 2004. Assemblages of fish larvae and mesozooplankton across the continental shelf and shelf slope of the Andaman Sea (NE Indian Ocean). Marine Ecology Progress Series. 274:87–97. doi:https://doi.org/10.3354/meps274087
- Nair SRS, Nair VR, Achuthankutty CT, Madhupratap M. 1981. Zooplankton composition and diversity in western Bay of Bengal. Journal of Plankton Research. 3(4):493–508. doi:https://doi.org/10.1093/plankt/3.4.493
- Narvekar J, Kumar SP. 2006. Seasonal variability of the mixed layer in the central Bay of Bengal and associated changes in nutrients and chlorophyll. Deep Sea Research Part I. 53(5):820–835. doi:https://doi.org/10.1016/j.dsr.2006.01.012
- Pillai NG, Rohit P. 2003. Chapter 3, Lesser sardines. In: Joseph M.M JAA, editor. Status of exploited Marine fishery resources of India. Cochin: Indian Council of Agricultural Research; p. 25–29.
- Piontkovski S, Williams R, Melnik TA. 1995. Spatial heterogeneity, biomass and size structure of plankton of the Indian Ocean: some general trends. Marine Ecology Progress Series. 117:219–227. doi:https://doi.org/10.3354/meps117219
- Pitchaikani JS, Lipton AP. 2015. Seasonal variation of zooplankton and pelagic fish catch in the fishing grounds off Tiruchendur coast, Gulf of Mannar, India. Ecohydrology and Hydrobiology. 15(2):89–100. doi:https://doi.org/10.1016/j.ecohyd.2015.04.003
- Postel L, Fock H, Hagen W. 2000. Biomass and abundance. ICES zooplankton methodology manual. Academic Press, Elsevier; pp. 83-192.
- Prakash S, Verma A, Prakash S. 2015. Seasonal variation of Zooplankton and zoobenthos population in Alwara lake of district Kaushambi Uttar Pradesh India. The Journal of Zoology Studies. 2(5):13–16. doi:https://doi.org/10.13140/RG.2.2.14029.67043.
- Prasad TG. 2004. A comparison of mixed-layer dynamics between the Arabian Sea and Bay of Bengal: One-dimensional model results. Journal of Geophysical Research: Oceans. 109:C03035. doi:https://doi.org/10.1029/2003JC002000.
- Radhakrishna K. 1969. Primary productivity studies in the shelf waters off Alleppey, south-west India, during the post-monsoon, 1967. Marine Biology. 4(3):174–181. doi:https://doi.org/10.1007/BF00393890
- Ranatunga R. 1999. A preliminary studies on fish production in relation of primary production of the western coastal waters in Sri Lanka. Vidyodaya Journal of Science. 8:161–171.
- Rathnasuriya MIG, Mateos-Rivera A, Skern-Mauritzen R, Wimalasiri HBU, Jayasinghe RPPK, Krakstad JO, Dalpadado P. 2021. Composition and diversity of larval fish in the Indian Ocean using morphological and molecular methods. Marine Biodiversity. 51:1–15. doi:https://doi.org/10.1007/s12526-021-01169-w.
- Razouls C, De Bovée F, Kouwenberg J, Desreumaux N. 2005-2009. Diversity and geographic distribution of marine planktonic copepods. https://copepodes.obs-banyuls.fr/en/index.php.
- R Core Team. 2018. R: A language and environment for statistical computing, Vienna, Austria.
- Roxy MK, Modi A, Murtugudde R, Valsala V, Panickal S, Prasanna Kumar S, Ravichandran M, Vichi M, Lévy M. 2016. A reduction in marine primary productivity driven by rapid warming over the tropical Indian ocean. Geophysical Research Letters. 43:826–833. doi:https://doi.org/10.1002/2015GL066979
- Sengupta D, Bharath Raj GNB, Shenoi SSC. 2006. Surface freshwater from Bay of Bengal runoff and Indonesian throughflow in the tropical Indian ocean. Geophysical Research Letters. 33(22):1–5. doi:https://doi.org/10.1029/2006GL027573
- Shenoi SSC, Shankar D, Shetye SR. 2004. Why is Bay of Bengal warmer than Arabian Sea during the summer monsoon? Geology. 87–93. http://drs.nio.org/drs/bitstream/2264/1187/2/Proc_Natl_Symp_METOC_2004_87.pdf.
- Sreeush MG, Valsala V, Pentakota S, Prasad KVSR, Murtugudde R. 2018. Biological production in the Indian Ocean upwelling zones–Part 1: refined estimation via the use of a variable compensation depth in ocean carbon models. Biogeosciences (online). 15(7):1895–1918. doi:https://doi.org/10.5194/bg-15-1895-2018
- Subrahmanyan R, Gopinathan CP, Pillai CT. 1975. Phytoplankton of the Indian Ocean: some ecological problems. Journal of Marine Bioloical Association of India. 17(3):608–612.
- Tomczak M, Godfrey JS. 1994. Regional oceangraphy. An Introduction. doi:https://doi.org/10.1016/B978-0-08-041021-0.50004-7.
- Varadharajan D, Soundarapandian P. 2013. Zooplankton abundance and diversity from Pointcalimere to Manamelkudi, south east coast of India. Journal of Earth Science and Climatic Change. 4(5):151. doi:https://doi.org/10.4172/2157-7617.1000151.
- Vinayachandran PN, Chauhan P, Mohan M, Nayak S. 2004. Biological response of the sea around Sri Lanka to summer monsoon. Geophysical Research Letters. 31(1):L01302. doi:https://doi.org/10.1029/2003GL018533
- Walter RK, Woodson CB, Leary PR, Monismith SG. 2014. Connecting wind-driven upwelling and offshore stratification to nearshore internal bores and oxygen variability. Journal of Geophysical Research: Oceans. 119(6):3517–3534. doi:https://doi.org/10.1002/2014JC009998
- Wijetunge DS, Ranatunga RRMKP. 2012. Zooplankton assemblage in Hambanota port and adjacent coastal waters of Sri Lanka. Vidyodaya Journal of Science. 17:9–23.
- Wyrtki K. 1973. Physical oceanography of the Indian Ocean. In: Zeitzschel B, Gerlach SA, editors. The biology of the Indian Ocean. Ecological Studies (Analysis and Synthesis), vol 3. Springer, Berlin: Heidelberg. https://doi.org/https://doi.org/10.1007/978-3-642-65468-8_3
- Yapa KKAS. 2009. Upwelling phenomena in the southern coastal waters of Sri Lanka during southwest monsoon period as seen from MODIS. Sri LankaN Journal of Physics. 10:7–15. doi:https://doi.org/10.4038/sljp.v10i0.3831
- Zar JH. 1999. Biostatistical analysis. Pearson Education India.