
ABSTRACT
The toothed barnacle Chthamalus dentatus has a wide distribution in the intertidal zone along the coasts of Africa, ostensibly occurring from Madagascar and Mozambique in the West Indian Ocean to Senegal in the Eastern Atlantic Ocean. We studied the differences in the mitochondrial COI gene of 287 individuals from 15 different locations and found that this taxon, which morphologically is considered a single species, actually compromises three genetically distinct clades – the South African, the Namibian, and the Cameroonian. The genetic differences between these units are similar or larger than those found between different species of Chthamalus. We suggest that the nominal species C. dentatus is a cluster of three cryptic species. These cryptic species are separated by a series of upwelling systems that are likely to act as barriers to the distribution of propagules of C. dentatus. Based on molecular and morphological data, we indicate that C. dentatus is probably a close relative of the Caribbean and Central American species of Chthamalus.
Introduction
Barnacles of the genus Chthamalus (Chthamaloidea: Chthamalidae) are a worldwide element of the rocky intertidal zone of temperate and tropical shores. The geographic distribution of some species covers a wide range of the oceanic domain, while the range of others is limited. Recently, Chan et al. (Citation2021) have listed 27 nominal species of Chthamalus. One of the widely distributed species is the toothed barnacle, Chthamalus dentatus Krauss, which, combined with the possession of six shell plates and a membranous base, is easily recognized by a distinct external feature – the toothed edges of the shell plates (). This morphological character is unique to C. dentatus. Krauss (Citation1848) erected this species, formerly regarded as C. stellatus, using exclusively the morphology of the hard parts: the shell, the shape of the opercular aperture, and the opercular valves (A). He described how the sutures between the shell compartments are dentate, and pairs of adjacent compartments are interlocked. Darwin (Citation1854) also noted that ‘the sutures in all cases are tolerably distinct, and have their edges toothed and interlocked’ (B). He also provided a short-written description of the mouthparts and cirri, noting that the tips of the second pair of cirri have coarsely pectinated setae. Nilsson-Cantell (Citation1921) added to the written description of C. dentatus by providing drawings of mouthparts and the terminal segment of cirrus II (ibid Figure 52, p. 283; see also C in the present study). Stubbings (Citation1967) described the hard and soft parts and briefly mentioned the presence of pectinate seta on the tip of cirrus II. He also presented a drawing of a single seta with basal guards (D), but in his written description, he overlooked the presence of these.
Figure 1. Chthamalus dentatus from Southern Africa. A. Young specimen from Port Elizabeth, South Africa. B. Eroded specimens from Mowe Bay, Namibia. C. Cylindrical specimen from Mowe Bay. D. Specimen from Port Elizabeth.
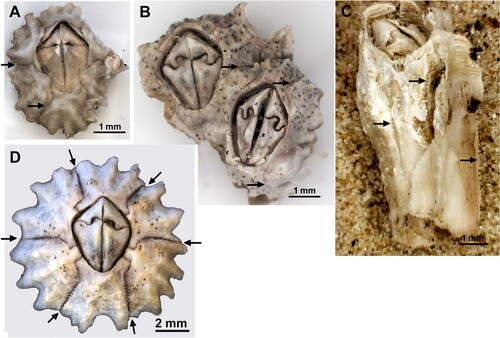
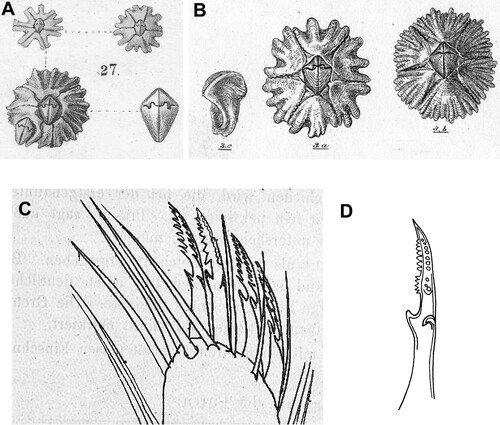
Figure 2. Chthamalus dentatus A. After Krauss (Citation1848), Table VI Figure 27. B. After Darwin (Citation1854), Plate XVIII a. Shell. 3b. Attached to a ship's bottom, general view showing the dentate margins of shell plates. 3c. Tergum viewed from inside. C. After Nilsson-Cantell (Citation1921), Page 293 Text Figure 52. D. After Stubbings (Citation1967), Page 255 f. Seta from the tip of cirrus II from a buoy at Bonny, Nigeria.
The type locality of Chthamalus dentatus is not indicated by Krauss (Citation1848), but we may assume that it is in South Africa since the description is found in his book on South African molluscs. It is one of the most abundant chthamalid barnacles along the Southern African intertidal zone (Barnard Citation1924) and is considered to extend from the Cape Verde (Cabo Verde) Islands in the Eastern Atlantic (Hoek Citation1993) to Madagascar and Mauritius in the Western Indian Ocean (Sandison and Day Citation1954; Stephenson and Stephenson Citation1973). Stubbings (Citation1967) presented a detailed geographical distribution of C. dentatus on the western coast of Africa. It is found south of Cape Verde, from the Gambia in the north, through Sierra Leone, Ghana and Nigeria in the Gulf of Guinea, to Cameroon. South of the River Congo, however, there are few records, largely due to the lack of collecting on this coastline. He also noted that Hoek's identification of C. dentatus from Cape Verde Islands is uncertain. Recently, a cryptic species of Chthamalus related to C. stellatus has been found in Cape Verde Islands (Tikochinski et al. Citation2020). Richmond (Citation2011) illustrates and lists this species in Eastern Africa and the Western Indian Ocean. There are references to the presence of C. dentatus in the Indian Ocean beyond Africa. Nilsson-Cantell (Citation1921) mentioned its presence from Aden without authority and Weltner (Citation1997) reported it from Singapore. This wide geographical range covers diverse marine environments that differ in environmental parameters, temperature, salinity, and exposure to wave activity erosion.
In Southern Africa, Emanuel et al. (Citation1992) analyzed the intertidal community composition of rocky shores. Based on the distribution of 2000 species of invertebrates, they identified four biogeographical provinces () that differ in their environmental aspects. Chthamalus dentatus is present in all these provinces but is rare or absent from sites in the Cool Temperate South-West province (Day Citation1969; Branch et al. Citation2016). According to Sandison and Day (Citation1954), in the Cape Peninsula C. dentatus occurs only in the warmer conditions of False Bay, where it is found around the mid-tide level. However, we recorded a population of C. dentatus at Camps Bay, on the western coast of the Cape Peninsula (see Results).
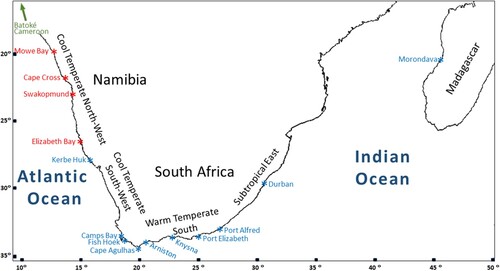
Figure 3. Map showing the 14 collection sites in Namibia, South Africa and Madagascar. The arrow points to the 15th site, Batoké in Cameroon, which is out off the map. Collection sites are coloured according to their clade identity (see Results): South African (blue), Namibian (red) and Cameroon (green).
The study of genetic separation, coupled with the difference in morphological characters, leads to the erection of new species. However, there are cases where genetic differences are not reflected in morphological differences, and if the genetic differences are substantial, such populations can be regarded as cryptic species. The geographic distribution of oceanic sessile organisms like barnacles depends on the dispersal of their propagules, nauplii, and cyprids, which depends on oceanic currents. Oceanic fronts, eddies, and upwellings create barriers between populations, particularly in species with a short developmental period between the hatching of the nauplii to the settlement of cyprids. These barriers can lead to speciation, which in some cases is morphologically cryptic and is evident only by genetic differences.
Genetic differences within nominal species of Chthamalus have been demonstrated in species with wide geographical distribution. Tikochinski et al. (Citation2020) revealed that the Cape Verde Islands population of C. stellatus Poli, one of the most widely distributed species of Chthamalus, is a cryptic species. Tsang et al. (Citation2009, Citation2012a) demonstrated that the C. malayensis Pilsbry population that occurs through the Western Pacific to the Western Indian Ocean is a group of four cryptic species. Following these authors, Simon-Blecher et al. (Citation2021) found a fifth cryptic species of C. malayensis on the Tanzanian coast. Comparison of COI (cytochrome c oxidase subunit I) sequences of C. moro Pilsbry from 14 sites in East Asian islands showed that this nominal species comprises three distinct genetic lineages, representing three cryptic species (Wu et al. Citation2015).
The wide geographical distribution, separated by marine barriers, of the morphologically similar populations of C. dentatus, leads to interpret that this species is, in fact, a cluster of several cryptic species. Indeed, using molecular data from three sampling sites, Wares (Citation2020) has already suggested that there are three clades within the extent of C. dentatus. In the present work, we extend and confirm Wares’ suggestion by analyzing much larger samples from many locations within the C. dentatus distribution.
Material and methods
Material studied
We examined Chthamalus dentatus populations from 15 different locations (, ). The locations are (from east to west, in a clockwise direction): one from Madagascar (Morondava), eight from South Africa (Durban, Port Alfred, Port Elizabeth, Knysna, Arniston, Cape Agulhas, Fish Hoek, and Camps Bay), five from Namibia (Kerbe Huk, Elizabeth Bay, Swakopmund, Cape Cross, and Mowe Bay) and one from Cameroon (Batoké). The total number of individuals examined was 287 (). Except for Elizabeth Bay, which contributed only two individuals, all other 14 locations were represented by at least ten individuals each, thus enabling us to perform a reliable population study based on these 14 locations. Elizabeth Bay was used only in one, an individual-based analysis. The samples were fixed and preserved in 95% ethanol. The material used for the present study is stored in the Israeli National Natural History Collections at the Hebrew University of Jerusalem (for details, see Table A1 in the Supplemental Material).
Table I. Number of individuals (N) from each population. Coordinates are rounded to the nearest minute.
Molecular analysis
DNA was extracted from muscles and cirri using a genomic DNA isolation kit (Macherey-Nagel GmbH & Co. Germany) according to the manufacturer's protocol. The concentration of DNA was determined by NanoDrop ND1000 (Thermo Fisher Scientific Inc., Waltham, MA, USA) at 260 nM. The mitochondrial cytochrome c oxidase subunit I (COI) was amplified using the universal barcode primers LCO1490 and HCO2198 (Folmer et al. Citation1994). The amplifications were conducted in a reaction mix containing 0.5 µl of template DNA, 12.5 µl PCR mix (2X PCR HS Taq Mix Red; PCR Biosystem, London, UK) 10 nM of each primer, and double distilled water to a total volume of 25 µl. The PCR profile for COI was: 1 min at 95°C for initial denaturation followed by 40 cycles of 15s at 95°C, 15s at 50°C, 20s at 72°C with a final extension for 3 min at 72°C 1 min at 4°C and pause at 15°C.
Amplification was carried out in a personal combi-thermocycler (Biometra, Germany), according to Tsang et al. (Citation2012b). PCR products were purified and sequenced by MCLAB Laboratories (South San Francisco, CA). Both strands were sequenced using an ABI PRISM 3100 Genetic Analyzer (Applied Biosystems, Foster City, CA). Sequences were aligned using the Molecular Evolution Genetics Analysis (MEGA X, Kumar et al. Citation2019) software. Sequences used in the present study have been deposited in GenBank; accession numbers are given in the Supplemental Material (Table A1).
Statistical analysis
After multiple alignment of all the sequences (using the ClustalW option in MEGA X), we were left with 530 positions for each sequence. Pairwise distances between the COI haplotypes were calculated by the Kimura 2-parameter model, using the MEGA X software.
Altogether we analyzed 287 individuals, which display 235 different COI haplotypes: 211 haplotypes are unique, in the sense that each appears only once in our sample, ten haplotypes are each shared by two different individuals, seven haplotypes by three individuals, four by four, only one by five, one by six, and one haplotype is shared by eight different individuals.
The large number of individuals prevents us from displaying a legible phylogenetic tree which includes all individuals. Instead, we first proceeded with a population-based analysis of the 14 locations (excluding Elizabeth Bay, which contributed only two individuals) by considering the 91 between-population mean distances. The overall 14 × 14 distance matrix served to construct a population phylogenetic tree by the UPGMA (unweighted pair group method with arithmetic mean) algorithm, using the MVSP software (Kovach Computing Services Citation2013).
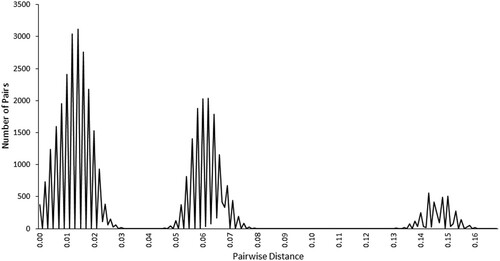
In addition to the phylogenetic tree, the Automatic Barcode Gap Discovery (ABGD) method (Puillandre et al. Citation2012) was also employed to detect possible clustering of individuals by considering the distribution of all 41,041 pairwise distances.
A median-joining haplotype network was constructed using the POPART software (Leigh and Bryant Citation2015).
Following the insight gained by the population-based tree, we then focused on the genetic differentiation of the C. dentatus populations on the Atlantic coast of Africa, using an individual-based analysis. For this analysis we considered only the populations of Camps Bay, Kerbe Huk, Swakopmund, and Batoké (Cameroon), together with the two individuals from Elizabeth Bay (which is about 30 km south of Lüderitz, Namibia). Due to the small sample (only two individuals) from Elizabeth Bay, this location was not incorporated in the population-based analyses. From the pairwise distances between the individual haplotypes, we constructed a bootstrap-generated (1000 replications) neighbor-joining tree, using the MEGA X software.
Tsang et al. (Citation2009, Citation2012a) report four discrete clades in the C. malayensis population (Indo-Malay, Taiwan, South China Sea, and Christmas Island clades), distinguished according to differences in the COI gene. To compare our C. dentatus haplotype distribution with Tsang et al.'s results, we performed a population-based analysis (as described above), incorporating our data with COI data from the four C. malayensis clades.
Furthermore, we compared the distribution of our dentatus samples to ten well-established nominal species of Chthamalus (C. alani, C. challenger, C. dalli, C. fissus, C. fragilis, C. montagui, C. newmani, C. panamensis, C. proteus, and C. stellatus), using a similar population-based analysis.
Morphology
Specimens of Chthamalus dentatus were visualized by Olympus SZX10 dissecting microscope; figures were combined using CellSense software. Cirri were dissected using entomological needles and were used for microscopic and SEM examination. Leica upright field LMD7 microscope with LasX software was used for acquiring figures.
We did not use mouthparts since these are indistinguishable within the genus Chthatmalus and are of limited use in the separation of species within this genus (Pilsbry Citation1916; Southward Citation1976). We used the diagnostic characters suggested by Dando and Southward (Citation1980) to separate species of Chthamalus, namely, the presence or absence of conical spines on the first cirrus, the setation of the terminal segments of the second cirrus, and the presence or absence of guards. For the description of setae, we used the terminology of Garm (Citation2004) and Chan et al. (Citation2008). The first and second cirri from four to five individuals of ethanol-fixed specimens were separated and soaked for a few minutes in 100% ethanol, then transferred to acetone for 30 min and dehydrated using the critical point drying (CPD) method, mounted on brass stubs, and observed under a scanning electron microscope (JEOL 840, Tokyo, Japan) fitted with a Semaphores system (JEOL, Tokyo, Japan) for digital imaging.
Results
Molecular analyses
The between-population distance matrix is presented in and is the basis for constructing the population dendrogram (). The analysis displays a geographic structure, dividing the populations among three main clusters. All the South African locations, together with Morondava (Madagascar) and the Southern Namibian population of Kerbe Huk, were included in one cluster, which we refer to as the ‘South African’ clade. The second cluster comprised the Namibian locations, with the exception of Kerbe Huk, and we term this the Namibian clade. The third cluster was quite distinct from the other two clusters and included only the Batoké population of Cameroon.
Figure 4. An UPGMA tree depicting the relationship between the 14 Chthamalus dentatus populations. (CMR = Cameroon, MDG = Madagascar, NAM = Namibia, and RSA = South Africa).
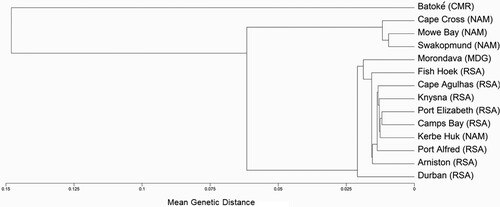
Table II. Mean genetic distances between the 14 sampled locations. The rightmost column displays the mean genetic distances within each location. Distances were calculated by the Kimura 2-parameter model.
The ABGD method displays a tri-modal distribution of the individual pairwise distances (). The first mode comprises the within-cluster distances, the second mode represents pairwise distances between the South African and the Namibian clusters, and the third mode represents the large distances between Cameroon and each of the other two clusters.
Figure 5. The tri-modal distribution of all pairwise distances (with regard to the ABGD method).
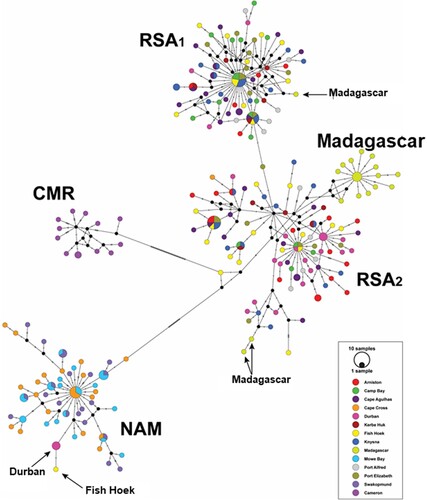
The haplotype network is presented in . It clearly demonstrates the division into three clades. The Cameroon clade (denoted by CMR) consists of all Batoké individuals, without any other individuals, and is separated by a long arm indicating more than 50 bp substitutions. The Namibian clade (denoted by NAM), which is separated by an arm indicating more than 20 bp substitutions, consists of all Namibia individuals, except for Kerbe Huk, but includes also one haplotype (a single individual) from Fish Hoek and one haplotype (three individuals) from Durban. The South African clade is more complex – it is divided into three sub-clades (denoted by RSA1, RSA2 and Madagascar). The Madagascar sub-clade consists only of Madagascar individuals. However, three other Madagascar haplotypes are included one in RSA1 and two in RSA2. All South African individuals (except the two haplotypes which are included in the Namibian clade), as well as the Kerbe Huk individuals, are divided between RSA1 and RSA2.
Figure 6. A median-joining haplotype network. The three clades are Cameroon (CMR), Namibia (NAM) and South Africa (which is further divided into three sub-clades – RSA1, RSA2 and Madagascar).
A separation between Cameroon, Namibia, and South Africa has already been suggested by Wares (Citation2020), based on very small sub-samples from only three locations, one from each cluster (Batoké, Cameroon; a location from Namibia; and Port Elizabeth, South Africa). Of particular interest is the division between the South African and the Namibian clusters. Thus, an additional approach was to compare the mean within-cluster pairwise distances to the mean between-cluster distance, where the two clusters are the South African and the Namibian. While the mean pairwise distances within the South African cluster was 1.66% ± 0.25% (mean ± standard error, estimated by 1000 bootstrap replicates) and within the Namibian cluster 1.10% ± 0.16%, the mean pairwise distances between these two clusters was 6.13% ± 0.99% – about 3.7 and 5.6 times larger than the respective mean within-cluster distances. As for Cameroon, the mean pairwise distances between the Cameroon cluster and the Namibian or the South African clusters were 14.84% ± 1.70% and 14.80% ± 1.70%, respectively.
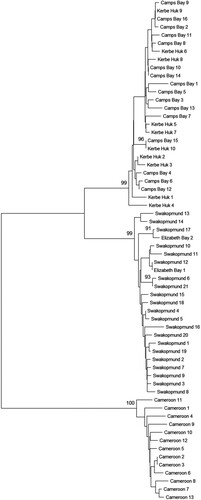
focuses on the transition region between the South African and the Namibian clusters. It comprises the population of Camps Bay, as a representative of the South African cluster, the population of Swakopmund, as a representative of the Namibian cluster, and the two in-between populations of Kerbe Huk and Elizabeth Bay (both in Namibia). Also included is the further north population of Batoké (Cameroon). It turns out that the border between the South African and the Namibian clusters lies north of Kerbe Huk, but south of Elizabeth Bay, in the region of the Southern Benguela upwelling regime.
Figure 7. A neighbor-joining tree of Chthamalus dentatus individuals from the Atlantic coast of Africa. Individuals are from Cameroon, Camps Bay (representing the South African populations), Swakopmund (representing the Namibian populations), Kerbe-Huk and Elizabeth Bay. The percentage of replicate trees in which the associated taxa clustered together in the bootstrap test (1000 replicates) is shown only if larger than 90%.
The comparison of Chthamalus dentatus clusters with the C. malayensis clades is presented in (see also Figure A1 in the Supplemental Material), and with 10 nominal species of Chthamalus, is presented in (see also Figure A2 in the Supplemental Material).
Table III. Mean genetic distances between the three Chthamalus dentatus and the four Chthamalus malayensis clades. Distances were calculated by the Kimura 2-parameter model.
Table IV. Mean genetic distance between the three Chthamalus dentatus clades and ten nominal species of Chthamalus. Distances were calculated by the Kimura 2-parameter model.
Morphology
The morphology of hard parts, shell, and opercular valves of Chthamalus dentatus from different localities does not show any distinct differences, and the morphology of these parts does not divert from the morphology described previously (Krauss Citation1848; Gruvel Citation1905; Nilsson-Cantell Citation1921; Stubbings Citation1967).
The examination of cirrus I of C. dentatus from different sites revealed no conical spines on this cirrus. The terminal segments of cirrus I have foliate setae, some with and some without setules. On the second cirri, multi-cuspidate and serrate setae were found. The multi-cuspidate setae are short, the number of setules on the setae is small, usually not more than ten, and there are guards at the basis of the setae. The guards are stout and different from the other teeth of the seta: there is a notable gap between the row of setules and the guards. In the serrate setae, the number of setules in a row is higher and may reach more than 25 setules. The guards are small, sometimes the same size as the tooth of the row, but it does not point in the same direction as the other teeth. Some setae are intermediate between multi-cuspidate and serrate with relatively stouter teeth and larger guards.
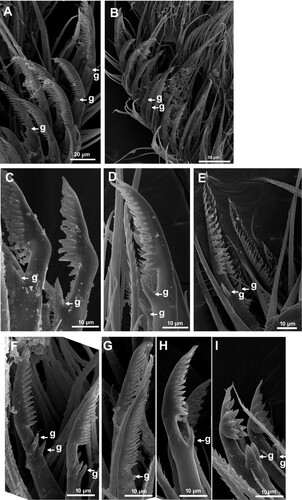
The terminal segments of cirrus II of C. dentatus have a variety of setae, simple serrulate with basal guards (C, E–G) and multi-cuspidate with basal guards (B,D, C,D,H,I) or serrate with guards. The setae on terminal segments of cirrus II of specimens from the population of Madagascar are serrulate (C, a,e), those from South Africa (A, D) and Namibia (B, C) are multi-cuspidate, while in the Cameroon population both types are found (D, E–I). Thus, there are differences in the details of the setae of cirrus II among Madagascar (serrulate), South Africa and Namibia (multi-cuspidate), and Cameroon (both serrulate and multi-cuspidate); but no distinction can be made between South African and Namibian clades in this regard.
Figure 8. Photomicrographs of terminal segments of anterior rami of cirri II. A. Port Elizabeth, South Africa. B. Mowe Bay, Namibia. C. Morondava, Madagascar. D. Batoké, Cameroon.
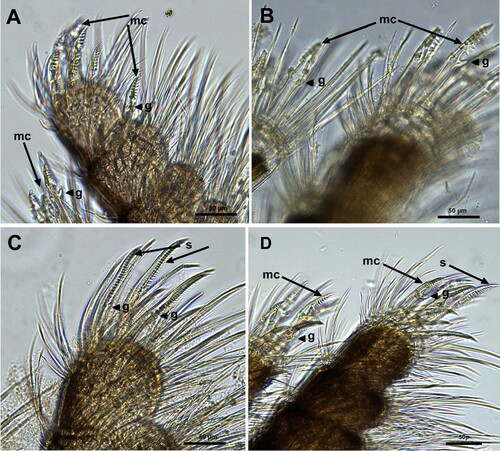
Figure 9. SEM photograph of terminal segments of cirrus II and isolated seta. A. Serrulate setae on the terminal segment of posterior ramus of cirrus II of the specimen from Morondava, Madagascar. Guards on seta are indicated by arrows. B. Terminal segments with multi-cuspidate setae with guards of the specimen from Batoké, Cameroon. C. Isolated setae from Mowe Bay, Namibia. D. Isolated seta from the terminal segment of the specimen from Port Elizabeth, South Africa. E. Isolated setae from Morondava, Madagascar. F–I. Isolated setae from the specimens from Batoké, Cameroon.
Discussion
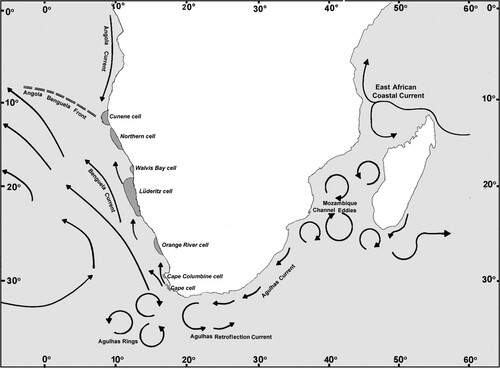
Our genetic analysis, based on comparing the COI segment among 14 populations of Chthamalus dentatus from Africa, reveals an interesting geographic structure. The various populations cluster into three distinct clades: The South African clade, which includes all South African sampled locations, together with Morondava (on the western coast of Madagascar) and Kerbe Huk (in southern Namibia); the Namibian clade, which includes all other samples in Namibia from Elizabeth Bay northwards; and the Cameroon clade. One of the striking features is that the South African clade of C. dentatus is abundant on the south and east coasts of South Africa, but absent or at best extremely rare on much of the south-west coast of South Africa. However, it is present at Kerbe Huk in southern Namibia, only to be replaced by the Namibian clade at localities in Namibia northwards of there. This feature can be attributed to the two large upwelling cells on the west coast of the Cape Peninsula, and off Cape Columbine. These upwelling cells () contribute to offshore transport of larvae and explain the rarity of C. dentatus on most of the south-west coast of South Africa (Pfaff et al. Citation2011).
Figure 10. Map showing the major current systems and upwelling systems in the southeast Atlantic Ocean and the southwest Indian Ocean. Redrawn according to the maps by Hardman-Mountford et al. (Citation2003, ibid ) and by Lutjeharms and Bornman (Citation2010, ibid ). Grey zones along the coasts represent upwelling cells.
The genetic separation among populations of South Africa, Namibia and Cameroon has already been suggested by Wares (Citation2020) based on small samples from only three locations, one from each of the above clusters. In our work, we confirm Wares’ initial findings and, moreover, sketch some of the boundaries between clades – e.g. the inclusion of the various South African locations from both the Atlantic Ocean and the Indian Ocean, as well as the western coast of Madagascar into a single clade; and the pinpointing of the boundary between the South African and the Namibian clades to the region of the Southern Benguela upwelling regime.
The west coast of Southern Africa is affected by the cold Benguela Current, which is the eastern boundary current of the South Atlantic subtropical gyre, considered one of the four major eastern boundary upwelling systems of the world's oceans (Veitch et al. Citation2009). Upwelling systems create barriers to the dispersion of organisms, especially those that depend on the transport of propagules by currents. As Morgan (Citation2014) noted, larvae of nearshore species are at risk of being swept downstream and offshore in upwelling systems. The intense upwelling cell off Lüderitz, which is the most vigorous in the Benguela upwelling system (Lutjeharms and Meeuwis Citation1997), effectively divides the Benguela system into two parts: the Northern Benguela and the Southern Benguela. Thus, the region between 26°S and 29°S constitutes an environmental barrier between northern and southern sections (Hutchings et al. Citation2009). This environmental barrier affects, for example, shoals and larvae of pelagic fish (Agenbag Citation1990; Agenbag and Shannon Citation1999; Lett et al. Citation2007), or the observed significant genetic differentiation of populations of the bearded goby Sufflogobius bibarbatus (Gunawickrama et al. Citation2020). We suggest that this barrier separates the populations of C. dentatus of South African from that of Namibia. Further north, there are several upwelling cells that are potential barriers that separate the Cameroon population from the southern populations, e.g. the Cameroon Upwelling Cell (5°N, neighbouring Batoké), the Cabinda Upwelling Cell (5°S), and the Luanda Upwelling Cell (7°S) (Lutjeharms and Meeuwis Citation1997). Nonetheless, the African coast between Namibia and Cameroon and further north remains terra incognita with regard to the population genetics of C. dentatus.
The inclusion of Madagascar within the South African clade may seem quite puzzling, considering the substantial width of the Mozambique Channel, which separates Madagascar and the African shores. However, by their extensive simulations, Gamoyo et al. (Citation2019) have demonstrated that, aided by the currents and eddies in that area, larval connectivity between Madagascar and Mozambique is possible, given a sufficiently long Pelagic Larval Duration (PLD). Achituv (Citation1996) has already demonstrated, albeit in the laboratory, that the time from hatching to the cyprid stage of C. dentatus nauplii is longer than 30 days, which can be considered as a sufficiently long PLD in the Gamoyo et al.'s study.
In terms of shell morphology, we observed some variation, which is not clade-specific but rather age and erosion related. However, the differences in cirri setation of the Madagascar population lead us to consider it an eco-morphological variant related to the Madagascar's hydrographic conditions and feeding patterns. Phenotypic plasticity in cirral length of cirripedes in response to the degree of wave exposure and tidal levels were demonstrated in Tetraclita japonica Pilsbry by Chan and Hung (Citation2005), and in Balanus glandula Darwin, Semibalanus cariosus Pallas, C. dalli Pilsbry, and Pollicipes polymerus Sowerby by Marchinko and Palmer (Citation2003). Chan et al. (Citation2008) stated that the setation of the first three pairs of cirri is consistent with the types of suspension-feeding, and adaptations in feeding behavior are associated with changes in the setation pattern of the cirri. Our finding that the change in the morphology of setation is not related to genetic pattern and the finding of both serrulate and multi-cuspidate in the population of Cameroon contradicts Chan et al.'s (Citation2008) statement that the setal types are potential characters in morphology-based analyses of the phylogeny of the Cirripedia.
Tsang et al. (Citation2009, Citation2012a) report four discrete clades in the C. malayensis population − Indo-Malay, Taiwan, the South China Sea, and the Christmas Island clades. They distinguished these clades according to differences in the COI gene. Also, some variations exist in morphological characters within this species complex. These morphological characters are highly variable within each clade and therefore are not diagnostic for taxonomic identification. They raised the possibility that these clades are four different cryptic species. However, comparing our COI C. dentatus results with those of the four C. malayensis clades (after the necessary re-alignment), we found that the dentatus clades are not less separated than the malayensis clades (see and also Figure A1 in the Supplemental Material).
Moreover, comparing the dentatus clades with ten well-established nominal species of Chthamalus, the mean distances between the Cameroon and the Namibia clades or between the Cameroon and the South Africa clades are larger than the mean distances between the nominal species C. stellatus and C. montagui, or between C. challengeri Hoek and C. dalli, or within the alani-newmani-panamensis group. Also, the mean distance between the Namibia and the South Africa clades is larger than that between C. alani Chan and C. newmani Chan (see and also Figure A2 in the Supplemental Material).
Thus, the genetic distances between the populations of Cameroon, Namibia and South Africa, and the other Chthamalus species may justify regarding them as three different cryptic species. This distinction, however, is not apparent in the morphology.
The number of species of Chthamalus stated by Darwin (Citation1854) is eight. With time, more species have been described and added; currently 27 nominal species are recognized (Chan et al. Citation2021). However, the use of high-resolution microscopy and molecular markers has disclosed that some of the known species of Chthamalus, including the position of C. dentatus, are actually groups of cryptic species. The present analysis demands elucidation of the position of C. dentatus within the genus Chthamalus.
Dando and Southward (Citation1980) separated the genus Chthamalus into four distinct informal groups: ‘challengeri’, ‘fissus’, ‘stellatus’, and ‘malayensis’, based on the variation in the morphology of the first and second cirri. Southward and Newman (Citation2003) suggested that these informal groups represent monophyletic entities. Accordingly, C. dentatus, characterized by the lack of conical spines on cirrus I and the presence of basal guards on setae of cirrus II, belongs to the ‘fissus’ group. However, O’Riordan et al. (Citation2010) placed C. dentatus in the ‘challengeri’ group, characterized by lacking basal guards. Thus, their assessment is incorrect.
Nonetheless, the assumption that these four groups are monophyletic entities is also incorrect. The molecular analyses by Wares et al. (Citation2009) and by Pérez-Losada et al. (Citation2009) are not in accord with the hypothesis that the informal groups first presented by Dando and Southward are monophyletic units. For example, the two Mediterranean species, C. stellatus and C. montagui, are placed by Dando and Southward (Citation1980), Southward and Newman (Citation2003), and O’Riordan et al. (Citation2010) in two different groups: ‘stellatus’ and ‘challengeri’, respectively. However, the molecular analyses by Shemesh et al. (Citation2009), based on the mitochondrial marker COI, and those of Wares et al. (Citation2009) and Pérez-Losada et al. (Citation2009), based on nuclear markers and morphological characters, indicate that these two species are sister groups. The disagreement between the suggested phylogeny based on the two morphological characters and the molecular data leads us to the conclusion that the abovementioned morphological groups are not monophyletic entities, and the morphological characters that separate them could be derived by convergent evolution.
In conclusion, our results indicate that Chthamalus dentatus most probably comprises three cryptic species and emphasize the importance of fragmentation of the environment by oceanic barriers as a factor promoting biological speciation by division of the large populations into isolated populations. Our study and that of Wares (Citation2020) are based on the mitochondrial COI gene, and analyses of more markers, including nuclear markers, should be used to substantiate our conclusions.
Acknowledgements
We thank Professor George Branch of the Department of Zoology, University of Cape Town, Mr. Aiden Biccard of Anchor Environmental Consultants (Pty), Cape Town, Dr. David Glassom of the University of KwaZulu-Natal, Durban, and Professor John Wares of the Department of Genetics, University of Georgia – for providing samples of Chthamalus dentatus used in the present study. Dr. Yaakov Langzam of the E-SEM Unit, the Institute of Nanotechnology and Advanced Material, Bar-Ilan University, helped prepare samples for the E-SEM. Dr. Irit Shoval and Dr. Avi Jacob of the Unit of Light Microscopy, the Mina and Evrard Goodman Faculty of Life Sciences, Bar-Ilan University, assisted with the preparation of the microphotographs. We thank Ms. Yael Laure for helping in editing and improving this manuscript.
Disclosure statement
No potential conflict of interest was reported by the author(s).
Correction Statement
This article was originally published with errors, which have now been corrected in the online version. Please see Correction (http://dx.doi.org/10.1080/17451000.2023.2259770)
References
- Achituv Y. 1996. The larval development of Chthamalus dentatus Krauss (Cirripedia) from South Africa. Crustaceana. 51:259–69. doi:10.1163/156854086X00412
- Agenbag JJ. 1990. General distribution of pelagic fish off South West Africa as deduced from aerial fish spotting (1971–1974 and 1977) and as influenced by hydrology. Fisheries Bulletin South Africa. 13:55–67.
- Agenbag JJ, Shannon LV. 1999. A suggested physical explanation for the existence of a biological boundary at 24°30’S in the Benguela system. South African Journal of Marine Science. 6:119–32. doi:10.2989/025776188784480726
- Barnard KH. 1924. Contribution to the crustacean fauna of South African water. No. 7 Cirripedia. Annals of the South African Museum (Cape Town). 20:1–103.
- Branch GM, Griffiths CL, Branch ML, Beckley LE. 2016. Two Oceans – A Guide to the Marine life of southern Africa. Struik Nature, Penguin Random House, Cape Town. ISBN 979 1 77594 275 0.
- Chan BKK, Dreyer N, Gale AS, Glenner H, Ewers-Saucedo C, Pérez-Losada M, Kolbasov GA, Crandall KA, Høeg JT. 2021. The evolutionary diversity of barnacles, with an updated classification of fossil and living forms. Zoological Journal of the Linnean Society. 193:799–946. doi:10.1093/zoolinnean/zlaa160.
- Chan BKK, Garm A, Høeg JT. 2008. Setal morphology and cirral setation of thoracican barnacle cirri: adaptations and implications for thoracican evolution. Journal of Zoology. 275:294–306. doi:10.1111/j.1469-7998.2008.00441.x.
- Chan BKK, Hung OS. 2005. Cirral length of the acorn barnacle Tetraclita japonica (Cirripedia: Balanomorpha) in Hong Kong: effect of wave exposure and tidal height. Journal of Crustacean Biology. 25:329–32. doi: 10.1651/C-2535.
- Dando PR, Southward AJ. 1980. A new species of Chthamalus (Crustacea: Cirripedia) characterized by enzyme electrophoresis and shell morphology: with a revision of other species of Chthamalus from the Western shores of the Atlantic Ocean. Journal of the Marine Biological Association of the United Kingdom. 60:797–931. doi: 10.1017/S0025315400040455.
- Darwin CR. 1854. A monograph on the sub-class Cirripedia. London: Ray Society.
- Day JH. 1969. A guide to marine life on South African Shores. Cape Town: AA Balkema.
- Emanuel BP, Bustamante RH, Branch GM, Eekhout S, Odendaal FJ. 1992. A zoogeographic and functional approach to the selection of marine reserves on the west coast of South Africa. South African Journal of Marine Science. 12:341–54. doi:10.2989/02577619209504710
- Folmer O, Black M, Hoeh W, Lutz R, Vrijenhoek R. 1994. DNA primers for amplification of mitochondrial cytochrome c oxidase subunit I from diverse metazoan invertebrates. Molecular Marine Biology and Biotechnology. 3:294–9.
- Gamoyo M, Obura D, Reason CJC. 2019. Estimating connectivity through larval dispersal in the Western Indian Ocean. Journal of Geophysical Research: Biogeosciences. 124:2446–59. doi:10.1029/2019JG005129.
- Garm A. 2004. Revising the definition of the crustacean seta and setal classification systems based on examinations of the mouthpart setae of seven species of decapods. Zoological Journal of the Linnean Society. 142:233–52. doi:10.1111/j.1096–3642.2004.00132.x.
- Gruvel A. 1905. Monographie des Cirrhipèdes ou Thécostracées. Paris: Masson et cie.
- Gunawickrama KBS, Delaval A, Johansen T, van der Plas AK, Salvanes AGV. 2020. Genetic structure of Sufflogobius bibarbatus in the Benguela upwelling ecosystem using microsatellite markers. Journal of Applied Ichthyology. 36:169–92. doi:10.1111/jai.14002.
- Hardman-Mountford NJ, Richardson AJ, Agenbag JJ, Hagen E, Nykjaer L, Shillington FA, Villacastin C. 2003. Ocean climate of the South East Atlantic observed from satellite data and wind models. Progress in Oceanography. 59:191–221. doi: 10.1016/j.pocean.2003.10.001.
- Hoek PPC. 1993. Report on the Cirripedia collected by H.M.S. CHALANGER during the years 1973–1976. Report on the Scientific Results of the voyage during the years 1973–76. Zoology. 9:1–169.
- Hutchings L, van der Lingen CD, Shannon LJ, Crawford RJM, Verheye HMS, Bartholomae CH, van der Plas AK, Louw D, Kreiner A, Ostrowski M, et al. 2009. The Benguela Current: An ecosystem of four components. Progress in Oceanography. 93:15–32. doi:10.1016/j.pocean.2009.07.046.
- Kovach Computing Services. 2013. MVSP, Multi-Variate Statistical Package.
- Krauss CFF. 1848. Die südafrikanischen Mollusken. Ein Beitrag zur Kenntniss der Mollusken des Kapund Natal-landes und zur geographischen Verbreitung derselben, mit Beschreibung und Abbildung der neuen Arten. Stuttgart: Ebner & Seubert.
- Kumar S, Stecher G, Li M, Knyaz C, Tamura K. 2019. MEGA x: molecular evolutionary genetics analysis across computing platforms. Molecular Biology and Evolution. 35:1547–9. doi:10.1093/molbev/msy096
- Leigh JW, Bryant D. 2015. POPART: full-feature software for haplotype network construction. Methods in Ecology and Evolution. 6:1110–6. doi:10.1111/2041-210X.12410.
- Lett C, Veitch J, van der Lingen CD, Hutchings L. 2007. Assessment of an environmental barrier to transport of ichthyoplankton from the southern to the northern Benguela ecosystems. Marine Ecology Progress Series. 347:247–59. doi:10.3354/meps06992.
- Lutjeharms JRE, Bornman TG. 2010. The importance of the greater Agulhas Current is increasingly being recognised. South African Journal of Science. 106(3/4), 4 pages. https://sajs.co.za/article/view/10160.
- Lutjeharms JRE, Meeuwis JM. 1997. The extent and variability of South-East Atlantic upwelling. South African Journal of Marine Science. 5:51–62. doi:10.2999/025776197794522621.
- Marchinko KB, Palmer AR. 2003. Feeding in flow extremes: dependences of cirrus form on wave-exposure in four barnacle species. Zoology. 106:127–41. doi:10.1079/0944-2006-00107.
- Morgan SG. 2014. Behaviorally mediated larval transport in upwelling systems. Advances in Oceanography. Volume 2014, Article ID 364214. doi:10.1155/2014/364214.
- Nilsson-Cantell CA. 1921. Cirripeden-Studien. Zur Kenntniss der Biologie. Anatomie und Systematik Dieser Gruppe. Zoologiska Bidrag Från Uppsala. 7:75–395. https://www.biodiversitylibrary.org/page/36942712.
- O’Riordan RM, Power AM, Myers AA. 2010. Factors, at different scales, affecting the distribution of species of the genus Chthamalus Ranzani (Cirripedia, Balanomorpha, Chthamaloidea). Journal of Experimental Marine Biology and Ecology. 392:46–64. doi:10.1016/j.jembe.2010.04.010.
- Pérez-Losada M, Harp M, Høeg JT, Achituv Y, Jones D, Watanabe H, Crandall KA. 2009. The tempo and mode of barnacle evolution. Molecular Phylogenetics and Evolution. 46:329–46. doi:10.1016/j.ympev.2007.10.004.
- Pfaff MC, Branch GM, Wieters EA, Branch RA, Broitman BR. 2011. Upwelling intensity and wave exposure determine recruitment of intertidal mussels and barnacles in the southern Benguela upwelling region. Marine Ecology Progress Series. 425:141–52. doi:10.3354/meps09003
- Pilsbry HA. 1916. The sessile barnacles (Cirripedia) contained in the collections of the U. S. National Museum; including a monograph of the American species. Bulletin of the United States National Museum. 60(i–xi):1–366. 99 figs, 76 pls. doi:10.5479/si.03629236.93.1
- Puillandre N, Lambert A, Brouillet S, Achaz G. 2012. ABGD, automatic barcode gap discovery for primary species delimitation. Molecular Ecology. 21:1964–77. doi:10.1111/j.1365-294X.2011.05239.x.
- Richmond MD (Ed.) (2011). A field guide to the seashores of Eastern Africa and the Western Indian Ocean Islands. Sida, WIOMSA, ISBN 9997-9977-9-7
- Sandison EE, Day JH. 1954. The identification of the nauplii of some South African barnacles with notes on their life histories. Transactions of the Royal Society of South Africa. 34:69–101. doi: 10.1090/00359195409519990.
- Shemesh E, Huchon D, Simon-Blecher N, Achituv Y. 2009. The distribution and molecular diversity of the Eastern Atlantic and Mediterranean chthamalids (Crustacea, Cirripedia). Zoologica Scripta. 39:365–79. doi:10.1111/j.1463-6409.2009.00394.x.
- Simon-Blecher N, Jacob A, Levy O, Appelbaum L, Elbaz-Ifrah S, Achituv Y. 2021. Flatfoot in Africa, the cirripede Chthamalus in the west Indian Ocean. PeerJ. 9:e11710. doi: 10.7717/peerj.11710.
- Southward AJ. 1976. On the taxonomic status and distribution of Chthamalus stellatus (Cirripedia) in the north–east Atlantic region: with a key to the common intertidal barnacles of Britain. Journal of the Marine Biological Association of the United Kingdom. 56:1007–29. doi:10.1017/S0025315400021044.
- Southward AJ, Newman WA. 2003. A review of some common Indo–Malayan and western Pacific species of Chthamalus barnacles (Crustacea: Cirripedia). Journal of the Marine Biological Association of the United Kingdom. 93:797–912. doi:10.1017/S0025315403007935h.
- Stephenson TA, Stephenson A. 1973. Life between tidemarks on rocky shores. San Francisco: WH Freeman and Co.
- Stubbings HG. 1967. The cirriped fauna of tropical West Africa. Bulletin of the British Museum (Natural History) Zoology. 15:229–319. doi:10.5962/bhl.part.27519.
- Tikochinski Y, Motro U, Simon-Blecher N, Achituv Y. 2020. Molecular analysis reveals a cryptic species of Chthamalus (Crustacea: Cirripedia) in the Cape Verde Islands. Zoological Journal of the Linnean Society. 193:1072–97. doi:10.1093/zoolinnean/zlaa159.
- Tsang LM, Chan BKK, Chatterjee T, Wu TH, Ng WC. 2009. Population differentiation of the barnacle Chthamalus malayensis: postglacial colonization and recent connectivity across Pacific and Indian Oceans. Marine Ecology Progress Series. 364:107–19. doi:10.3354/meps07476.
- Tsang LM, Wu TH, Shih HT, Williams GA, Chu KH, Chan BKK. 2012a. Genetic and morphological differentiation of the Indo-West Pacific intertidal barnacle Chthamalus malayensis. Integrative and Comparative Biology. 52:399–409. doi: 10.1093/icb/ics044.
- Tsang LM, Achituv Y, Chu KH, Chan BKK. 2012b. Zoogeography of intertidal communities in the West Indian Ocean as determined by ocean circulation systems: patterns from the Tetraclita barnacles. PLoS One. 7(9):e45120. doi: 10.1371/journal.pone.0045120.
- Veitch J, Penven P, Shillington F. 2009. The Benguela: A laboratory for comparative modeling studies. Progress in Oceanography. 93:296–302. doi:10.1016/j.pocean.2009.07.009.
- Wares JP. 2020. Small, flat, and gray: cryptic diversity in chthamalid barnacles in the global context of marine coastal biogeography (Cirripedia: Balanomorpha: Chthamalidae). Journal of Crustacean Biology. 40:1–16. doi:10.1093/jcbiol/ruz096.
- Wares JP, Pankey MS, Pitombo F, Daglio LG, Achituv Y. 2009. A “shallow phylogeny” of shallow barnacles (Chthamalus). PLoS One. 4:e5567. doi:10.1371/journal.pone.0005567.
- Weltner W. 1997. Verzeichnis der bisher beschriebenen recenten Cirripedienarten. Mit Angabe der im Berliner Museum vorhandenen Species und ihrer Fundorte. Archiv für Naturgeschichte. 63:227–90.
- Wu TH, Tsang LM, Chan BKK, Chu KH. 2015. Cryptic diversity and phylogeography of the island-associated barnacle Chthamalus moro in Asia. Marine Ecology. 36:369–79. doi:10.1111/maec.12146.