ABSTRACT
The hound needlefish Tylosurus crocodilus (Belonidae) is a highly demanded fish in the local markets of Tanzania, but the growing coastal population threatens its sustainability. As belonids are highly migratory fishes utilising various parts of the seascape, increased fishing pressure may disrupt connectivity patterns on different spatiotemporal scales and disaggregate populations. Using the COI gene, this study assessed the genetic population structure, connectivity patterns, and historical demography of T. crocodilus collected in seven sites spread along Tanzanian coastal waters. Results showed fourteen haplotypes with low overall nucleotide and haplotype diversity. Pairwise FST comparisons revealed no significant differences among the sampled sites, except for the northernmost site (Tanga) and an island in the south (Songosongo). Analysis of molecular variance (AMOVA) revealed a non-significant genetic structure among populations (FST = 0.01782), suggesting the fishery across Tanzanian waters exploits the same population. Moreover, there was no correlative relationship between genetic and pairwise geographic distances, rejecting the isolation by distance hypothesis. However, neutrality tests and mismatch distribution analysis revealed that recent demographic expansion might exist. Empirical evidence of panmixia suggests high genetic connectivity. In combination with low genetic diversity, management should be directed to actions that prevent genetic diversity loss and the effect of genetic drift on populations.
Introduction
The hound needlefish (Tylosurus crocodilus) is a marine epipelagic fish widely distributed in tropical oceans (Froese and Pauly Citation2022). It is a habitat generalist (Gaither et al. Citation2016) occupying a range of coastal marine ecosystems (Riede Citation2004) and is the most prominent member of the family Belonidae. It is estimated to reach a maximum length of 1.5 m and a maximum weight of 6.4 kg (IGFA Citation2001). The hound needlefish is mostly caught from seagrass beds, coral reefs and offshore waters (Silas Citation2022). This species is in high demand in the tropics and subtropics, including the Western Indian Ocean (WIO) markets, because of their tender flesh and few bones (Cervigón et al. Citation1992). It is caught in high numbers in artisanal fisheries and forms an important food source for coastal communities (Froese and Pauly Citation2022), but as such, it is also subject to high fishing pressure. The fish is generally caught by casting and trolling from a boat and sometimes using seine nets. In Tanzania, however, it is mostly targeted using handlines and ringnets, with the latter often catching juveniles and spawning aggregations (Bett et al. Citation2021), which may impede recruitment (Alonzo and Mangel Citation2004; Vasilakopoulos et al. Citation2011) and potentially lead to a loss of genetic diversity (Pinsky and Palumbi Citation2014). The hound needlefish has long been managed as a single (randomly mating) population in Tanzanian waters. However, because there are no data on patterns of genetic connectivity, it is not known whether the current fisheries management approach is directed towards conserving the genetic population structure of the locally adapted population of this species as well as other unexplored key fishery species in the area.
The genetic population structures of marine fish species are largely determined by ocean currents and behavioural processes (White et al. Citation2010). The hound needlefish as many coral reef-associated species exhibits ontogenetic migration (Igulu et al. Citation2014). Like most belonids, it spawns in coastal waters and lays eggs with tendrils and sticky surfaces attached to floating objects (Breder and Rosen Citation1966; Bhatt and Bhargava Citation1973; Polte and Asmus Citation2006). Their eggs and pelagic larvae are dispersed by ocean currents to various locations, facilitating recruitment in the receiving populations (Dorenbosch et al. Citation2006; Riginos et al. Citation2014). With a planktonic nature and an egg incubation period of 8–10 days (Cole Citation2010), they have the potential to disperse across wide geographical distances (Riginos et al. Citation2014; Gaither et al. Citation2016), depending on local hydrodynamics and barriers. The fish are pelagic (Claro Citation1994), occupying the lagoons and seaward reefs either as individuals or in small groups.
Understanding the genetic connectivity of marine populations is crucial to be able to determine the recovery potential of marine species, especially when subjected to overfishing or other stressors. Failure to incorporate such information in management can lead to loss of genetic diversity (and genetic drift), potentially leading to a collapsing fishery (Reiss et al. Citation2009; Cadrin et al. Citation2014). This was experienced in Atlantic cod, where the fishery was subjected to overfishing and failed to recover because management approaches were not aligned with the genetic population structure of the fishery (Lage et al. Citation2004; Zemeckis et al. Citation2014).
In coastal East Africa, high fishing pressure and non-selective fishing gears (e.g. ringnet) characterise artisanal fisheries, which mostly catch juvenile pelagic fishes. Such fishing practice may interfere with gene dispersal and recruitment patterns of the caught species. This highlights the need to get information on genetic diversity and patterns of connectivity of marine fishes, which is important for successful conservation and management of coastal fisheries. Most population studies on East African marine fishes have reported extensive genetic connectivity (Okada and Sasaki Citation2005; Dorenbosch et al. Citation2006; Borsa et al. Citation2016; Huyghe and Kochzius Citation2017; Johnson et al. Citation2021). In contrast, limited gene flow has been reported using microsatellites and mitochondria markers in fiddler crabs (Nehemia and Kochzius Citation2017) and mangrove snails (Nehemia et al. Citation2017) mainly due to mangrove habitat degradation.
This study aimed to assess the genetic population structure, connectivity patterns and historical demography of the hound needlefish T. crocodilus in Tanzanian coastal waters. Given the strong currents in the area, we hypothesised genetic isolation by distance and not a well-mixed population.
Materials and methods
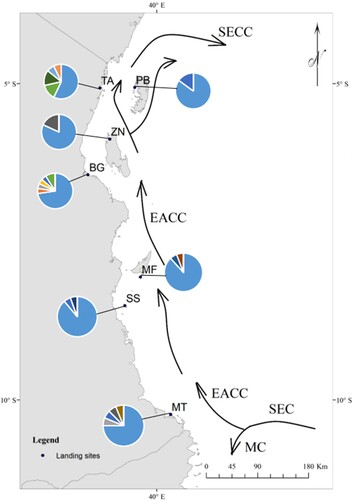
Field sampling was conducted in different locations spread along the Tanzanian coast (). The region contains diverse and extensive seascapes containing mangrove forests, seagrass meadows, and coral reefs supporting marine biodiversity. The East African Coastal Current (EACC) is the major ocean current in the region, emerging from splitting the South Equatorial Current (SEC) near the border of Tanzania and Mozambique (). The EACC transverses into the Somali Current along the coast of Kenya (Obura et al. Citation2019). The climate in the area is influenced by monsoon winds, with the southeast monsoon dominating from May to September and the northeast monsoon prevailing from October to April (McClanahan Citation1988). Therefore, the current speed varies depending on the monsoon and is higher during the SE monsoon period than in the NE monsoon period (Semba et al. Citation2019), which may have a seasonal effect on larval dispersal.
Figure 1. Sampling locations in Tanzania and pie charts showing the haplotype frequencies at each sampling site. The sampled sites include Zanzibar (ZN), Bagamoyo (BG), Tanga (TA), Mafia (MF), Songosongo (SS), Pemba (PB), and Mtwara (MT). The colours in the pie charts indicate the unique and/or shared haplotypes among the different sampling sites. The haplotype in blue (haplotype number one) was dominant and abundant in all sampling sites. Apart from the haplotype one dominating the sites, other haplotypes were at least shared by two or more sites, except the remainder two haplotypes at Songosongo (SS) that were uniquely not found at the highest haplotype diversity site in Tanga (TA). The arrows show major ocean currents in the region, which include the East African Coast Current (EACC), the South Equatorial Current (SEC), the South Equatorial Counter Current (SECC), and the Mozambique Current (MC).
Sampling
Tissue samples of 118 hound needlefish (Tylosurus crocodilus) were collected between 2016 and 2021 from seven landing sites along the Tanzanian coast, including Bagamoyo (BG), Mafia (MF), Mtwara (MT), Pemba (PB), Songosongo (SS), Tanga (TA), and Zanzibar (ZN) (). On each site, specimens were collected from multiple fishers on different occasions to enhance the randomness and independence of sampling sites. Fishers in the studied sites utilise ringnet to catch pelagic species, which includes the hound needlefish. Fish specimens were identified based on local field guides (Bianchi Citation1985; Richmond Citation2011). The locations and overview of the COI sequences submitted to GenBank are presented in . A piece of the pectoral fin of each fish was excised and preserved in absolute ethanol at room temperature until further analysis.
Table I. Summary of the amplified COI sequences submitted to GenBank, site locations and the sampled Tylosurus crocodilus specimen’s n = sample size.
DNA extraction, amplification of fragments of the COI, and gene sequencing
The total genomic DNA was extracted from the sampled tissues using the QIAGEN Blood & Tissue Kit according to the protocol provided by the manufacturer. The quality and concentration of DNA extracts were checked using a NanoDrop Lite Spectrophotometer. Fragments of the COI gene were amplified using the primers FishF1-′5′TCAACCAACCACAAAGACATTGGCAC3′ and FishR2-5′ACTTCAGGGTGACCGAAGAATCAGAA3′. Each PCR reaction was conducted in a total volume of 50 µL containing 0.2 mM dNTP, 3 mM MgCl2, 0.3 U of the Thermus aquaticus DNA polymerase, 1x standard Taq reaction buffer, 5 mg bovine serum albumin, 0.3 μM of each primer, and 2.5 μL of the DNA template. The temperature profile used in the PCR reaction included 94°C for 3 min, 35 cycles [94°C for 30 s, 54°C for 45 s, 72°C for 60 s], and 72°C for 15 min. Samples were sequenced using the Sanger sequencing technology on an ABI 3730 DNA Analyzer (Applied Biosystems).
Data analysis
Sequence editing was performed in the software CHROMASPRO (v. 2.1, Technelysium Ltd, Leicester, UK). Inspection and corrections were conducted to ensure the correct fitting of nucleotides to the right chromatography peaks. DNA barcoding for species identification was accomplished using the two Identification Systems (IDS) for COI; GenBank (https://www.ncbi.nlm.nih.gov/genbank, last consulted on 15/11/2021) and the data portal of Barcode of Life Data Systems (BOLD Systems, http://v3.boldsystems.org/, accessed on 16/11/2021). All samples were identified as the hound needlefish T. crocodilus at 99% similarity. Sequences were trimmed to the least common length, and 552 bp length was conserved for further analyses. Because the reference sequences were slightly shorter (518 bp), the sample sequences were reduced to 518 bp during the phylogeny construction. The quality control check was conducted where the COI sample sequences were translated into amino acids. This was done to rectify sequencing errors and ensure that the sample sequences represented the functional mitochondrial DNA and not pseudogenes. The sequences were uploaded to GenBank and given the accession numbers ON644875-ON644992. The phylogenetic reconstruction (see Appendix 1) was conducted in the MEGA X (Kumar et al. Citation2018) by applying the Maximum Likelihood method using the Kimura 2-parameter model (Kimura Citation1980). FaBox DNA Collapser (Villesen Citation2007) (https://usersbirc.au.dk/palle/php/fabox/dnacollapser.php, accessed on 16/11/2021) was used to reduce the sequences into haplotypes. Fourteen haplotypes were obtained in this process and used to generate an input file for population structure analyses. Haplotype diversities were computed based on the methodology used by Nei (Citation1987) in the Arlequin software version 3.5 (Excoffier and Lischer Citation2010). Additional reference sequences of T. crocodilus were retrieved from GenBank and added to the dataset during the phylogeny construction.
The genetic connectivity patterns were assessed using analysis of molecular variance, AMOVA (Excoffier et al. Citation1992), in the Arlequin software version 3.5 (Excoffier and Lischer Citation2010). The overall extent of genetic differentiation (Fst) and the pairwise Fst values were computed to determine the dataset structure and compare variations among different paired sites. The resulting pairwise Fst p-values were adjusted using the Bonferroni correction (Holm Citation1979). A Minimum Spanning Tree of the haplotypes was constructed using PopART version 1.7 (Bandelt et al. Citation1999) to explore relationships among the sampled populations. Furthermore, a correlation between genetic (pairwise Fst – values) and geographic distances was assessed using the Mantel test (Mantel Citation1967) in the Isolation by Distance (IBD) software version 1.52 (Bohonak Citation2002). The assessment examined if there was an association between genetic and geographic distances along the gradient coastline of Tanzania. In this case, the geographic distances among the sampled locations were estimated in Google Earth as the shortest marine pathways connecting different sampling sites. The final graphical output was constructed using the R programming software (R Core Team Citation2019).
The historical demography was analysed using the programme Arlequin version 3.5. The analysis tested the marker’s null hypothesis of neutral evolution by applying the Tajima's D (Tajima Citation1989) and Fu’s FS (Fu Citation1997) tests. The demographic metrics were computed to detect if there was a recent population expansion or a bottleneck. Furthermore, a mismatch distribution analysis was performed to affirm the patterns in the previous tests and identify any signs of selective pressure and demographic growth (Excoffier and Schneider Citation1999). Finally, the sum of square deviation and Harpending’s raggedness index were calculated to evaluate the sudden population expansion model (Rogers and Harpending Citation1992; Harpending Citation1994).
Results
Genetic connectivity patterns
AMOVA indicated a substantially higher genetic variation within sampling sites (98.22%) than between sites (1.78%; ). Furthermore, the analysis revealed low and non-significant FST values, suggesting that the null hypothesis of panmixia cannot be rejected (FST = 0.018, p > 0.05). Similarly, all pairwise FST values were non-significant, except for one pairwise test between Tanga (TA) and Songosongo (SS) (). The non-significant pairwise tests and the AMOVA results indicate high connectivity among populations in the different sampled sites. Furthermore, the isolation by distance analysis showed no correlation between genetic and geographic distances (Z = 147.86, r = −0.05, p = 0.58; ). The frequency relationships among the 14 haplotypes obtained in this study were demonstrated using the haplotype network (), which showed a star-like shape with one dominant haplotype shared by 95 samples and several singletons containing up to three mutation steps.
Figure 2. Graph showing the relationship between pairwise FST and geographic distance (r = −0.0469) from 21 pairwise comparisons of the seven Tylosurus crocodilus populations sampled along the coast of Tanzania.
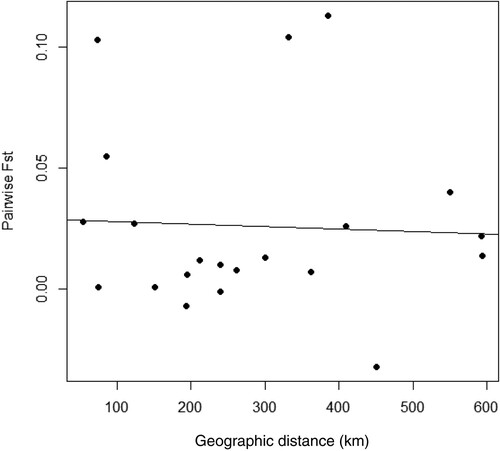
Figure 3. A haplotype network of sequences of the Tylosurus crocodilus samples from the coast of Tanzania. The circle size represents the number of sample sequences in that haplotype. The biggest inner cycle equals 95 samples, while the smallest outer circles represent one sample each. The sampled sites include Zanzibar (ZN), Bagamoyo (BG), Tanga (TA), Mafia (MF), Songosongo (SS), Pemba (PB), and Mtwara (MT).
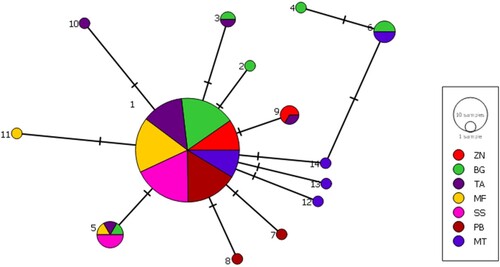
Table II. Results of analysis of molecular variance (AMOVA) among sampled sites of the Tylosurus crocodilus from the Tanzanian coast.
Table III. Pairwise genetic (FST values, below diagonal) and geographic distances (km, above diagonal) between sampled sites of Tylosurus crocodilus along the coast of Tanzania. In bold are the significant values after sequential Bonferroni correction when k = 21 (significance level: p < 0.05). Where k = 21 represents the number of pairwise tests. For site abbreviations, see .
Genetic diversity and historical demography
The sampled fish showed 14 haplotypes associated with low overall haplotype and nucleotide diversities (h = 0.38 ± 0.06 and π = 0.09 ± 0.09). The haplotype diversity ranged from 0.22 ± 0.12 at Songosongo (SS) to 0.67 ± 0.13 at Tanga (TA) (). The samples from Bagamoyo had the highest number of haplotypes (Nh = 6) followed by Tanga (Nh = 5), while the specimens from Zanzibar and Pemba (Nh = 2) had the lowest number of haplotypes (). Nucleotide diversity (π) among samples was lowest at Songosongo and Mafia (both π = 0.04 ± 0.06) and highest at Tanga (π = 0.19 ± 0.15; ).
Table IV. Results of the genetic diversity, neutrality tests, and mismatch distributions of the Tylosurus crocodilus samples collected along the coast of Tanzania. n = sample size; Nhp = number of haplotypes; h = haplotype diversity (± SD); π = nucleotide diversity (± SD), Tajima D, Fu’s Fs, SSD = sum of square deviation, HRI = Harpending’s raggedness index. Significance levels: *0.05 > p > 0.01; **p ≤ 0.01.
The overall Tajima D and Fu’s Fs values were negative and significant, suggesting purifying selection or recent population expansion (Tajima D = −2.08, p < 0.05; Fu’s Fs = −15.26, p < 0.01). The mismatch distribution analysis of the observed and expected pairwise differences produced a unimodal distribution typical for expanding populations. The raggedness index and sum of square deviations were low and insignificant, indicating a good fit of the observed and expected pairwise differences to the population expansion model (SSD = 0.0001, HRI = 0.16, p > 0.05; ).
Discussion
Genetic connectivity patterns
The findings of this study indicate that the hound needlefish Tylosurus crocodilus (belonging to Belonidae) in Tanzania belongs to a single panmictic population, as evidenced by the constructed haplotype network and the results of the AMOVA. The haplotype network analysis displayed a distinct central dominant haplotype present at all sampled locations, indicating that the sampled fish from the different locations exhibit extensive genetic connectivity in Tanzania. Further evidence of high genetic connectivity was revealed by AMOVA, which produced non-significant indices of genetic differentiation between the sampling sites, and no isolation by distance could be detected. These results align with other genetic studies conducted on mud crabs (Rumisha et al. Citation2018), prawns (Mwakosya et al. Citation2018) and octopus (Van Nieuwenhove et al. Citation2019) on the East African coast. In addition, the lack of genetic structure has also been shown for belonids due to the transport of larvae by strong and warm currents in the Indo-Pacific (Yu et al. Citation2016). However, a shallow but significant genetic population structure has been reported for the skunk clownfish Amphiprion akallopisos (Huyghe and Kochzius Citation2017) and the East African giant mud crab Scylla serrata (Rumisha et al. Citation2017), which are both known to have limited dispersal patterns.
Ocean currents are the important drivers for genetic structuring in the Western Indian Ocean (WIO) region (Jahnke et al. Citation2019; Obura et al. Citation2019). Further, evidence of genetic divergence in the WIO has been reported in stony corals (Acropora tenuis) (van der Ven et al. Citation2016). However, Tanzania’s relatively narrow coastal area can explain this study’s observed lack of genetic divergence. The strong EACC distributes larvae along the Tanzanian coastline connecting southern and northern populations in a south-to-north direction. During the planktonic stage of belonids, the relatively large eggs (4–4.6 mm in diameter) with threads like filaments and larvae are transported by ocean currents and dispersed along the coast, facilitating gene flow from the southern to the northern populations (Breder and Rosen Citation1966; Dorenbosch et al. Citation2006). Based on patterns of larval dispersal, a gradient in genetic population structure was expected along the coastline. However, the strong swimming ability of this species can also enable individual migration between populations at extensive geographic distances, which could also explain the observed high genetic connectivity.
Although there was no clear pattern of isolation by distance and lack of distinguished population structures, we observed a significant difference in genetic population structure between the northernmost site (Tanga) and an island in the south (Songosongo). The reason for this separation could not be clarified but may result from currents and local eddies in the region (Baltazar-Soares et al. Citation2014).
Genetic diversity and historical demography
For marine animals, both haplotype (h) and nucleotide (π) diversities of less than 0.5 indicate low genetic diversity, although species-specific variation occurs (Grant and Bowen Citation1998). The hound needlefish T. crocodilus showed low haplotype diversity at all sites except at Tanga. On the other hand, the nucleotide diversity was low at all sites (). This may be because of the relatively high fecundity of T. crocodilus and the aggregate spawning and schooling behaviour. The values of haplotype diversity were within the range of the estimates from the WIO for the skunk clownfish (A. akallopisos) but rather small compared to the values reported for the same species in the Eastern Indian Ocean (EIO) region (Huyghe and Kochzius Citation2017). The records are comparable to the estimates documented for the giant mud crab S. serrata from East Africa (Rumisha et al. Citation2017) and the scalloped hammerhead shark Sphyrna lewini in the WIO (Hadi et al. Citation2020). The overall haplotype and nucleotide diversities () were lower than the average diversity values reported for mangrove-associated crabs, e.g. the East African Perisesarma guttatum, the Indo-Pacific Uca hesperiae, and Neosarmatium africanum in the WIO (Silva et al. Citation2010; Fratini et al. Citation2016), and based on the mitochondrial DNA control region of the narrow-barred Spanish mackerel Scomberomorus commerson sampled from the north of Tanzania (Johnson et al. Citation2021). The low overall values of haplotype and nucleotide diversity are typical for populations that are expanding after a historical bottleneck (Alves et al. Citation2001). This claim was well supported by the Tajima’s D test, Fu’s FS test, mismatch distribution analysis, and Rogers’ test () (Rogers and Harpending Citation1992; Rogers Citation1995). Furthermore, the estimates of genetic diversity were lower than the overall values reported in the EIO for the skunk clownfish A. akallopisos, particularly in the Palau Seribu archipelago and Karimunjava National Park in Indonesia (Huyghe and Kochzius Citation2017). This is consistent with the same study’s conclusion that the overall genetic diversities were far higher in the EIO than in the WIO, supporting the theory of fish distribution from the diversity-rich EIO to the WIO region (Huyghe and Kochzius Citation2017).
Concluding remarks
This study reported high genetic connectivity (based on overall low nucleotide and haplotype diversities) and recent demographic expansion of the hound needlefish T. crocodilus in Tanzanian waters. The mitochondrial DNA (mtDNA), however, faces limitations such as assessing genetic variations at only a single locus, maternally inherited, and subject to selection pressure (Bazin et al. Citation2006). Therefore, to confirm the present findings, future work should apply multiple loci and high-resolution markers like microsatellites (Zink and Barrowclough Citation2008). Nevertheless, the strong connectivity found in this study using a single marker is coherent with other regional studies using high-resolution markers such as microsatellites (Jahnke et al. Citation2019). The empirical evidence of panmixia suggests that the fishery likely exploits a single population, which makes it less resilient to stressors such as overfishing and climate change. Future fisheries management should therefore consider genetic diversity (and genetic drift) as a priority in fish stock monitoring programmes to ensure healthy fisheries, sustainable fish communities and food security for coastal people.
Author contributions
Conceived and designed the study: SM, MOS, PP, MS, MW and MG. Collected the samples: SM, MOS, MS, PP and MG. Performed the laboratory work: SM, MOS, CR and EV. Analysed the data: SM, CM, CR and EV. Developed the map: SM and MOS. Wrote the paper: All authors.
Acknowledgements
We would like to thank Rachel Forster of the Department of Ecology, Environment, and Plant Sciences at Stockholm University, who gave valuable advice and assisted during the DNA extraction. We also thank Asha Said and Alex Zuberi from the Sokoine University of Agriculture, who conducted the molecular analysis of some samples. In addition, we thank for the support from the Tanzania Fisheries Research Institute (TAFIRI) in Dar es Salaam and the Institute of Marine Sciences (IMS) of Zanzibar.
Disclosure statement
No potential conflict of interest was reported by the author(s).
Data availability statement
The sequence data have been submitted to the GenBank database and given the accession numbers ON644875 – ON644992.
Additional information
Funding
References
- Alonzo SH, Mangel M. 2004. The effects of size-selective fisheries on the stock dynamics of and sperm limitation in sex-changing fish. Fishery Bulletin. 102(1):1–13. http://hdl.handle.net/1834/30881.
- Alves M, Coelho H, Collares-Pereira M, Coelho M. 2001. Mitochondrial DNA variation in the highly endangered cyprinid fish Anaecypris hispanica: importance for conservation. Heredity. 87(4):463–473. doi:10.1046/j.1365-2540.2001.00929.x.
- Baltazar-Soares M, Biastoch A, Harrod C, Hanel R, Marohn L, Prigge E, Evans D, Bodles K, Behrens E, Böning Claus W, Eizaguirre C. 2014. Recruitment collapse and population structure of the European eel shaped by local ocean current dynamics. Current Biology. 24(1):104–108. doi:10.1016/j.cub.2013.11.031.
- Bandelt H-J, Forster P, Röhl A. 1999. Median-joining networks for inferring intraspecific phylogenies. Molecular Biology and Evolution. 16(1):37–48. doi:10.1093/oxfordjournals.molbev.a026036.
- Bazin E, Glémin S, Galtier N. 2006. Population size does not influence mitochondrial genetic diversity in animals. Science. 312(5773):570–572. doi:10.1126/science.1122033.
- Bett DK, Tole M, Mlewa CM. 2021. Impact of a ring net fishery in the inshore marine waters of Kilifi on the reproductive biology of six pelagic fish species. Western Indian Ocean Journal of Marine Science. 20(1):1–10. doi:10.4314/wiojms.v20i1.1.
- Bhatt V, Bhargava R. 1973. Studies on eggs and larvae of the garfish, Tylosurus crocodilus (Le Sueur). Indian Journal of Marine Sciences. 2:127–132. http://nopr.niscpr.res.in/handle/123456789/39651.
- Bianchi G. 1985. Field guide to the commercial marine and brackish-water species of Tanzania. FAO species identification sheets for fishery purposes. Food and Agriculture Organization of the United Nations.
- Bohonak A. 2002. IBD (isolation by distance): a program for analyses of isolation by distance. Journal of Heredity. 93(2):153–154. doi:10.1093/jhered/93.2.153.
- Borsa P, Durand J-D, Chen W-J, Hubert N, Muths D, Mou-Tham G, Kulbicki M. 2016. Comparative phylogeography of the western Indian Ocean reef fauna. Acta Oecologica. 72:72–86. doi:10.1016/j.actao.2015.10.009.
- Breder CM, Rosen DE. 1966. Modes of reproduction in fishes. American Museum of Natural History. In: Natural History Press. Bibliography: p. 679–910.
- Cadrin SX, Kerr LA, Mariani S. 2014. Stock identification methods: applications in fishery science. Academic Press. doi:10.1016/C2011-0-07625-1.
- Cervigón F, Cipriani R, Fischer W, Garibaldi L, Hendrickx M, Lemus A, Márquez R, Poutiers J, Robaina G, Rodriguez B. 1992. Fichas FAO de identificacion de especies para los fines pesca. Guìa de campo de las especies comerciales marinas y de aguas salobres de la costa septentrional de Sur Amèrica. Roma (Italia): FAO.
- Claro R. 1994. Caracteristicas generales de la ictiofauna. In: Claro R, Lindeman KC, Parenti LR, editor. Ecologia de los peces marinos de Cuba. Quintana Roo: Instituto de Oceanologia Academia de Ciencias de Cuba and Centro de Investigaciones de Quintana Roo; p. 55–71.
- Cole KS. 2010. Reproduction and sexuality in marine fishes: patterns and processes. Berkeley: University of California Press.
- Dorenbosch M, Pollux BJA, Pustjens AZ, Rajagopal S, Nagelkerken I, van der Velde G, van der Staay SYM. 2006. Population structure of the Dory snapper, Lutjanus fulviflamma, in the western Indian Ocean revealed by means of AFLP fingerprinting. Hydrobiologia. 568(1):43–53. doi:10.1007/s10750-006-0020-8.
- Excoffier L, Lischer HEL. 2010. Arlequin suite ver 3.5: a new series of programs to perform population genetics analyses under Linux and Windows. Molecular Ecology Resources. 10(3):564–567. doi:10.1111/j.1755-0998.2010.02847.x.
- Excoffier L, Schneider S. 1999. Why hunter-gatherer populations do not show signs of Pleistocene demographic expansions. Proceedings of the National Academy of Sciences. 96(19):10597–10602. doi:10.1073/pnas.96.19.10597.
- Excoffier L, Smouse PE, Quattro JM. 1992. Analysis of molecular variance inferred from metric distances among DNA haplotypes: application to human mitochondrial DNA restriction data. Genetics. 131(2):479–491. doi:10.1093/genetics/131.2.479.
- Fratini S, Ragionieri L, Cannicci S. 2016. Demographic history and reproductive output correlates with intraspecific genetic variation in seven species of Indo-Pacific mangrove crabs. PLoS One. 11(7):e0158582. doi:10.1371/journal.pone.0158582.
- Froese R, Pauly D. 2022. Fishbase. World Wide Web electronic publication.
- Fu Y-X. 1997. Statistical tests of neutrality of mutations against population growth, hitchhiking and background selection. Genetics. 147(2):915–925. doi:10.1093/genetics/147.2.915.
- Gaither MR, Bowen BW, Rocha LA, Briggs JC. 2016. Fishes that rule the world: circumtropical distributions revisited. Fish and Fisheries. 17(3):664–679. doi:10.1111/faf.12136.
- Grant W, Bowen B. 1998. Shallow population histories in deep evolutionary lineages of marine fishes: insights from sardines and anchovies and lessons for conservation. Journal of Heredity. 89(5):415–426. doi:10.1093/jhered/89.5.415.
- Hadi S, Andayani N, Muttaqin E, Simeon BM, Ichsan M, Subhan B, Madduppa H. 2020. Genetic connectivity of the scalloped hammerhead shark Sphyrna lewini across Indonesia and the Western Indian Ocean. PLoS One. 15(10):e0230763. doi:10.1371/journal.pone.0230763.
- Harpending H. 1994. Signature of ancient population growth in a low-resolution mitochondrial DNA mismatch distribution. Human Biology. 66:591–600. https://www.jstor.org/stable/41465371.
- Holm S. 1979. A simple sequentially rejective multiple test procedure. Scandinavian Journal of Statistics. 6:65–70. https://www.jstor.org/stable/4615733.
- Huyghe F, Kochzius M. 2017. Highly restricted gene flow between disjunct populations of the skunk clownfish (Amphiprion akallopisos) in the Indian Ocean. Marine Ecology. 38(1):e12357. doi:10.1111/maec.12357.
- IGFA. 2001. International Game Fish Association. [accessed 2022 Feb 12]. https://www.fishbase.se/references/FBRefSummary.php?ID=40637.
- Igulu MM, Nagelkerken I, Dorenbosch M, Grol MGG, Harborne AR, Kimirei IA, Mumby PJ, Olds AD, Mgaya YD. 2014. Mangrove habitat use by juvenile reef fish: meta-analysis reveals that tidal regime matters more than biogeographic region. PLoS One. 9(12):e114715. doi:10.1371/journal.pone.0114715.
- Jahnke M, Gullström M, Larsson J, Asplund ME, Mgeleka S, Silas MO, Hoamby A, Mahafina J, Nordlund LM. 2019. Population genetic structure and connectivity of the seagrass Thalassia hemprichii in the Western Indian Ocean is influenced by predominant ocean currents. Ecology and Evolution. 9(16):8953–8964. doi:10.1002/ece3.5420.
- Johnson M, Mgaya Y, Shaghude Y. 2021. Analysis of the genetic stock structure and phylogenetic relationship of narrow-barred Spanish mackerel Scomberomorus commerson (Lacépède, 1800) along the northern Tanzanian coastal waters using mitochondrial DNA. Regional Studies in Marine Science. 46:101862. doi:10.1016/j.rsma.2021.101862.
- Kimura M. 1980. A simple method for estimating evolutionary rates of base substitutions through comparative studies of nucleotide sequences. Journal of Molecular Evolution. 16(2):111–120. doi:10.1007/BF01731581.
- Kumar S, Stecher G, Li M, Knyaz C, Tamura K. 2018. MEGA x: molecular evolutionary genetics analysis across computing platforms. Molecular Biology and Evolution. 35(6):1547–1549. doi:10.1093/molbev/msy096.
- Lage C, Kuhn K, Kornfield I. 2004. Genetic differentiation among Atlantic cod (Gadus morhua) from Browns Bank, Georges Bank, and Nantucket Shoals. Fishery Bulletin. 102(2):289–297.
- Mantel N. 1967. The detection of disease clustering and a generalized regression approach. Cancer Research. 27(2_Part_1):209–220.
- McClanahan TR. 1988. Seasonality in East Africa's coastal waters. Marine Ecology Progress Series. 44:191–199.
- Mwakosya CA, Mgaya YD, Jiddawi NS. 2018. Genetic connectivity of Fenneropenaeus indicus (H. Milne Edwards 1837) among three prawn fishing grounds of Tanzanian coastal waters. Regional Studies in Marine Science. 24:107–112. doi:10.1016/j.rsma.2018.08.001.
- Nehemia A, Huyghe F, Kochzius M. 2017. Genetic erosion in the snail Littoraria subvittata (Reid, 1986) due to mangrove deforestation. Journal of Molluscan Studies. 83(1):1–10. doi:10.1093/mollus/eyw040.
- Nehemia A, Kochzius M. 2017. Reduced genetic diversity and alteration of gene flow in a fiddler crab due to mangrove degradation. PLoS One. 12(8):e0182987. doi:10.1371/journal.pone.0182987.
- Nei M. 1987. Molecular evolutionary genetics. New York: Columbia University Press. doi:10.7312/nei-92038.
- Obura DO, Bandeira SO, Bodin N, Burgener V, Braulik G, Chassot E, Gullström M, Kochzius M, Nicoll M, Osuka K, et al. 2019. Chapter 4 - the northern Mozambique channel. In: Sheppard C, editor. World seas: an environmental evaluation. 2nd ed. Academic Press; p. 75–99. doi:10.1016/B978-0-08-100853-9.00003-8.
- Okada N, Sasaki T. 2005. Population genetic analysis of western Indian coelacanths based on mitochondrial DNA. Pioneering Studies on Coelacanth. 435:901.
- Pinsky ML, Palumbi SR. 2014. Meta-analysis reveals lower genetic diversity in overfished populations. Molecular Ecology. 23(1):29–39. doi:10.1111/mec.12509.
- Polte P, Asmus H. 2006. Intertidal seagrass beds (Zostera noltii) as spawning grounds for transient fishes in the Wadden Sea. Marine Ecology Progress Series. 312:235–243. doi:10.3354/meps312235.
- R Core Team. 2019. R: a language and environment for statistical computing. Vienna (Austria): R Foundation for Statistical Computing. www.R-project.org/.
- Reiss H, Hoarau G, Dickey-Collas M, Wolff WJ. 2009. Genetic population structure of marine fish: mismatch between biological and fisheries management units. Fish and Fisheries. 10(4):361–395. doi:10.1111/j.1467-2979.2008.00324.x.
- Richmond MD. 2011. A field guide to the seashores of Eastern Africa and the Western Indian Ocean Islands, Dar es Salaam: Sida. WIOMSA. 464 pp.
- Riede K. 2004. Global register of migratory species: from global to regional scales: final report of the R&D-Projekt 808 05 081. Federal Agency for Nature Conservation.
- Riginos C, Buckley YM, Blomberg SP, Treml EA. 2014. Dispersal capacity predicts both population genetic structure and species richness in reef fishes. The American Naturalist. 184(1):52–64. doi:10.1086/676505.
- Rogers AR. 1995. Genetic evidence for a Pleistocene population explosion. Evolution. 49(4):608–615. doi:10.2307/2410314.
- Rogers AR, Harpending H. 1992. Population growth makes waves in the distribution of pairwise genetic differences. Molecular Biology Evolution. 9(3):552–569. doi:10.1093/oxfordjournals.molbev.a040727.
- Rumisha C, Huyghe F, Rapanoel D, Mascaux N, Kochzius M. 2017. Genetic diversity and connectivity in the East African giant mud crab Scylla serrata: implications for fisheries management. PLoS One. 12(10):e0186817. doi:10.1371/journal.pone.0186817.
- Rumisha C, Mdegela RH, Gwakisa PS, Kochzius M. 2018. Genetic diversity and gene flow among the giant mud crabs (Scylla serrata) in anthropogenic-polluted mangroves of mainland Tanzania: implications for conservation. Fisheries Research. 205:96–104. doi:10.1016/j.fishres.2018.04.015.
- Semba M, Lumpkin R, Kimirei I, Shaghude Y, Nyandwi N. 2019. Seasonal and spatial variation of surface current in the Pemba Channel, Tanzania. PLoS One. 14(1):e0210303. doi:10.1371/journal.pone.0210303.
- Silas MO. 2022. Patterns of small-scale coastal fisheries and local fisheries management in Tanzania: adaptation to a changing climate. Stockholm: Department of Ecology, Environment and Plant Sciences, Stockholm University.
- Silva IC, Mesquita N, Paula J. 2010. Genetic and morphological differentiation of the mangrove crab Perisesarma guttatum (Brachyura: Sesarmidae) along an East African latitudinal gradient. Biological Journal of the Linnean Society. 99(1):28–46. doi:10.1111/j.1095-8312.2009.01338.x.
- Tajima F. 1989. Statistical method for testing the neutral mutation hypothesis by DNA polymorphism. Genetics. 123(3):585–595. doi:10.1093/genetics/123.3.585.
- van der Ven RM, Triest L, De Ryck DJ, Mwaura JM, Mohammed MS, Kochzius M. 2016. Population genetic structure of the stony coral Acropora tenuis shows high but variable connectivity in East Africa. Journal of Biogeography. 43(3):510–519. doi:10.1111/jbi.12643.
- Van Nieuwenhove AHM, Ratsimbazafy HA, Kochzius M. 2019. Cryptic diversity and limited connectivity in octopuses: recommendations for fisheries management. PLoS One. 14(5):e0214748. doi:10.1371/journal.pone.0214748.
- Vasilakopoulos P, O'Neill FG, Marshall CT. 2011. Misspent youth: does catching immature fish affect fisheries sustainability? ICES Journal of Marine Science. 68(7):1525–1534. doi:10.1093/icesjms/fsr075.
- Villesen P. 2007. Fabox: an online toolbox for fasta sequences. Molecular Ecology Notes. 7(6):965–968. doi:10.1111/j.1471-8286.2007.01821.x.
- White C, Selkoe KA, Watson J, Siegel DA, Zacherl DC, Toonen RJ. 2010. Ocean currents help explain population genetic structure. Proceedings of the Royal Society B: Biological Sciences. 277(1688):1685–1694. doi:10.1098/rspb.2009.2214.
- Yu H, Kai Y, Kim JK. 2016. Genetic diversity and population structure of Hyporhamphus sajori (B eloniformes: H emiramphidae) inferred from mtDNA control region and msDNA markers. Journal of Fish Biology. 89(6):2607–2624. doi:10.1111/jfb.13152.
- Zemeckis DR, Hoffman WS, Dean MJ, Armstrong MP, Cadrin SX. 2014. Spawning site fidelity by Atlantic cod (Gadus morhua) in the Gulf of Maine: implications for population structure and rebuilding. ICES Journal of Marine Science. 71(6):1356–1365. doi:10.1093/icesjms/fsu117.
- Zink RM, Barrowclough GF. 2008. Mitochondrial DNA under siege in avian phylogeography. Molecular Ecology. 17(9):2107–2121. doi:10.1111/j.1365-294X.2008.03737.x.
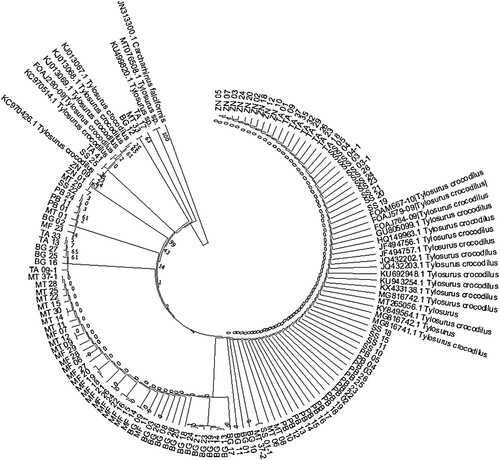
Appendix 1
Figure A1. Evolutionary relationships of sampled sequences of the hound needlefish (Tylosurus crocodilus) were inferred using the Maximum Likelihood method and Kimura 2-parameter model. All samples clustered phylogenetically with the reference T. crocodilus sequences (1000 bootstraps) at 99% similarity.