
ABSTRACT
We show in this study that the population of Chthamalus dentatus along the Atlantic coast of Africa displays a genetic division into four clades, namely: the South African, the Namibian-Angolan, the Cameroonian and the West African clade. This division is based on four genes – two mitochondrial genes, cytochrome c oxidase subunit I (COI) and the control region (D-loop), with the addition of two nuclear genes, the elongation factor (EF1) and the sodium-potassium ATPase (NaKA). The unique morphological feature of C. dentatus – dentated sutures between the shell compartments – is apparent in the specimens of the four clades, thus we define these clades as cryptic species of C. dentatus. The present work extends previous studies on the population genetics of C. dentatus that were based on COI only, by adding more genes and expanding the range of collection sites. In addition, the availability of new specimens from West Africa also enabled us to increase the northern limit of this species’ range to include Northern Senegal.
Introduction
The genus Chthamalus (Chthamaloidea: Chthamalidae) was erected by Krauss (Citation1848) and Darwin (Citation1854) recognized eight species belonging to this genus, reporting varieties within some. Subsequently, some of these varieties were determined as distinct species or even genera. Later, more species of Chthamalus were described, and currently 27 nominal species of Chthamalus are listed (Chan et al. Citation2021).
The toothed barnacle Chthamalus dentatus Krauss, 1848, is easily recognized by a distinct external feature − the sutures between the shell compartments are dentate and two adjacent compartments are interlocked. This is a unique feature within the genus Chthamalus that was used by Darwin (Citation1854) to erect it as a distinct species, stating: ‘the sutures in all cases are tolerably distinct, and have their edges toothed and interlocked’ (Darwin Citation1854, p. 463). The type locality of C. dentatus is not indicated by Krauss (Citation1848), but is assumed to be in South Africa, since the description is found in his book on South African molluscs.
Chthamalus dentatus is widely distributed and abundant along the Southern Africa intertidal zone (Barnard Citation1924), from Madagascar and Mauritius in the Western Indian Ocean (Sandison and Day Citation1954; Stephenson and Stephenson Citation1973) and, according to Hoek (Citation1883), to Cape Verde Islands in the Eastern Atlantic. Stubbings (Citation1967), however, stated that Hoek’s identification is uncertain. More recently, Tikochinski et al. (Citation2020), who identified a cryptic species of Chthamalus related to C. stellatus in Cape Verde Islands, did not find C. dentatus there.
Studying populations of C. dentatus from Madagascar, South Africa, Namibia and Cameroon, Motro et al. (Citation2023) showed that while morphologically all these populations are similar, there are genetic differences which distinguish them. Analysing the commonly used mitochondrial cytochrome oxidase subunit I (COI) marker, they recognized three clades, considered as three cryptic species within this taxon: all South African locations, together with Morondava (Madagascar), are included in one clade; the second clade comprises the Namibian locations, except for the Southern Namibian population of Kerbe Huk, which belongs to the South African clade; the third clade, noticeably distinct from the other two clades, included the population of Cameroon.
However, the study of Motro et al. (Citation2023) was limited to Southern Africa and Cameroon due to lack of available materials from further north of the African coastline. The availability of new C. dentatus specimens from Angola, Ghana and Senegal, included in the present study, enabled an expansion of current knowledge regarding the distribution of C. dentatus in the Eastern Atlantic shores of Africa. The presence of C. dentatus in Cape Verde Islands could not be confirmed, thus supporting Stubbings’ note (Citation1967, p. 256) ‘The species was not found in the Archipelago by the Calypso expedition’.
Material and methods
Samples and sampling sites
Hundred and fifty-five specimens of C. dentatus are included in this study: 36 new specimens were collected from Lobito (Angola), Accra (Ghana) and Saint Louis (Senegal). The new specimens are complemented by 119 previously studied C. dentatus specimens from the region (Motro et al. Citation2023), including: Camps Bay (South Africa), Kerbe Huk, Elizabeth Bay, Swakopmund, Cape Cross and Mowe Bay (Namibia) and from Batoké (Cameroon). These 10 locations ( and ) present quite a comprehensive sampling of C. dentatus along the African shores of the East Atlantic.
Figure 1. Map showing the 10 collection sites of C. dentatus in the current study.
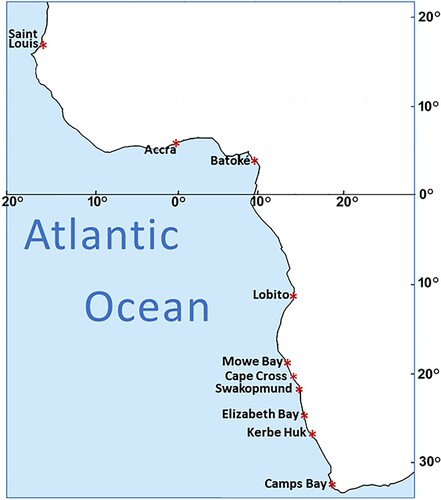
Table I. Number of individuals (N) from each population.
Molecular analysis
For the molecular analysis we used two mitochondrial markers, a segment of cytochrome c oxidase subunit I (COI) and a segment of the mitochondrial control region (D-loop). In addition, we used also two nuclear markers, the elongation factor (EF1) and the sodium-potassium ATPase (NaKA).
A segment of the mitochondrial cytochrome c oxidase subunit I (COI) was amplified using the universal barcode primers LCO1490 and HCO2198 (Folmer et al. Citation1994). The reaction mix, in a total volume of 25 µl contained: 10 ng of template DNA, 12.5 µl PCR mix (2X PCR HS Taq Mix Red; PCR Biosystem, London, UK) and 0.4 μM of each primer. The PCR profile was: Initial denaturation at 95°C for 1 min followed by 40 cycles of 15 s at 95°C, 15 s at 50°C and 20 s at 72°C with a final extension step of 3 min at 72°C.
A segment of the mitochondrial control region (D-loop) was amplified, using consensus primers designed by Yaron Tikochinski (based on sequences from species of the Balanomorpha order):
CH-CR-F: CACCTTTGCAGCTTCAATGCAAAACTCTA
CH-CR-R: CGTATAACCGCGGCTGCTGGCACGCTATTTTCC
The reaction mix, in a total volume of 25 µl was similar to that of the COI. The PCR profile was: Initial denaturation at 95°C for 3 min followed by 32 cycles of 30 s at 95°C, 30 s at 58°C and 30 s at 72°C with a final extension step of 3 min at 72°C.
A segment of the nuclear eukaryotic elongation factor 1α was amplified using the nEF1 F and nEF1 R primers (Wares et al. Citation2009). The reaction mix, in a total volume of 20 µl contained: 10 ng of template DNA, 10 µl PCR mix (2X PCR HS Taq Mix Red; PCR Biosystem, London, UK) and 0.4 μM of each primer. The PCR profile was: Initial denaturation at 95°C for 1 min followed by 32 cycles of 30 s at 95°C, 30 s at 57°C and 30 s at 72°C with a final extension step of 3 min at 72°C.
A segment of the nuclear Na-K-ATPase (NaKA) was amplified using the nNAKA F and nNAKA R primers (Wares et al. Citation2009). The reaction mix, in a total volume of 20 µl contained: 10 ng of template DNA, 10 µl PCR mix (2X PCR HS Taq Mix Red; PCR Biosystem, London, UK) and 0.4 μM of each primer. The PCR profile was: Initial denaturation at 95°C for 1 min followed by 32 cycles of 30 s at 95°C, 30 s at 57°C and 30 s at 72°C with a final extension step of 3 min at 72°C.
PCR products were visualized on 1.5% agarose gels and sequenced in both directions using the two PCR primer sets on an ABI 377 DNA Sequencer (Applied Biosystems, Foster City, CA, USA), following the manufacturer’s instructions.
The material used for the present study is stored in the Israeli National Natural History Collections at the Hebrew University of Jerusalem. GeneBank accession numbers are presented in the Supplementary Material, Table SI.
Statistical analysis
COI
Altogether, we analysed 155 individuals from 10 locations. Multiple alignment of all sequences was conducted using the ClustalW option implemented in the Molecular Evolution Genetics Analysis (MEGA X, Kumar et al. Citation2018) software. Following quality control and sequence trimming, we were left with 529 positions. Of these, 151 are variable sites: 116 parsimony-informative and 35 singletons. Pairwise distances between the COI haplotypes were calculated using the Tamura-Nei model, conducted in MEGA X.
The large number of sequences prevents us from displaying a legible phylogenetic tree that includes all individuals. Instead, we proceeded with a population-based analysis of the 10 sampled locations. We first define pairwise distances between any two locations (A and B, say) as the mean of all pairwise distances between two sequences, one from A and the other from B. Thus, we obtain 45 between-population distances. The overall 10 × 10 distance matrix served to construct a population phylogenetic tree applying the UPGMA (unweighted pair group method with arithmetic mean) algorithm, using the software MVSP (Kovach Computing Services Citation2013).
In addition, a median-joining haplotype network was constructed using the software PopART (Population Analysis with Reticulate Trees) (Leigh and Bryant Citation2015), to visualize the relationships among the different COI haplotypes.
The Automatic Barcode Gap Discovery (ABGD) method (Puillandre et al. Citation2012) was also employed to detect possible clustering of individuals by considering the distribution of all 11,935 pairwise distances.
Finally, we compared our COI data to ten established nominal species of Chthamalus, taken from Chan et al. (Citation2016). The number of individuals from each species are given in the Supplementary Material, Table SII.
D-loop
To support and validate the results obtained by the commonly used COI marker, we analysed a subset of the samples using also the mitochondrial control region (D-loop) gene. Forty-seven individuals were randomly chosen from the 10 study locations. After a multiple alignment and quality trimming of all the sequences (as above), we were left with 520 positions. Of these, 270 are variable sites: 227 parsimony-informative and 43 singletons. Pairwise distances between the D-loop haplotypes were calculated by the Tamura-Nei model, using the MEGA X software, and a bootstrap-generated (1000 replications) neighbour-joining tree was constructed using the same software. The distance between any two clusters, A and B, was calculated by the mean of all pairwise distances between two haplotypes, one from A and the other from B.
EF1 and NaKA
Additional validation was obtained using a segment of the nuclear elongation factor (EF1). Forty-five individuals were randomly chosen from nine study locations (no results could be obtained from the Elizabeth Bay specimens). We used the DnaSP ver. 6 software (Rozas et al. Citation2017) for unfolding the diploid data into haplotypic sequences. After a multiple alignment and quality trimming of all the sequences (as above), we were left with 434 positions. Of these, 47 are variable sites: 35 parsimony-informative and 12 singletons. Pairwise distances between haplotypes were obtained by the Tamura-Nei model, using the MEGA X software.
Finally, further validation was obtained using a segment of the nuclear sodium-potassium ATPase (NaKA) gene. Forty-seven individuals were randomly chosen from nine study locations (excluding Elizabeth Bay), and the diploid data was unfolded and aligned as above. We were left with 227 positions. Of these, 21 are variable sites: 7 parsimony-informative and 14 singletons. Between-cluster distances were calculated as above.
Results
COI
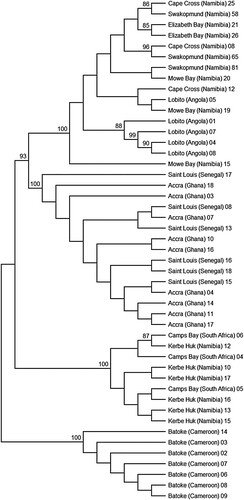
The means of the 45 between-population distances are presented in , and the resulting population-based phylogenetic tree of the 10 locations is presented in . These display a geographic structure, dividing the population into four main clusters: The West African Clade, including Saint Louis (Senegal) and Accra (Ghana); the Cameroonian Clade, including Batoké (Cameroon); the Namibian-Angolan Clade, including Lobito (Angola), Mowe Bay, Cape Cross, Swakopmund and Elizabeth Bay (all four locations from Namibia); and the South African Clade, including Kerbe Huk (Namibia) and Camps Bay (South Africa).
Figure 2. A UPGMA tree, based on between-location COI distances, depicting the relationship between the 10 Eastern Atlantic C. dentatus populations.
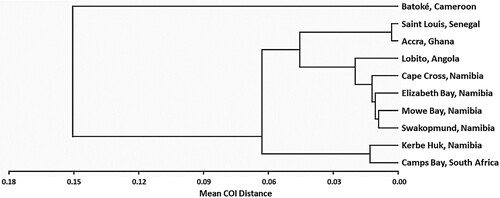
Table II. Pairwise COI distances between the 10 C. dentatus collecting locations. (Pairwise distance between any two locations, A and B, is the mean of all pairwise distances between two sequences, one from A and the other from B).
The between-clades mean COI distances are presented in , and a phylogenetic UPGMA tree depicting the relationship between the four Eastern Atlantic C. dentatus clades, is presented in (A). The West African clade showed smallest mean COI distance to the clade of Namibia-Angola, followed by the South African clade. Cameroon stands out as the most genetically distant population of the four.
Figure 3. UPGMA trees depicting the relationship between the four Eastern Atlantic C. dentatus clades. (A) Based on between-clade COI distances, (B) based on between-clade D-loop distances, (C) based on between-clade EF1 distances, (D) based on between-clade NaKA distances.
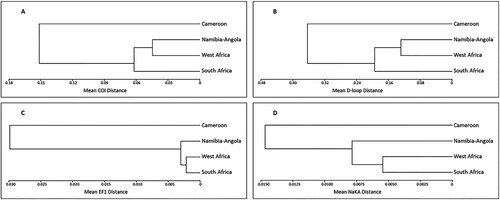
Table III. Pairwise genetic distances (± se) between the four Eastern Atlantic C. dentatus clades, for each of four markers.
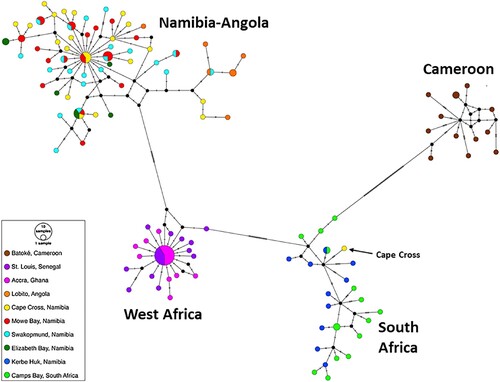
The haplotype network is presented in . It clearly displays the division of the COI haplotypes into the above-mentioned four clades (with the exception of a single haplotype from Cape Cross which is nested in the South African Clade).
Figure 4. A median-joining COI haplotype network. Black circles denote inferred medians.
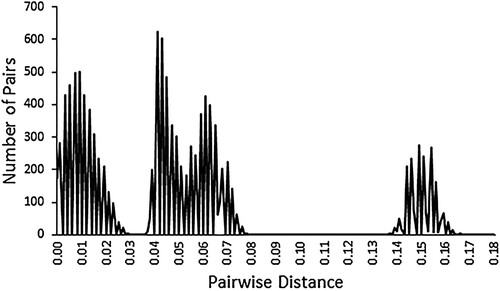
Similarly, the ABGD method displays a quadri-modal distribution of the individual pairwise distances (). The first mode comprises almost all the within-clade distances, the second and the third modes represent pairwise distances between the South African, the Namibian-Angolan and the West African clades, whereas the fourth mode exclusively represents all 1846 pairwise distances between Cameroon and each of the other three clades.
Figure 5. The distribution of all COI pairwise distances (with regard to the ABGD method).
D-loop
Based on a sub-sample of 47 individuals, the bootstrap-generated neighbour-joining tree displays a similar division of the population into the above-mentioned four clades (). The between-clades mean D-loop distances are presented in , and a phylogenetic UPGMA tree depicting the relationship between the four Eastern Atlantic C. dentatus clades, is presented in (B). Not surprisingly, for both mitochondrial genes, the COI and the D-loop, the UPGMA trees display an identical topology.
Figure 6. A D-loop-based neighbour-joining tree of C. dentatus individuals from the Atlantic coast of Africa. Pairwise distances between individuals were calculated by the Tamura-Nei model. The percentage of replicate trees in which the associated taxa clustered together in the bootstrap test (1000 replicates) is shown only if larger than 80%.
EF1 and NaKA
The between-clades mean distances are presented in , and phylogenetic UPGMA trees depicting the relationship between the four Eastern Atlantic C. dentatus clades, are presented in (C) (for EF1) and 3D (for NaKA).
Discussion
Molecular analyses, using two mitochondrial markers, the cytochrome c oxidase subunit I (COI) and the control region (D-loop), and two nuclear markers, the elongation factor (EF1) and the sodium-potassium ATPase (NaKA), indicate that across the East Atlantic shore of Africa, C. dentatus displays a distinct division into four clades. We termed these clades as the West African, the Cameroonian, the Namibian-Angolan and the South African Clades. In a previous study, Motro et al. (Citation2023) showed that the South African Clade includes locations from Madagascar in the East all through the South African shores and up to South Namibia in the West, where it is separated from the clade north of it by the Benguela upwelling system. In addition, they genetically marked out the Cameroonian population as a distinct clade. However, their study was based on the COI gene only. In the present study we validate and expand these findings by adding three more genes. Moreover, by adding three more populations, we show that the Namibian Clade stretches north to include central Angola, and we further describe a fourth clade, the West African clade.
Stubbings (Citation1967) stated that while C. dentatus is found throughout the entire west coast of Africa south of Cape Verde, the northern bound of its distribution is uncertain. He reported that only a few C. dentatus specimens are present at the Institut Fondamental d'Afrique Noire (IFAN) collections at Dakar, which suggests that it is not common there. Stubbings also mentioned that Sourie (Citation1954), who investigated the coastline of Mauritania and Senegal rather thoroughly, did not record it at all. Thus, the presence of C. dentatus in Saint Louis, reported here, extends its range further north by about 200 kms. We have no information about its occurrence north of the Senegal River, that marks the border between Senegal and Mauritania. It is interesting to note that in Saint Louis, there are two species of Chthamalus, C. montagui and C. dentatus. For C. montagui, whose distribution spans the West Mediterranean Sea and the Northeast Atlantic shores of Europe and West Africa, Senegal is the southernmost boundary of its distribution (Bronstein et al. Citation2023).
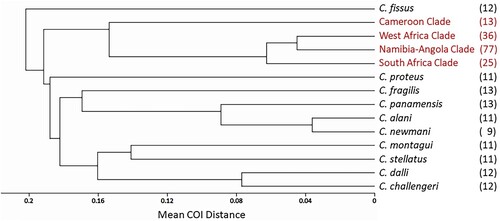
We conclude by comparing the four dentatus clades to ten established nominal species of Chthamalus, using the commonly used COI gene ( and in the Supplementary Material, Table SII). We see that the mean COI distances among the four C. dentatus clades are quite comparable to mean distances between different Chthamalus nominal species. In particular, the distances between the Cameroonian Clade and each of the other three C. dentatus clades are significantly larger than the mean distance between the nominal species C. challengeri and C. dalli, or within the alani-newmani-panamensis group of the panamensis complex (p < 0.004 in each case). This further justifies regarding the four novel dentatus clades as four different cryptic species.
Figure 7. A COI-based UPGMA topology tree depicting the relationship between the four C. dentatus clades (in red) and ten different nominal species of Chthamalus. The numbers in parentheses refer to the sample size from each population.
Supplemental Material
Download Zip (2.3 MB)Acknowledgements
We thank Professor George Branch of the Department of Zoology, University of Cape Town; Mr. Aiden Biccard of Anchor Environmental Consultants (Pty), Cape Town; Dr. Andrea Pulfrich of Pisces Environmental Services, Cape Town; Amit and Eyal Meluban – for providing samples.
Disclosure statement
No potential conflict of interest was reported by the author(s).
References
- Barnard KH. 1924. Contribution to the crustacean fauna of South African water. No. 7 Cirripedia. Annals of the South African Museum. 20:1–103.
- Bronstein O, Motro U, Simon-Blecher N, Ndao PD, Savaya A, Achituv Y. 2023. Molecular analysis separates the Atlantic population of Montagu’s stellate barnacle into two cryptic species. Zoologica Scripta. 52:654–661. doi:10.1111/zsc.12621.
- Chan BKK, Chen H-N, Dando PR, Southward AJ, Southward EC. 2016. Biodiversity and biogeography of chthamalid barnacles from the North-Eastern Pacific (Crustacea Cirripedia). PLoS One. 11(3):e0149556. doi:10.1371/journal.pone.0149556.
- Chan BKK, Dreyer N, Gale AS, Glenner H, Ewers-Saucedo C, Pérez-Losada M, Kolbasov GA, Crandall KA, Høeg JT. 2021. The evolutionary diversity of barnacles, with an updated classification of fossil and living forms. Zoological Journal of the Linnean Society. 193:789–846. doi:10.1093/zoolinnean/zlaa160.
- Darwin CR. 1854. A monograph on the sub-class Cirripedia. London: Ray Society. http://darwin-online.org.uk/content/frameset?pageseq = 1&itemID = F339.2&viewtype = text.
- Folmer O, Black M, Hoeh W, Lutz R, Vrijenhoek R. 1994. DNA primers for amplification of mitochondrial cytochrome c oxidase subunit I from diverse metazoan invertebrates. Molecular Marine Biology and Biotechnology. 3:294–299.
- Hoek PPC. 1883. Report on the Cirripedia collected by H.M.S. CHALANGER during the years 1873–1876. Report on the scientific results of the voyage during the years 1873–76. Zoology. 8:1–169.
- Kovach Computing Services. 2013. MVSP, Multi-Variate Statistical Package.
- Krauss F. 1848. Die südafrikanischen Mollusken; ein Beitrag zur Kenntniss der Mollusken des Kap- und Natallandes und zur geographischen Verbreitung derselben, mit Beschreibung und Abbildung der neuen Arten. Stuttgart: Ebner & Seubert. https://app.amanote.com/v4.0.41/research/note-taking?resourceId = l67jAnQBKQvf0BhiDs8Q.
- Kumar S, Stecher G, Li M, Knyaz C, Tamura K. 2018. MEGA X: molecular evolutionary genetics analysis across computing platforms. Molecular Biology and Evolution. 35:1547–1549. doi:10.1093/molbev/msy096.
- Leigh JW, Bryant D. 2015. POPART: full-feature software for haplotype network construction. Methods in Ecology and Evolution. 6:1110–1116. doi:10.1111/2041-210X.12410.
- Motro U, Simon-Blecher N, Bronstein O, Frumin S, Achituv Y. 2023. Brewed in the African Pot: The phylogeography of the toothed barnacle Chthamalus dentatus (Chthamaloidea: Chthamalidae). Marine Biology Research. 19:327–341. doi:10.1080/17451000.2023.2193899.
- Puillandre N, Lambert A, Brouillet S, Achaz G. 2012. ABGD, Automatic Barcode Gap Discovery for primary species delimitation. Molecular Ecology. 21:1964–1977. doi:10.1111/j.1365-294X.2011.05239.x.
- Rozas J, Ferrer-Mata A, Sánchez-DelBarrio JC, Guirao-Rico S, Librado P, Ramos-Onsins SE, Sánchez-Gracia A. 2017. DnaSP 6: DNA sequence polymorphism analysis of large datasets. Molecular Biology and Evolution. 34:3299–3302. doi:10.1093/molbev/msx248.
- Sandison EE, Day JH. 1954. The identification of the nauplii of some South African barnacles with notes on their life histories. Transactions of the Royal Society of South Africa. 34:69–101. doi:10.1080/00359195409518980.
- Sourie R. 1954. Contribution à l'étude écologique des côtes rocheuses du Sénégal. Mémoires de l'Institut Français d'Afrique Noire. 38:1–342.
- Stephenson TA, Stephenson A. 1973. Life between tidemarks on Rocky Shores. San Francisco, CA: WH Freeman and Co.
- Stubbings HG. 1967. The cirriped fauna of tropical West Africa. Bulletin of the British Museum (Natural History) Zoology. 15:229–319. doi:10.5962/bhl.part.27518.
- Tikochinski Y, Motro U, Simon-Blecher N, Achituv Y. 2020. Molecular analysis reveals a cryptic species of Chthamalus (Crustacea: Cirripedia) in the Cape Verde Islands. Zoological Journal of the Linnean Society. 193:1072–1087. doi:10.1093/zoolinnean/zlaa159.
- Wares JP, Pankey MS, Pitombo F, Daglio LG, Achituv Y. 2009. A “shallow phylogeny” of shallow barnacles (Chthamalus). PLoS One. 4(5):e5567. doi:10.1371/journal.pone.0005567.