Abstract
By reference to a series of 15 sampling stations spanning the West Shetland Slope (150–1000 m; Faroe–Shetland Channel, North-east Atlantic) we examined the potential environmental controls on the standing stock, diversity and composition of the polychaete fauna. In contrast to the majority of studied bathyal environments, the Faroe–Shetland Channel has a highly complex and dynamic hydrographic regime, particularly notable for extreme thermal variability at mid-slope depths (i.e. 7°C range at ca. 500 m). Contrary to general expectation, polychaete biomass increased (rather than decreased) with depth. Species diversity exhibited a parabolic pattern with depth, maximum diversity occurring at depths of 350–550 m, rather shallower than observed in other bathyal studies, and possibly linked with a maximum in habitat temperature range. Multivariate analyses of faunal composition suggested a separation of the sampling stations into a shallower and a deeper group, with temperature exerting a major control on polychaete species distributions. The decline in diversity below 600 m (i.e. the descending limb of the parabolic relationship) may be a result of historically limited immigration/recolonization of the thermally isolated Arctic deep-water basins that feed the cold-water flow through the Faroe–Shetland Channel. The bathymetric distribution of polychaetes and other benthos in this region appears to be intimately linked with the thermal regime, having a long-term impact (geological timescales) on the deep-water species pool and leading to local enhancement of diversity where cold- and warm-water masses meet and mix.
Introduction
The rapid change in the conditions for life on the seabed with increasing water depth is one of the major ecological gradients on Earth. The best documented and most striking example of this gradient is the exponential decline in benthic standing crop with increasing depth from the shelf edge to the outer continental rise (Vinogradova Citation1962; Rowe & Menzel Citation1971; Rowe Citation1983; Gage & Tyler Citation1991; Gage Citation2002). The rate of decline is variable depending on surface production (Rowe Citation1971; Rowe & Pariente Citation1992), the width of and exports from the continental shelf (Rowe & Haedrich Citation1979) and latitude (Belyaev Citation1966). Marked down-slope changes in benthic faunal composition are also well documented (e.g. Menzies et al. Citation1973; Hecker Citation1990; Rex et al. Citation1997), with rates of faunal turnover often being highest in the upper bathyal and lowest on the continental rise out to the abyssal zone (Haedrich et al. Citation1980; Carney et al. Citation1983; Etter & Rex Citation1990; Svavarsson et al. Citation1990). Depth-related biochemical adaptation in individuals (Somero Citation1992) and early development (Tyler & Young Citation1998) must play a part in generating this pattern. However, other ecological factors, such as changing quality, quantity and availability of food (e.g. Frederiksen et al. Citation1992; Flach & Thomsen Citation1998; Flach et al. Citation1998), and subtler, depth-related change in the nature and intensity of biotic interactions (Rex Citation1977; Rex et al. Citation1988), may also be important. However, it remains unclear how such small-scale effects might influence larger-scale depth-related patterns, and the evolutionary processes determining community composition and richness must also be important (Rex et al. Citation1997).
Although it is unsurprising that such factors may influence the down-slope diversity pattern of the benthic community (Rex Citation1976), the form this pattern takes seems to be regionally variable. In the relatively well-sampled North-west Atlantic, a parabolic pattern of diversity with depth has been shown for several macro- and mega-faunal groups (Rex Citation1981, Citation1983; Rex et al. Citation1997). Data from the North-east Atlantic are sparse, but show diversity increasing with depth from the upper bathyal at about 49–50°N on the European margin with the rate falling off with increasing depth, and no decline evident into abyssal depths (Rex et al. Citation1997: Figure 5.2; Flach & de Bruin Citation1999). Further north, at about 55–57°N off Scotland, a parabolic diversity pattern is evident among polychaetes (Paterson & Lambshead Citation1995) and the total macrobenthos (Gage et al. Citation2000), but this peaks at a shallower depth than in the North-west Atlantic. In the Norwegian Sea, Svavarsson et al. (Citation1990) found isopod diversity to be maximal in the upper bathyal, then decreasing with depth. Assuming a continuity of the upper bathyal with the outer shelf, this is in general agreement with Gray (Citation1994) who, in contrast to the North-west Atlantic studies where low diversity on the shelf provides the upper end-member to the diversity parabola, found outer shelf areas supporting very high macrobenthic diversity. A low diversity at depths affected by sub-zero Norwegian Sea deep water is in accordance with previous findings that have been linked to extinction during Quaternary glaciation with subsequent immigration severely restricted by isolation of the deep Norwegian/Greenland Sea basins from the warmer deep Atlantic water by submarine sills (e.g. Dahl et al. Citation1976; Bouchet & Warén Citation1979; Sibuet Citation1979). The resulting strong gradient in water temperature between Norwegian Sea deep water and the overlying warmer Atlantic waters may conceivably directly influence the down-slope pattern in benthic faunal composition and diversity.
Background to the study area
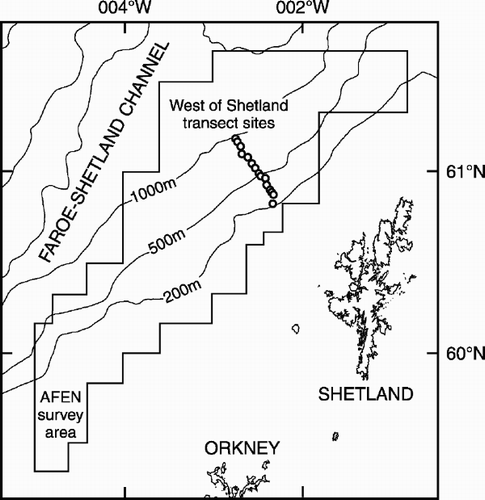
The current study focused on the Faroe–Shetland Channel, a rift basin that is thought to have formed during the early Mesozoic (Hitchen & Ritchie Citation1986). It ranges in depth from approximately 100 m on the continental shelf to over 1500 m in the deepest part (). The Faroe–Shetland Channel lies between the Scottish continental shelf and the Faroe Plateau and has an unusual and highly dynamic physical environment. This results from the convergence and contrasting flow regimes of five water masses in this confined channel (Dooley & Meincke Citation1981; Hansen Citation1985; Turrell et al. Citation1999). Along the eastern side of the channel, warm, saline North Atlantic water flows in a north-easterly direction over cold, dense Norwegian Sea water flowing towards the south-west (see Turrell et al. Citation1999). Of specific interest is the boundary between the warm- and cold-water masses, generally occurring at a depth of 350–600 m. In these depths, bottom water temperature can change dramatically (e.g. 7°C) over short periods, probably as a result of the passage of internal waves (Bett Citation2000).
Figure 1. Chart of the West Shetland Slope area showing the locations of the transect study sites and the extent of the AFEN 1996 survey area.
The aim of the present study was to describe the ecology (standing crop, diversity and composition) of the bathyal polychaete fauna of the West Shetland Slope where it straddles the boundary between Arctic and Atlantic conditions. As a result of the strong vertical gradient in environmental conditions associated with the complex hydrographic regime, we particularly wanted to test the importance of physical variables in determining down-slope change in fauna.
Methods
Sampling methods
Samples were collected along a depth transect on the West Shetland Slope () during RRS Charles Darwin cruise 101C leg 2 in July 1996 and cruise 112C in May/June 1998 (Bett Citation1997, Citation1999). Fifteen stations were sampled at depths ranging from 150 to 1000 m covering widely differing sediment types. As a consequence of the varied seabed conditions, three different seabed samplers were required: an hydraulically damped Megacorer, similar to the multiple corer (see e.g. Barnett et al. Citation1984); a modified USNEL box corer (Hessler & Jumars Citation1974); and a Day grab (Tyler & Shackley Citation1978) sampling 0.063, 0.1 and 0.1 m2, respectively. The samplers were used in the following depth ranges: the Megacorer from 550 to 1000 m; the box corer between 350 and 500 m; and the Day grab from 150 to 300 m. Because the shelf edge and upper slope of the Faroe–Shetland Channel is strewn with glacial erratic cobbles and boulders, the Megacorer and eventually the box corer become increasingly ineffective (and risked severe damage) at the shallowest sites (Bett & Gage Citation2000). For the present study, one sample of the macrobenthos (retained on a 0.5 mm sieve) was analysed from each of the 15 stations in each of the 2 years of study. Comparable macrobenthos data are also available from an extensive regional survey of the macrobenthos of the West Shetland Slope (see Bett Citation2000). Full methodological protocols are detailed in Narayanaswamy (Citation2000) and Narayanaswamy et al. (Citation2003).
Additional samples were also collected for the analysis of environmental variables: particle size, silt/clay fraction, total organic carbon/nitrogen, both aromatic and aliphatic hydrocarbons. Regional water temperature variations were derived from CTD data collected during a 1 month long sidescan sonar survey immediately prior to our 1996 study (see Masson Citation1997). Full details of sample collection and the various analyses performed are given in Bett (Citation1997, Citation1999, Citation2000).
Statistical analyses
Given the use of the three different sampling gears, Bett (Citation2000) carried out a statistical assessment of sampler performance specifically on the West Shetland Slope transect. No significant differences were detected between samples collected by the Day grab and box corer. However, significant differences were detected between the box corer and the Megacorer, both abundance and biomass appear to be significantly underestimated by the box corer relative to the Megacorer. Therefore, to improve the comparability of abundance and biomass data reported here, we have applied correction factors to the Day grab and box corer sample data, based on the data of Bett (Citation2000) as follows:
As diversity indices vary in relative sensitivity to the species richness and evenness components of diversity, a range of diversity indices were applied to the data. Magurran (Citation1988) concluded that indices that are better at discriminating between samples but are more greatly influenced by sample size are those that reflect the species richness element of diversity, while indices that measure the evenness/dominance component of diversity are less likely to be influenced by sample size but cannot discriminate as well between samples. The computer packages PRIMER (Clarke & Warwick Citation1994) and BioDiversity Pro (McAleece et al. Citation1997) were used to calculate different species diversity indices: Margalef's species richness (Clifford & Stephenson Citation1975), the Shannon–Wiener diversity index (Pielou Citation1975), Pielou's evenness index (Pielou Citation1975), Simpson's dominance index (Simpson Citation1949) and the rarefied species richness (Hurlbert Citation1971). The definitions and terminology of these diversity indices are provided in Magurran (Citation1988). However, we have defined “diversity” to mean the composite measure of species abundance distribution.
Cluster analysis and non-metric multidimensional scaling (nMDS) were also undertaken using the PRIMER package (Clarke & Warwick Citation1994). A similarity matrix was produced using the Bray–Curtis similarity measure after fourth root transformation of the species abundance data (see Clarke & Warwick Citation1994 for methodological selection and details). This matrix was then used to produce dendrograms (using a group-average clustering strategy) and nMDS ordinations (Shepard Citation1962; Kruskal Citation1964; Lance & Williams Citation1967). Kruskal's stress formula was used to measure the “goodness of representation” of the MDS ordinations (Kruskal & Wish Citation1978).
Canonical correspondence analysis (CCA) was undertaken using the CANOCO programme (ter Braak & Smilauer Citation2002) and was used to analyse the relationship between the suite of environmental variables and the structure of the polychaete community. Depth was found to be a co-variable and was removed from the analysis using forward selection with CCA. A Monte Carlo permutation test was also undertaken to test the significance of the relationship between the environmental variables and the polychaetes (Manly Citation1991; ter Braak & Smilauer Citation2002). This gives the significance of the first eigenvalue and the sum of the eigenvalues (ter Braak Citation1987) whereby eigenvalues >0.5 signify good species dispersal along the different axes and suggests that they explain a large fraction of the species composition variance (ter Braak Citation1986). The eigenvalues that are presented measure the total amount of variance, while the canonical eigenvalues measure the variance with respect to the environmental variables used (ter Braak & Smilauer Citation2002). A partial Pearson correlation was used to correlate the environmental variables with the ordination axes.
To set our results from the West Shetland Slope transect in the wider context of the eastern Faroe–Shetland Channel we also extracted and analysed polychaete distribution data from the Atlantic Frontier Environmental Network (AFEN) 1996 survey (a baseline survey undertaken to reappraise the requirements of environmental monitoring; see e.g. Bett Citation2000) (see ). We extracted and amalgamated the polychaete data from the AFEN survey samples by depth to make an assessment of regional bathymetric trends. Sample data were accumulated in depth order to give pooled data having at least a total of 500 polychaete specimens per depth horizon. This process yielded 32 pooled sample sets (depth horizons: 97–110 m to 1163–1388 m) from groups of five to eight original samples, with the pooled data having between 502 and 915 individuals. The AFEN polychaete data set was then analysed using the methods outlined above. Full details of sampling and sample processing are given in Bett (Citation2000) and the full data set is available in AFEN (Citation2000), available from http://www.geotek.co.uk/afenrequest).
Results
Standing stock
The abundance data were rather variable, both between years and between depths (). There was, however, no significant systematic difference between years (Friedman's test; P>0.05). Although the data appear to suggest some increase in abundance with depth, there was no significant correlation with depth (Spearman's rank; P>0.05) in either year or when the data for both years were analysed jointly. Indeed there were barely any correlations between abundance and the environmental variables assessed (). In contrast, biomass exhibited numerous correlations with the environmental variables (). Again, there was no significant systematic difference between years (Friedman's test; P>0.05). Biomass increased with depth (Spearman's rank; P<0.05) in the 1996 and 1998 data and when the 2 years were assessed jointly (). Both abundance and biomass exhibited a marked decline from 800 m to the 900 and 1000 m stations. This may coincide with the presence of a contourite sand sheet (Masson Citation2001), which supports a distinctly different fauna from that of depths immediately above and below it (Bett Citation2001).
Figure 2. Standing stock (a) abundance and (b) biomass of macrobenthic polychaetes down the West of Shetland Slope transect (individual years as symbols, mean value as line).
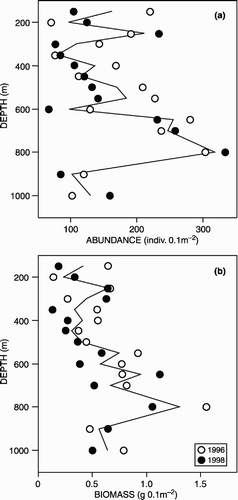
Table I. Spearman's rank correlations of polychaete standing stock with environmental parameters on the West Shetland Slope. Note that only the values of significant (P<0.05) correlations are shown.
Polychaete diversity
Variations in polychaete diversity and depth are illustrated in . There was no significant systematic difference in diversity between years for any of the measures examined (Friedman's test; P>0.05). Some similarity in the diversity pattern with depth was evident across the different measures: Shannon–Wiener, Margalef and Simpson indicated a mid-slope (500 m) enhancement, with some indication of mid-slope enhancement suggested in the Pielou and rarified species richness measures, although the region of enhancement was more diffuse (ca. 350–550 m). In contrast to the abundance data, there were many significant correlations (Spearman's rank; P<0.05) between diversity and environmental parameters (). Depth, sediment grain size, maximum temperature and temperature range provided the greatest number of correlations with the diversity parameters. Temperature range exhibited the greatest number of significant correlations with diversity, and in 11 of 14 cases yielded the strongest correlations with diversity. The latter observation is a reflection of the increased variability in bottom water temperature encountered at mid-slope depths (ca. 300–500 m) and the corresponding enhancement of diversity at these depths.
Figure 3. Diversity of macrobenthic polychaetes down the West of Shetland Slope transect (individual years as symbols, mean value as line); habitat temperature range also shown.
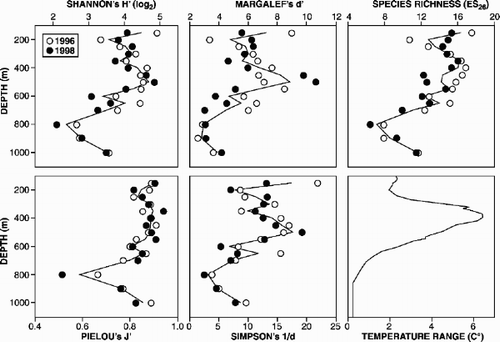
Table II. Spearman's rank correlations of polychaete diversity with environmental parameters on the West Shetland Slope. Note that only the values of significant (P<0.05) correlations are shown and that the strongest correlation in each row of the table is indicated in bold.
Multivariate analysis
An initial examination of the data set using cluster analysis and MDS indicated considerable faunal variation between years. This apparent temporal variation was, however, primarily driven by the collection of different species represented by only one individual in any 1 year. For further analysis, the original data set was reduced to only those species recorded in both years, 129 species present only in single samples were excluded, as were 88 other species recorded in only one sampling year. Cluster analysis of the reduced data set () produced three primary groups of samples corresponding to the upper (150–500 m), mid- (500–600 m) and lower slope (650–1000 m). Within the mid- and lower slope clusters there appeared to be a good match between sample depths across the year (i.e. little indication of temporal variation). However, there was evidence of segregation of the 2 years within the upper slope cluster.
Figure 4. Multivariate analysis of macrobenthic polychaete species composition down the West Shetland Slope transect: (a) cluster analysis and (b) multidimensional scaling ordination. The site samples are coded by depth (A, 150 m; B, 200 m... O, 1000m) and year (6, 1996; 8, 1998). Stress values 1996=0.1; 1998=0.16.
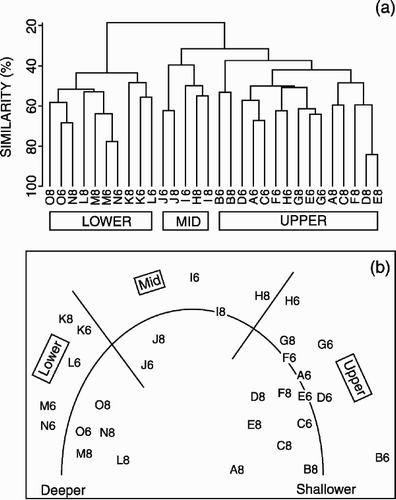
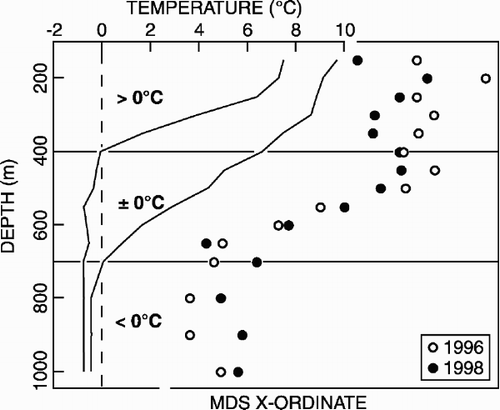
MDS of the reduced data set () produced a clear separation of the upper and lower slope samples along the x-ordinate, with the mid-slope samples arranged between them. A continuous variation in faunal composition with depth appeared to be present (as indicated on ), represented on both the x- and y-ordinates. The x-ordinate was correlated (Spearman's rank, P<0.005) with the full range of environmental variables (depth, mean grain size, silt and clay content, total organic carbon, organic content, and water temperature parameters), the highest correlation (0.828, P<0.001) with maximum water temperature. In contrast, the y-ordinate only exhibited a significant correlation (0.443, P<0.05) with water temperature range.
illustrates faunal variation (as indicated by the MDS x-ordinate) with the variation in bottom water temperature recorded during the 1996 survey. The basic similarity in the variation of the x-ordinate and of maximum temperature with depth is evident, with rapid change occurring at intermediate depths. The distinction of the upper, mid- and lower slope samples, suggested by the cluster analysis and MDS (see above), appears to exhibit some correspondence with the temperature regime, the upper slope remaining “warm” (>0°C), the lower slope remaining “cold” (<0°C).
Figure 5. Comparison of variation in macrobenthic polychaete species composition (as multidimensional scaling x-ordinate, see ) and habitat temperature regime (maximum and minimum values, see text for details) down the West Shetland Slope transect.
To make the correspondence analysis (CA) and CCA results comparable with the previous multivariate analyses, the same reduced data set was used. On the CCA plot, axis 2 separates the deeper stations from the shallower ones, while axis 1 further separates intermediate from shallow stations (). Axis 1 on the canonical ordination plots was the most important (). ter Braak (Citation1986) proposed that axes with an eigenvalue>0.5 have a relatively good dispersal of species along these axes and account for a high percentage of variance in species composition. Axis 2 separates the environmental variables into a group of temperature-related variables and a second group of sediment-related variables. There was also a high correlation between the environmental variables and the composition of the polychaete fauna on the first four axes (), with 57% of the variance of the biological data being accounted for by the 10 environmental variables measured.
Figure 6. Canonical correspondence analysis of the 1996 and 1998 combined reduced data set of the 20 most abundant polychaete species. Max, maximum temperature; Min, minimum temperature; Ran, temperature range; Sed, mean sediment grain size; Org, organic content; TOC, total organic carbon; Ari alb, Aricidea albatrossae; Ari cat, Aricidea catherinae; Cha set, Chaetozone setosa; Exo ver, Exogone verugera; Gly lap, Glycera lapidum complex; Het fil, Heteromastus filiformis; Lum tet, Lumbrineris tetraura; Min cir, Minuspio cirrifera; Opi pte, Opistodonta pterochaeta; Par jef, Paramphinome jeffreysii; Pho ass, Pholoe assimilis; Pit cri, Pista cristata; Pit lor, Pista lornensis; Pro kef, Protodorvillea kefersteini; Sca inf, Scalibregma inflatum; Spo kro, Spiophanes kroyeri; Spo wig, Spiophanes cf. wigleyi; Teb str, Terebellides stroemi.
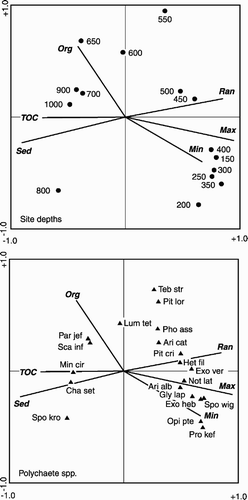
Table III. Results of the correspondence analysis (CA) and canonical correspondence analysis (CCA) for the reduced combined data set (1996 and 1998) of polychaete species and environmental variables.
An unrestricted Monte Carlo permutation test was applied to the forward selection of the environmental parameters. Three of these parameters accounted for a significant proportion of the variability seen, approximately 67.6% of the variance, where the variance of the environmental parameter was accepted at the ≤0.05 level (). Of these parameters, maximum temperature accounted for 39% of the variability measured.
Table IV. Results of the Monte Carlo permutation test based on forward selection with 999 unrestricted permutations analysing the influence of the environmental variables on the reduced combined (1996 and 1998) polychaete species data set. Variance of environmental variable accepted at the ≤0.05 level.
Discussion
Down-slope patterns in polychaete standing stock
Neither our abundance nor biomass results from the Faroe–Shetland Channel transect exhibited the generally expected exponential decline with increasing depth as seen in other regions. As noted in larger-scale studies spanning a greater depth range, this still remains the case (Bett Citation2001). Instead, the general trend in polychaete standing stock, similar between years, was an overall increase in abundance with depth. The density of polychaetes ranged from 70 to >300 individuals 0.1 m−2 with biomass ranging from 0.13 to 1.55 wet g 0.1 m−2. Polychaetes dominated the macrofauna, comprising nearly 40% of the total number of individuals at every station (Narayanaswamy Citation2000). The main peak in total macrofaunal abundance occurred between 500 and 800 m. Thus, it is not surprising that the patterns seen here for polychaete abundance plotted against depth mirror those for the total macrofaunal abundance pattern (Bett Citation2000, Citation2001; Narayanaswamy Citation2000). Polychaete biomass was more variable, ranging from 2 to 85% of the total macrobenthos.
On the shelf and upper slope, polychaetes contributed 20–40% of the total biomass, whereas on the lower slope and on the Channel floor, polychaetes contributed 60–80% of the total biomass on the West Shetland Slope (Bett Citation2000). In their studies of Arctic benthos from depths of 1000 to 2000 m, Paul & Menzies (Citation1974) found that while polychaetes comprised 42% of the total number of individuals, they only accounted for 5% of the total biomass.
Polychaete diversity patterns
A peak in species richness and diversity was generally evident at intermediate depths (400–500 m), followed by a decline with increasing depth. This also appears to hold true for polychaetes collected more widely along the West Shetland Slope during the AFEN 1996 survey (see and ). The region of enhanced polychaete diversity (ca. 300–500 m) may correspond with a zone of elevated habitat temperature range (), as has been suggested for the macrobenthos as a whole on the West Shetland Slope (Bett Citation2001). The depth of the diversity maximum is significantly shallower than previously reported in other areas (e.g. see Rex Citation1981; Maciolek et al. Citation1987a,Citationb; Rex et al. Citation1997). In the North-west Atlantic, and in some regions of the North-east Atlantic, macrofaunal diversity has been seen to vary parabolically with depth (Rex Citation1981, Citation1983; Etter & Grassle Citation1992; Rex et al. Citation1993; Paterson & Lambshead Citation1995). Not all areas of the deep sea, however, exhibit comparable bathymetric diversity patterns. Blake et al. (Citation1985, Citation1987), in their study of biological processes on the South Atlantic slope and rise, did not detect a depth-related pattern in diversity, supporting the conclusion reached from some areas of the North-east Atlantic (below) that depth-related patterns in benthic diversity vary geographically.
Figure 7. Summary presentation of the AFEN polychaete data set (see text for details). Species diversity (as rarefied species richness), species bathymetric distributions (as “arrival”, depth of first occurrence; “departure”, depth of last occurrence; and “turnover”, sum of arrivals and departures), and variation in species composition (as multidimensional scaling x-ordinate) are illustrated with habitat temperature parameters (absolute temperature; temperature range).
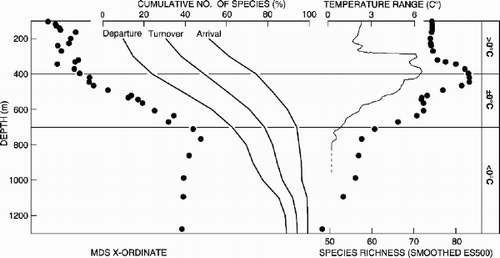
In the present study, species diversity correlated most strongly with organic content, sediment grain size and habitat temperature range. In our analysis of the AFEN 1996 survey polychaete data there was also a strong correlation between temperature range and species richness and diversity (P<0.002; see ), as has also been noted for the macrobenthos as a whole (Bett Citation2001). However, species richness measures for the entire macrobenthos of the AFEN 1996 survey also exhibited significant correlations with depth (Spearman's rank correlation: sample S −0.602, P<0.001; Margalef's d −0.573, P<0.005; rarefied species richness ES500 −0.484, P<0.01). In contrast, Etter & Grassle (Citation1992) found that species diversity in the western North Atlantic was significantly correlated with sediment heterogeneity and not with water depth.
Pielou's evenness and Simpson's dominance remained relatively constant at all depths. Similarly, evenness and dominance measures of the AFEN polychaete data set did not correlate significantly with depth (P>0.05). Along the Hebridean slope, Gage et al. (Citation2000) noted that samples from shallower stations had a much higher dominance and lower evenness than those from their deeper stations. A high level of hydrodynamic disturbance at the shallower sites was thought to result in the greater species dominance. This is contrary to the results of the present study, in which lower evenness and higher dominance were encountered at the deepest stations. Our results also contrast with those of Flach & de Bruin (Citation1999) from a transect of the Goban Spur, where they noted that species richness and evenness increased with water depth. These differences may well be related to the dynamic and unusual temperature regime encountered on the West Shetland Slope. We expect this type of pattern to be found in other areas experiencing similar hydrographic conditions, e.g. north of Iceland (Weishappel & Svavarsson Citation1998).
Polychaete species distribution patterns
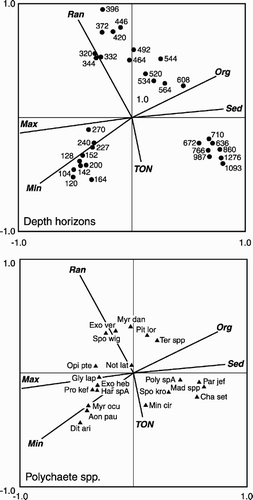
Species distribution and composition may be affected by many environmental factors, e.g. depth, temperature, sediment grain size (Rex Citation1981; Pineda Citation1993; Brandt Citation1995; Probert et al. Citation1996). By using CCA we were able to determine which environmental variables significantly influenced the polychaete fauna. The CCA ordination plot and Monte Carlo analysis showed that temperature, generally maximum temperature, had the greatest influence on the distribution of polychaete species. The shallowest stations, and the species generally found there in high numbers, were closely associated with the temperature eigenvectors. This suggests an ability to tolerate higher water temperatures, whereas species associated with the deeper stations appeared not to be able to tolerate high water temperatures or a wide range of temperatures. However, species and sites at intermediate depths were strongly linked with temperature range, which allowed us to infer that they were able to withstand a relatively high temperature range. The CCA plot of the AFEN polychaete data () clearly shows a very similar distribution of depth horizons and species relative to the different environmental variables. Again the temperature variables had the greatest influence on the shallower depth horizons. Several species and stations appear to lie on the inverse of the temperature range, suggesting that these species were not tolerant of a wide range of temperatures. Monte Carlo analysis also indicated that temperature, maximum and minimum, accounted for the greatest proportion of the variability within the AFEN polychaete data (36 and 22%, respectively). Organic content and mean sediment grain size also accounted for a significant proportion of the variability, 9.3 and 7.6%, respectively.
Figure 8. Canonical correspondence analysis of the AFEN polychaete data set (see text for details), reduced to the 20 most abundant species. Max, maximum temperature; Min, minimum temperature; Ran, temperature range; Sed, mean sediment grain size; Org, organic content; TOC, total organic carbon; Aon pau, Aonides paucibranchiata; Cha set, Chaetozone setosa; Dit ari, Ditrupa arietina; Exo heb, Exogene hebes; Exo ver, Exogone verugera; Gly lap, Glycera lapidum complex; Har spA, Harmothoe sp. A; Mad spp., Maldaninae spp.; Min cir, Minuspio cirrifera; Myr dan, Myriochele danielsseni; Myr ocu, Myriochele oculata; Not lat, Notomastus latericus; Opi pte: Opistodonta pterochaeta; Par jef, Paramphinome jeffreysii; Poly spA, Polycirrus sp. A; Pro kef, Protodorvillea kefersteini; Pit lor, Pista lornensis; Spo kro, Spiophanes kroyeri; Spo wig, Spiophanes cf. wigleyi; Ter spp, Terebellidae spp.
nMDS analyses of the West Shetland Slope transect data () and the wider AFEN survey area data () suggest a highly consistent (both temporally and spatially) interpretation of the large-scale distribution of polychaete species in the eastern Faroe–Shetland Channel. The major variations in faunal composition appear to be linked with the temperature regime in the Channel, and perhaps with the particular water masses present. There was relative homogeneity of the fauna in the warmer (>0°C) upper water masses and in the cold (<0°C) Faroe–Shetland Channel bottom water ( and ). Rapid change in faunal composition was apparent in the 400–700 m depth range (), coincident with the zone of intermediate water masses and the dynamically located boundary between warm, Atlantic and sub-zero temperature, Arctic conditions (Sherwin Citation1991; Turrell et al. Citation1999).
A study undertaken by Palerud (Citation1992) on amphipod distribution off the Faroe Islands found that temperature appeared to be the main factor that explained the changes in species composition with increasing depth. Weishappel & Svavarsson (Citation1998) also found that temperature was the main variable influencing amphipod species composition and distribution in Icelandic waters.
In the Norwegian Sea it is thought that species diversity has probably been strongly influenced by isolation of the deep waters following the Quaternary glaciation (Dahl Citation1979). In other parts of the Northern Seas, to which the deep waters of the Faroe–Shetland Channel are an integral part, low diversity values are thought to reflect a young ecosystem (e.g. Paul & Menzies Citation1974). Although both the Rockall Trough and the Faroe–Shetland Channel have experienced glaciation, the fauna of the Rockall Trough has had a faster rate of “recovery” because species could recolonize from the adjacent shallow and deep Atlantic. In the Faroe–Shetland Channel, there is considerable continuity with the wider North-east Atlantic in species at depths above the maximum depth (500–600 m) of the Wyville Thomson Ridge. However, like other areas of the Northern Seas, the Wyville Thomson Ridge and other submarine sills may have prevented potential recolonization of benthic habitats from deep waters of the Atlantic. As the Faroe–Shetland Channel can be regarded as an extension of the Norwegian Sea, low species diversity below 600 m is perhaps expected. Temperature may have influenced the rate of invasion (Weishappel & Svavarsson Citation1998); temperature tolerance is thought to be one of the major factors inhibiting the ability of species to invade new habitats (Menzies et al. Citation1973).
In conclusion, results from the present study imply that water temperature replaces depth as the dominant variable influencing the polychaete community on a large scale in the Faroe–Shetland Channel, while other environmental variables such as sediment grain size influence the polychaetes more locally.
Acknowledgments
The authors wish to thank the Atlantic Frontier Environmental Network (AFEN) for funding this study. AFEN comprises: AGIP (UK) Ltd, Amerada Hess Ltd, BG E&P Ltd, BP Amoco, Chevron UK Ltd, Conoco (UK) Ltd, Enterprise Oil plc, Marathon Oil UK Ltd, Phillips Petroleum Company UK Ltd, Shell UK Exploration and Production Ltd, Statoil Ltd, Texaco North Sea UK Company, TotalFina, Veba Oil and Gas UK Ltd, Department of Trade and Industry, Joint Nature Conservation Committee and the Scottish Executive – Environment and Rural Affairs Department. We would also like to thank the crew of the RRS Charles Darwin for their help in collecting the samples. This work was based on PhD studies of the lead author undertaken at the Scottish Association for Marine Science and the School of Ocean and Earth Sciences, University of Southampton.
Notes
Published in collaboration with the University of Bergen and the Institute of Marine Research, Norway, and the Marine Biological Laboratory, University of Copenhagen, Denmark
Editorial responsibility: Tore Høisæter
References
References
- AFEN 2000 Environmental Surveys of the Seafloor of the UK Atlantic Margin Atlantic Frontier Environmental Network [CD-ROM]. ISBN 09538399-0-7
- Barnett , PRO , Watson , J and Connelly , D . 1984 . A multiple corer for taking virtually undisturbed samples from shelf, bathyal and abyssal sediments . Oceanologica Acta , 7 : 399 – 408 .
- Belyaev GM 1966 Bottom Fauna of the Ultra-abyssal of the World Ocean Moscow Institute of Oceanography, USSR Academy of Sciences (in Russian; translated by Israel Program for Scientific Translations, Jerusalem, 1972)
- Bett BJ 1997 RRS Charles Darwin cruise 101C leg 2 14 Jul–20 Aug 1996 Atlantic Margin Environmental Survey: seabed survey of the shelf edge and slope west of Scotland Southampton Oceanography Centre, Cruise Report No. 7
- Bett BJ 1999 RRS Charles Darwin cruise 112C, 19 May–24 June 1998 Atlantic Margin Environmental Survey: seabed survey of deep-water areas (17th round tranches) to the north and west of Scotland Southampton Oceanography Centre, Cruise Report No. 25
- Bett BJ 2000 Benthic ecology of the Faeroe–Shetland Channel Section 4.3.1 in Environmental Surveys of the Seafloor of the UK Atlantic Margin. Atlantic Frontier Environmental Network [CD-ROM]. ISBN 09538399-0-7
- Bett , BJ . 2001 . UK Atlantic Margin Environmental Survey: Introduction and overview of bathyal benthic ecology . Continental Shelf Research , 21 : 917 – 56 .
- Bett BJ Gage JD 2000 Practical approaches to monitoring the deep-sea environment of the UK Atlantic Margin Section 6.2 in Environmental Surveys of the Seafloor of the UK Atlantic Margin. Atlantic Frontier Environmental Network [CD-ROM]. ISBN 09538399-0-7
- Blake JA Hecker B Grassle JF Brown B Wade M Boehm D Baptiste E Hilbig B Maciolek N Petrecca R Ruff RE Starczak V Watling L 1987 Study of Biological Processes on the U.S. South Atlantic Slope and Rise Phase 2. Final Report. Prepared for U.S. Department of the Interior, Minerals Management Service, Washington DC, under Contract No.14-12-0001-30064
- Blake JA Hecker B Grassle JF Maciolek-Blake N Brown B Curran M Dade B Freitas S Ruff RE 1985 Study of Biological Processes on the U.S. South Atlantic Slope and Rise Phase 1. Benthic Characterisation Study. Final Report. Prepared for U.S. Department of the Interior, Minerals Management Service, Washington, DC, under Contract No. 14-12-0001-30064
- Bouchet , P and Warén , A . 1979 . The abyssal molluscan fauna of the Norwegian Sea and its relation to other faunas . Sarsia , 64 : 211 – 43 .
- Brandt , A . 1995 . Peracarid fauna (Crustacea, Malacostraca) of the northeast water polynya off Greenland – documenting close benthic–pelagic coupling in the westwind trough . Marine Ecology Progress Series , 121 : 39 – 51 .
- Carney RS Haedrich RL Rowe GT 1983 Zonation of fauna in the deep sea In: Rowe GT, editor The Sea 8 New York Wiley-Interscience p 371–98
- Clarke KR Warwick RM 1994 Change in Marine Communities: an Approach to Statistical Analysis and Interpretation.l Plymouth National Environmental Research Council
- Clifford HT Stephenson W 1975 An Introduction to Numerical Classification London Academic Press
- Dahl , E . 1979 . Amphipoda Gammaridea from the deep Norwegian Sea. A preliminary report . Sarsia , 64 : 57 – 60 .
- Dahl , E , Laubier , L , Sibuet , M and Stromberg , J-O . 1976 . Some quantitative results on benthic communities of the deep Norwegian Sea . Astarte , 9 : 61 – 79 .
- Dooley , HD and Meincke , J . 1981 . Circulation and water masses in the Faroese Channels during Overflow 73 . Deutsche Hydrographische Zeitshrift , 34 : 41 – 54 .
- Etter , RJ and Grassle , JF . 1992 . Patterns of species diversity in the deep sea as a function of sediment particle size diversity . Nature , 360 : 576 – 8 .
- Etter , RJ and Rex , MA . 1990 . Population differentiation decreases with depth in deep-sea gastropods . Deep-Sea Research , 37 : 1251 – 61 .
- Flach , E and de Bruin , W . 1999 . Diversity patterns in macrobenthos across a continental slope in the NE Atlantic . Journal of Sea Research , 42 : 303 – 23 .
- Flach , E , Lavaleye , M , de Stigter , H and Thomsen , L . 1998 . Feeding types of the benthic community and particle transport across the slope of the N.W. European continental margin (Goban Spur) . Progress in Oceanography , 42 : 209 – 31 .
- Flach , E and Thomsen , L . 1998 . Do physical and chemical factors structure the macrobenthic community at a continental slope in the NE Atlantic? . Hydrobiologia , 375/376 : 265 – 85 .
- Frederiksen , R , Jensen , A and Westerberg , H . 1992 . The distribution of the scleractinian coral Lophelia pertusa around the Faroe Islands and the relation to internal mixing . Sarsia , 77 : 157 – 71 .
- Gage JD 2002 Benthic biodiversity across and along the Continental Margin: patterns, ecological and historical determinants, and anthropogenic threats In: Wefer G, Billett D, Hebbeln D, Jørgensen BB, Schlüter M, Vanweering T, editors Ocean Margin Systems Berlin Springer p 307–21
- Gage , JD , Lamont , PA , Kroeger , K , Paterson , GLJ and Gonzalez-Vecino , JL . 2000 . Patterns in deep-sea macrobenthos at the continental margin: standing crop, diversity and faunal change on the continental slope off Scotland . Hydrobiologia , 440 : 261 – 71 .
- Gage JD Tyler PA 1991 Deep-sea Biology: a Natural History of Organisms at the Deep-sea Floor Cambridge Cambridge University Press
- Gray , JS . 1994 . Is deep-sea species diversity really so high? Species diversity of the Norwegian continental shelf . Marine Ecology Progress Series , 112 : 205 – 9 .
- Haedrich , RL , Rowe , GT and Polloni , P . 1980 . The megabenthic fauna in the deep sea south of New England, USA . Marine Biology , 57 : 165 – 79 .
- Hansen , B . 1985 . The circulation of the northern part of the Northeast Atlantic . Rit Fiskideildar , 9 : 110 – 26 .
- Hecker , B . 1990 . Variation in megafaunal assemblages on the continental margin south of New England . Deep-Sea Research , 37 : 37 – 57 .
- Hessler , RR and Jumars , PA . 1974 . Abyssal community analysis from replicate box cores in the central north Pacific . Deep-Sea Research , 21 : 185 – 209 .
- Hitchen K Ritchie JD 1986 Geological review of the West of Shetland area In: Brooks J, Glennie KW, editors Petroleum Geology of North West Europe 0 London Graham and Trotman p 737–47
- Hurlbert , SH . 1971 . The nonconcept of species diversity: a critique and alternative parameters . Ecology , 52 : 577 – 86 .
- Kruskal , JB . 1964 . Multidimensional scaling by optimising goodness of fit to a non-metric hypothesis . Psychometrika , 29 : 1 – 27 .
- Kruskal JB Wish M 1978 Multidimensional Scaling Beverly Hills CA Sage
- Lance , GN and Williams , WT . 1967 . A general theory of classificatory sorting strategies. I. Hierarchical systems . Computer Journal , 9 : 373 – 80 .
- Manly BF 1991 Randomisation and Monte Carlo Methods in Biology London Chapman and Hall
- Maciolek N Grassle JF Hecker B Boehm PD Brown B Dade B Steinhauer WG Baptiste E Ruff RE Petrecca R 1987a Study of Biological Processes on the U.S. Mid-Atlantic Slope and Rise Final Report Prepared for U.S. Department of the Interior, Minerals Management Service, under Contract No. 14-12-30064
- Maciolek N Grassle JF Hecker B Brown B Blake JA Boehm PD Petrecca R Duffy S Baptiste E Ruff RE 1987b Study of Biological Processes on the U.S. North Atlantic Slope and Rise Final Report Prepared for U.S. Department of the Interior, Minerals Management Service, under Contract No. 14-12-0001-30064
- McAleece N Lambshead PJD Paterson GLJ Gage JD 1997 BioDiversity Professional, beta version 2. Software package produced by the Natural History Museum, London and the Scottish Association for Marine Science, Oban
- Magurran AE 1988 Ecological Diversity and its Measurement London Chapman and Hall
- Masson DG 1997 RRS Charles Darwin cruise 101C leg 1, 05 Jun–13 Jul 1996 TOBI surveys of the continental slope west of Shetland Southampton Oceanography Centre, Cruise Report No. 6
- Masson , DG . 2001 . Sedimentary processes shaping the eastern slope of the Faeroe–Shetland Channel . Continental Shelf Research , 21 : 825 – 57 .
- Menzies RJ George RY Rowe GT 1973 Abyssal Environment and Ecology of the World Oceans New York Wiley-Interscience
- Narayanaswamy BE 2000 Macrobenthic ecology of the West Shetland Slope PhD Thesis University of Southampton
- Narayanaswamy , BE , Nickell , TD and Gage , JD . 2003 . Appropriate levels of taxonomic distinctness in deep-sea studies: species vs family . Marine Ecology Progress Series , 257 : 59 – 68 .
- Palerud , R . 1992 . Amphipods of the Faroes: patterns of distribution related to depth and water masses. Årbok 1990–91 . Nordurlandahusid i Føroyum Torshavn , 1992 : 83
- Paterson , GLJ and Lambshead , PJD . 1995 . Bathymetric patterns of polychaete diversity in the Rockall Trough, northeast Atlantic . Deep-Sea Research , 42 : 1199 – 214 .
- Paul , AZ and Menzies , RJ . 1974 . Benthic ecology of the high Arctic deep sea . Marine Biology , 27 : 251 – 62 .
- Pielou EC 1975 Ecological Diversity New York Wiley
- Pineda , J . 1993 . Boundary effects on the vertical ranges of deep-sea benthic species . Deep-Sea Research , 40 : 2179 – 92 .
- Probert , PK , Grove , SL , McKnight , DG and Read , GB . 1996 . Polychaete distribution on the Chatham Rise, southwest Pacific . International Revue der Gesamten Hydrobiologie , 81 : 577 – 88 .
- Rex , MA . 1976 . Biological accommodation in the deep-sea benthos: comparative evidence on the importance of predation and productivity . Deep-Sea Research , 23 : 975 – 87 .
- Rex MA 1977 Zonation in deep-sea gastropods: the importance of biological interactions to rates of zonation In: Keegan BF, Ceidigh PO, Boaden PJS, editors Biology of Benthic Organisms 0 New York Pergamon Press p 521–30
- Rex , MA . 1981 . Community structure in the deep-sea benthos . Annual Review of Ecology and Systematics , 12 : 331 – 53 .
- Rex MA 1983 Geographical patterns of species diversity in the deep-sea benthos In: Rowe GT, editor The Sea 8 New York Wiley-Interscience p 453–72
- Rex MA Etter RJ Stuart CT 1997 Large-scale patterns of species diversity in the deep-sea benthos In: Ormond RFG, Gage JD, Angel MV, editors Marine Biodiversity: Patterns and Processes 0 Cambridge Cambridge University Press p 94–121
- Rex , MA , Stuart , CT , Hessler , RR , Allen , JA , Sanders , HL and Wilson , GDF . 1993 . Global-scale latitudinal patterns of species diversity in the deep-sea benthos . Nature , 365 : 636 – 9 .
- Rex , MA , Watts , MC , Etter , RJ and O'Neill , S . 1988 . Character variation in a complex of rissoid gastropods from the upper continental slope of the western North Atlantic . Malacologia , 29 : 325 – 39 .
- Rowe GT 1971 Benthic biomass and surface productivity In: Costlow JD, editor Fertility of the Sea 2 New York Gordon and Breach p 441–54
- Rowe GT 1983 Biomass and production of the deep-sea macrobenthos In: Rowe GT, editor The Sea 8 New York Wiley-Interscience p 97–121
- Rowe GT Haedrich RL 1979 The biota and biological processes of the continental slope In: Doyle LJ, Pilkey OH, editors The Geology of Continental Slopes Tulsa OK Society of Economic Petrologists and Mineralogists Special Publication p 49–59
- Rowe , GT and Menzel , DW . 1971 . Quantitative benthic samples from the Deep Gulf of Mexico with comments on the measurement of deep-sea biomass . Bulletin of Marine Science , 21 : 556 – 66 .
- Rowe GT Pariente V 1992 Deep-sea Food Chains and the Global Carbon Cycle Dordrecht Kluwer
- Shepard , RN . 1962 . The analysis of proximities: multidimensional scaling with an unknown distance function. II . Psychometrika , 27 : 219 – 46 .
- Sherwin TJ 1991 Evidence of a deep internal tide in the Faeroe–Shetland Channel In: Parker BB, editor Tidal Hydrodynamics 0 New York John Wiley & Sons p 469–88
- Sibuet , M . 1979 . Distribution and diversity of asteroids in Atlantic abyssal basins . Sarsia , 67 : 179 – 86 .
- Simpson , EH . 1949 . Measurement of diversity . Nature , 163 : 688
- Somero , G . 1992 . Adaptations to high hydrostatic pressure . Annual Review of Physiology , 54 : 557 – 77 .
- Svavarsson , J , Brattegard , T and Stromberg , J-O . 1990 . Distribution and diversity patterns of asellote isopods (Crustacea) in the deep Norwegian and Greenland Sea . Progress in Oceanography , 24 : 297 – 310 .
- ter Braak , CJF . 1986 . Canonical correspondence analysis: a new eigenvector technique for multivariate direct gradient analysis . Ecology , 67 : 1167 – 79 .
- ter Braak , CJF . 1987 . The analysis of vegetation–environment relationships by canonical correspondence analysis . Vegetatio , 69 : 69 – 77 .
- ter Braak CJF Smilauer P 2002 CANOCO Reference Manual and User's Guide to Canoco for Windows: Software for Canonical Community Ordination (version 4.5) Ithaca NY Microcomputer Power
- Turrell , WR , Slesser , G , Adams , RD , Payne , R and Gillibrand , PA . 1999 . Decadal variability in the composition of Faroe Shetland Channel bottom water . Deep-Sea Research , 46 : 1 – 25 .
- Tyler , P and Shackley , SE . 1978 . Comparative efficiency of the Day and Smith–McIntyre grabs . Estuarine and Coastal Marine Science , 6 : 439 – 445 .
- Tyler , PA and Young , CM . 1998 . Temperature and pressure tolerance in dispersal stages of the genus Echinus (Echinodermata: Echinoidea): prerequisites for deep-sea invasion and speciation . Deep-Sea Research , 45 : 253 – 77 .
- Vinogradova , NG . 1962 . Vertical zonation in the distribution of the deep-sea benthic fauna in the ocean . Deep-Sea Research , 8 : 245 – 50 .
- Weishappel , JBF and Svavarsson , J . 1998 . Benthic amphipods (Crustacea: Malacostraca) in Icelandic waters: diversity in relation to faunal patterns from shallow to intermediate deep Arctic and North Atlantic Oceans . Marine Biology , 131 : 133 – 43 .